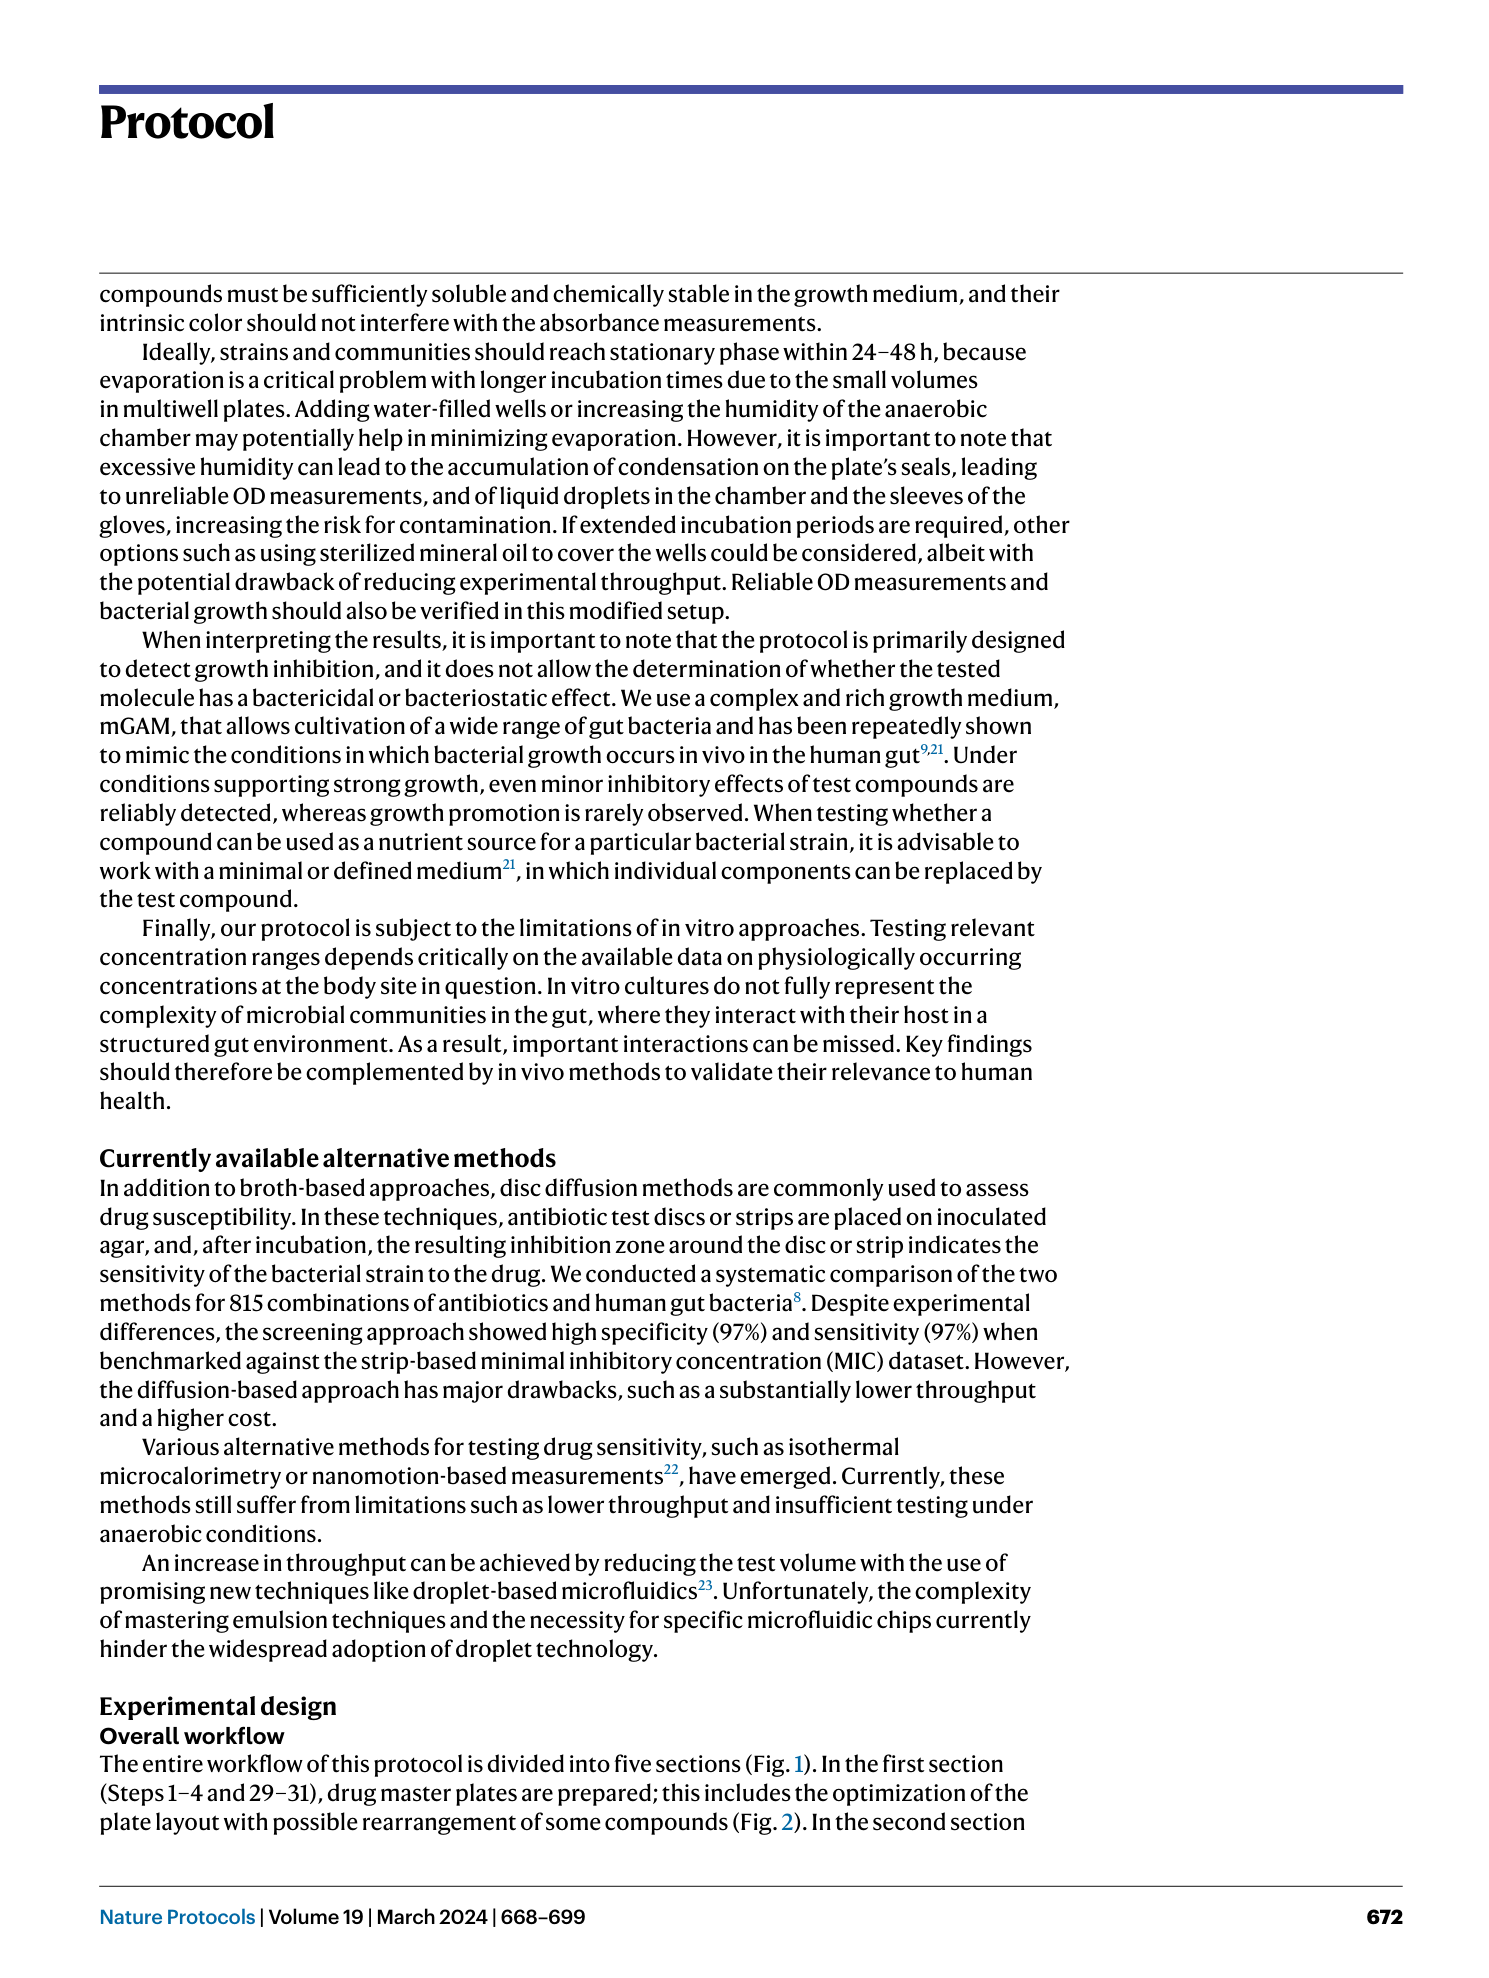
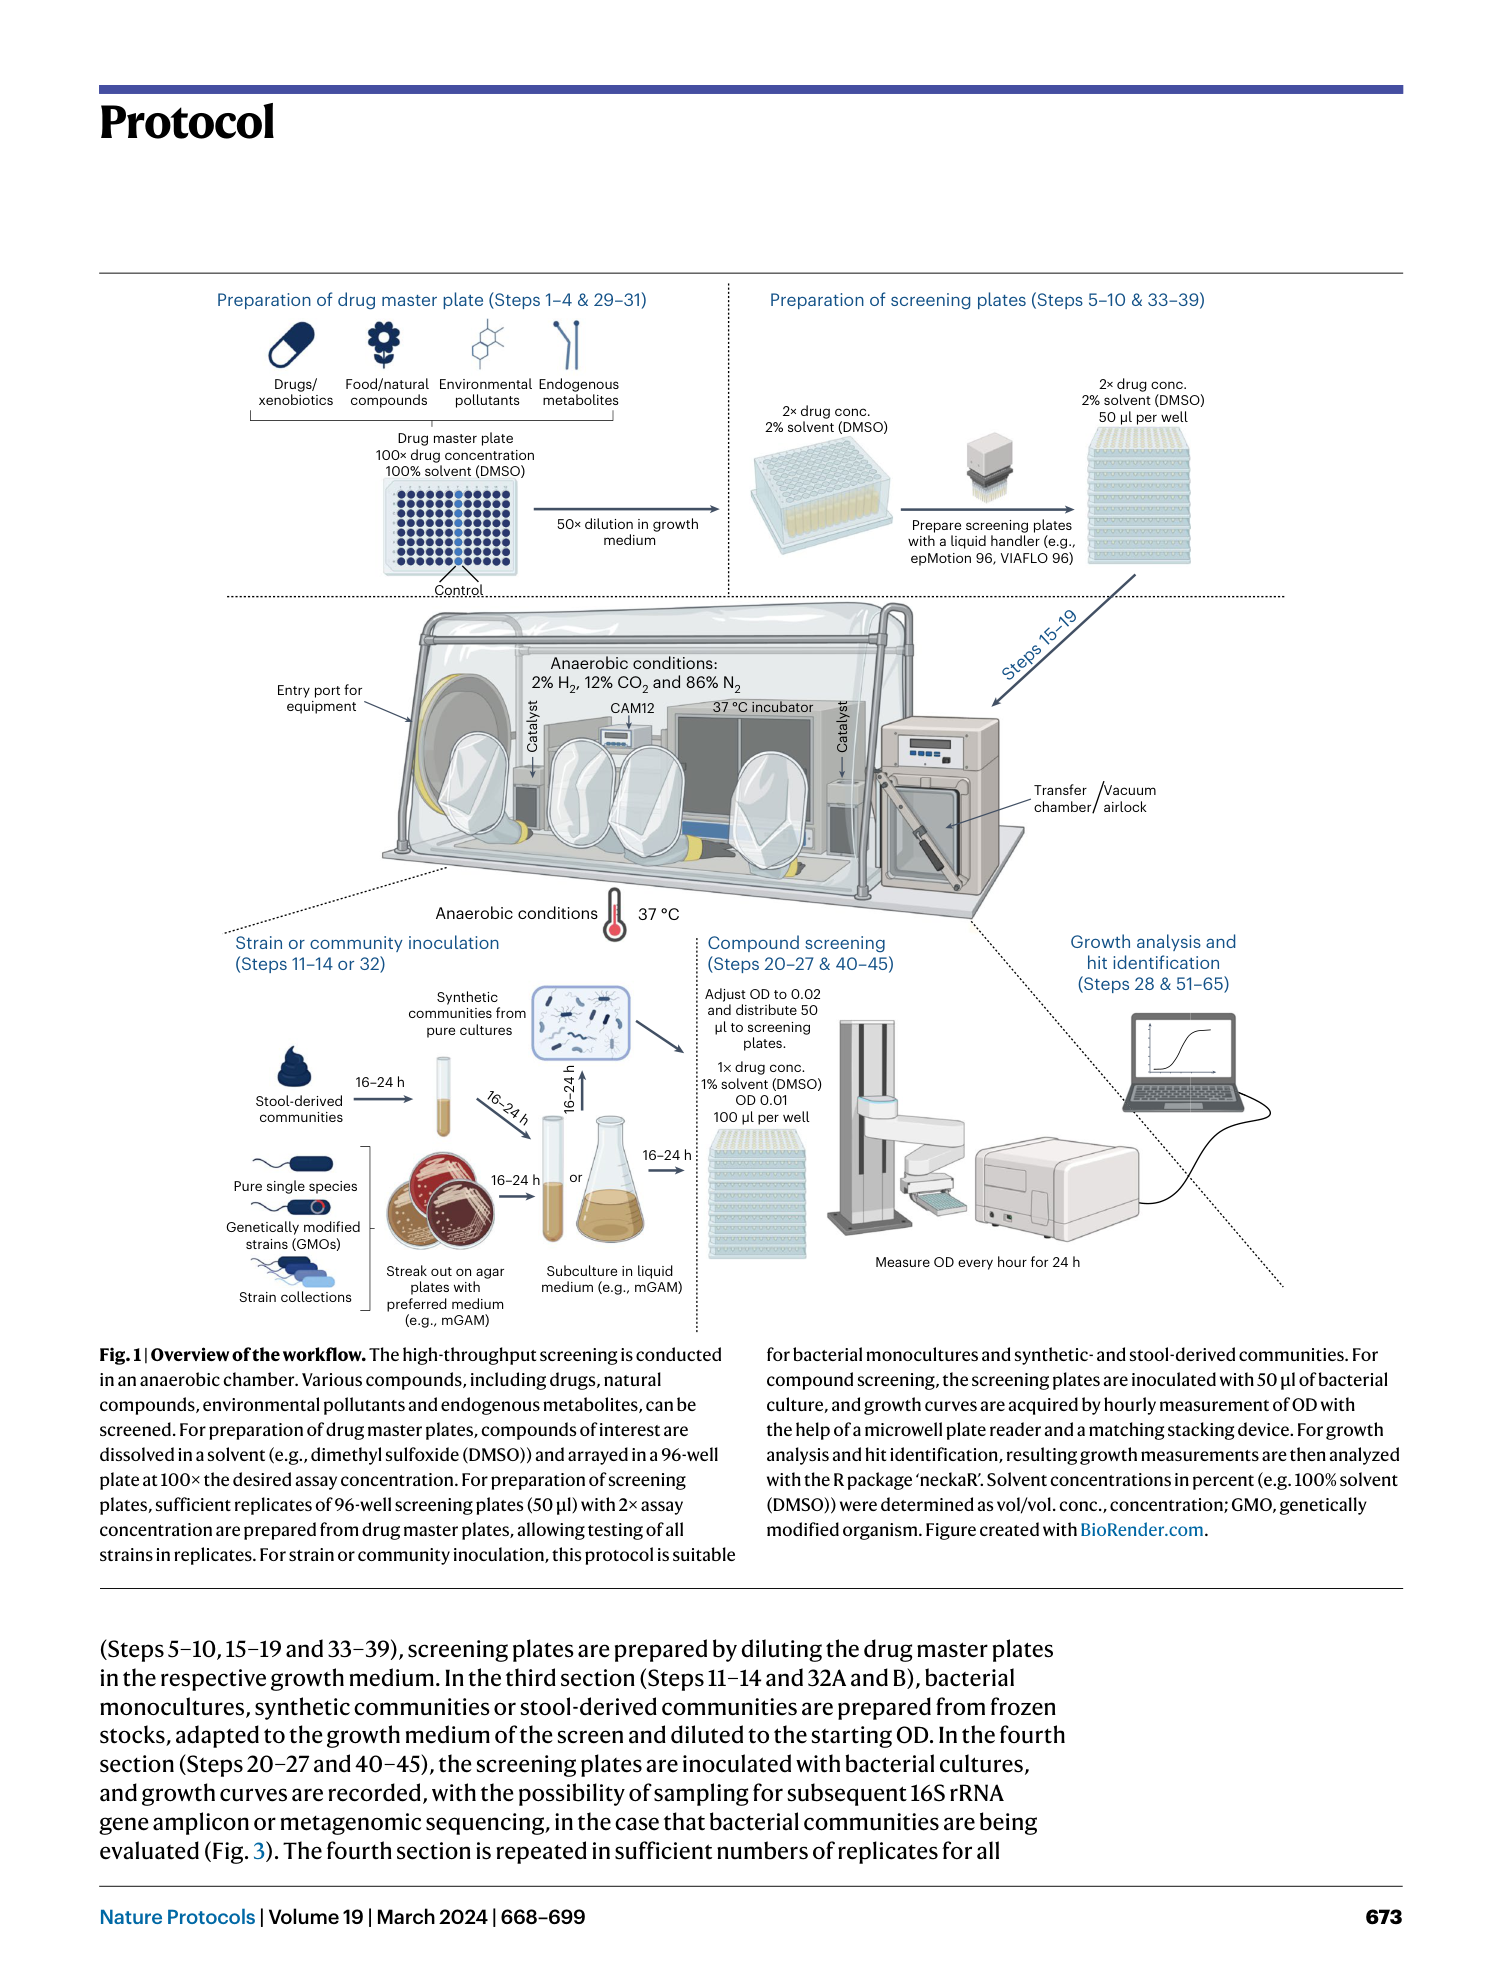
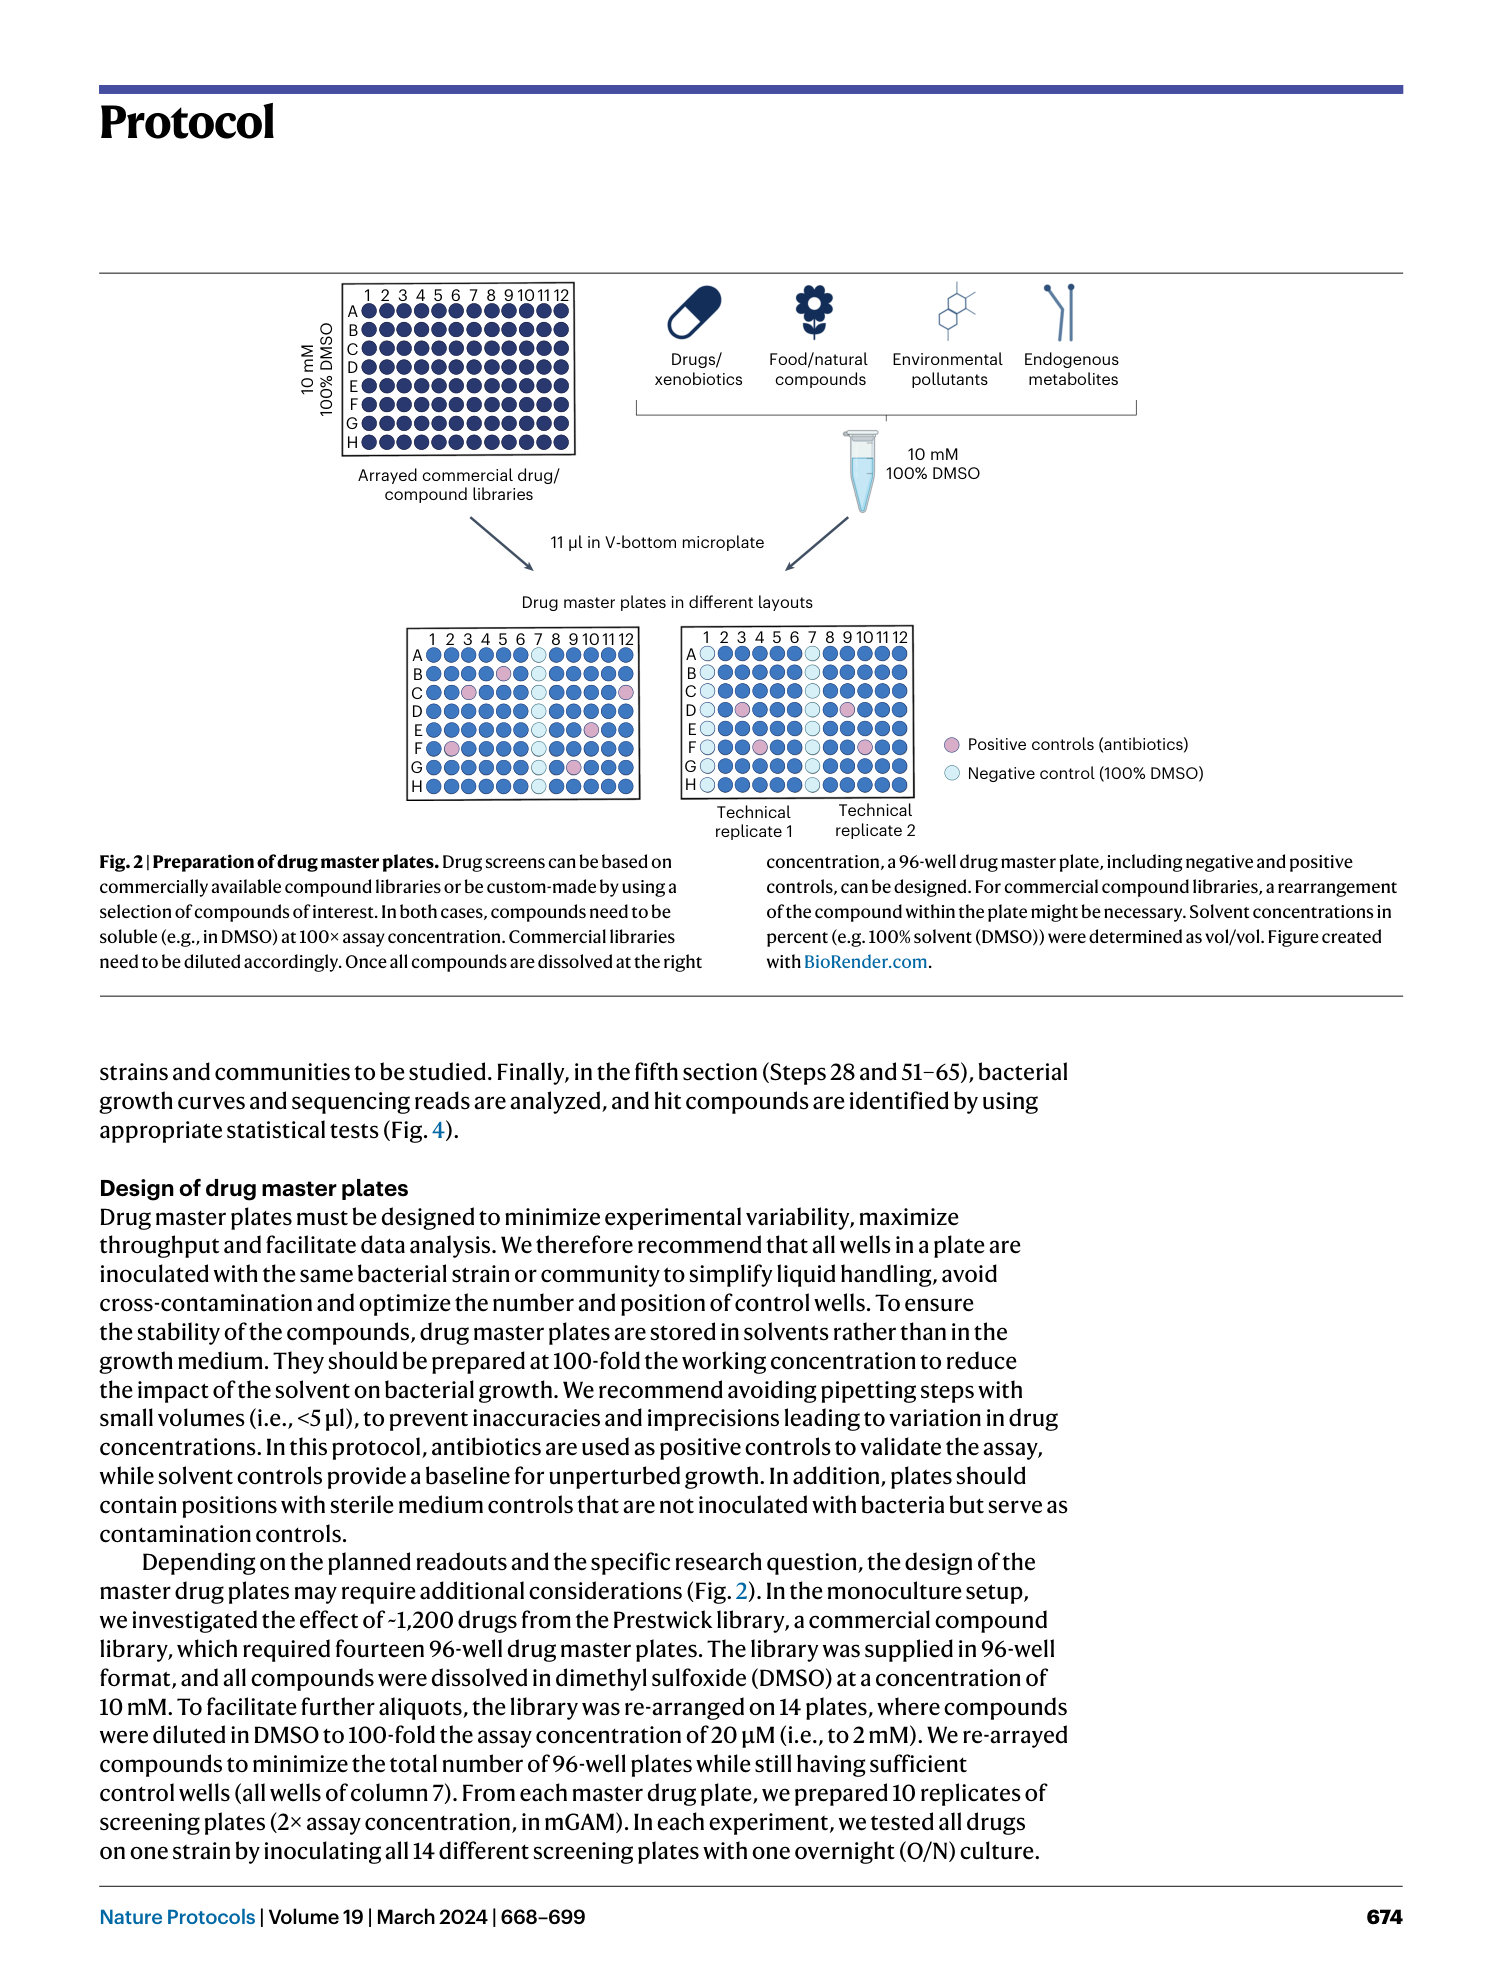
High-throughput anaerobic screening for identifying compounds acting against gut bacteria in monocultures or communities
Athanasios Typas, Patrick Müller, Jacobo de la Cuesta-Zuluaga, Michael Kuhn, Maral Baghai Arassi, Tim Treis, Sonja Blasche, Michael Zimmermann, Peer Bork, Kiran Raosaheb Patil, Sarela Garcia-Santamarina, Lisa Maier

Extended
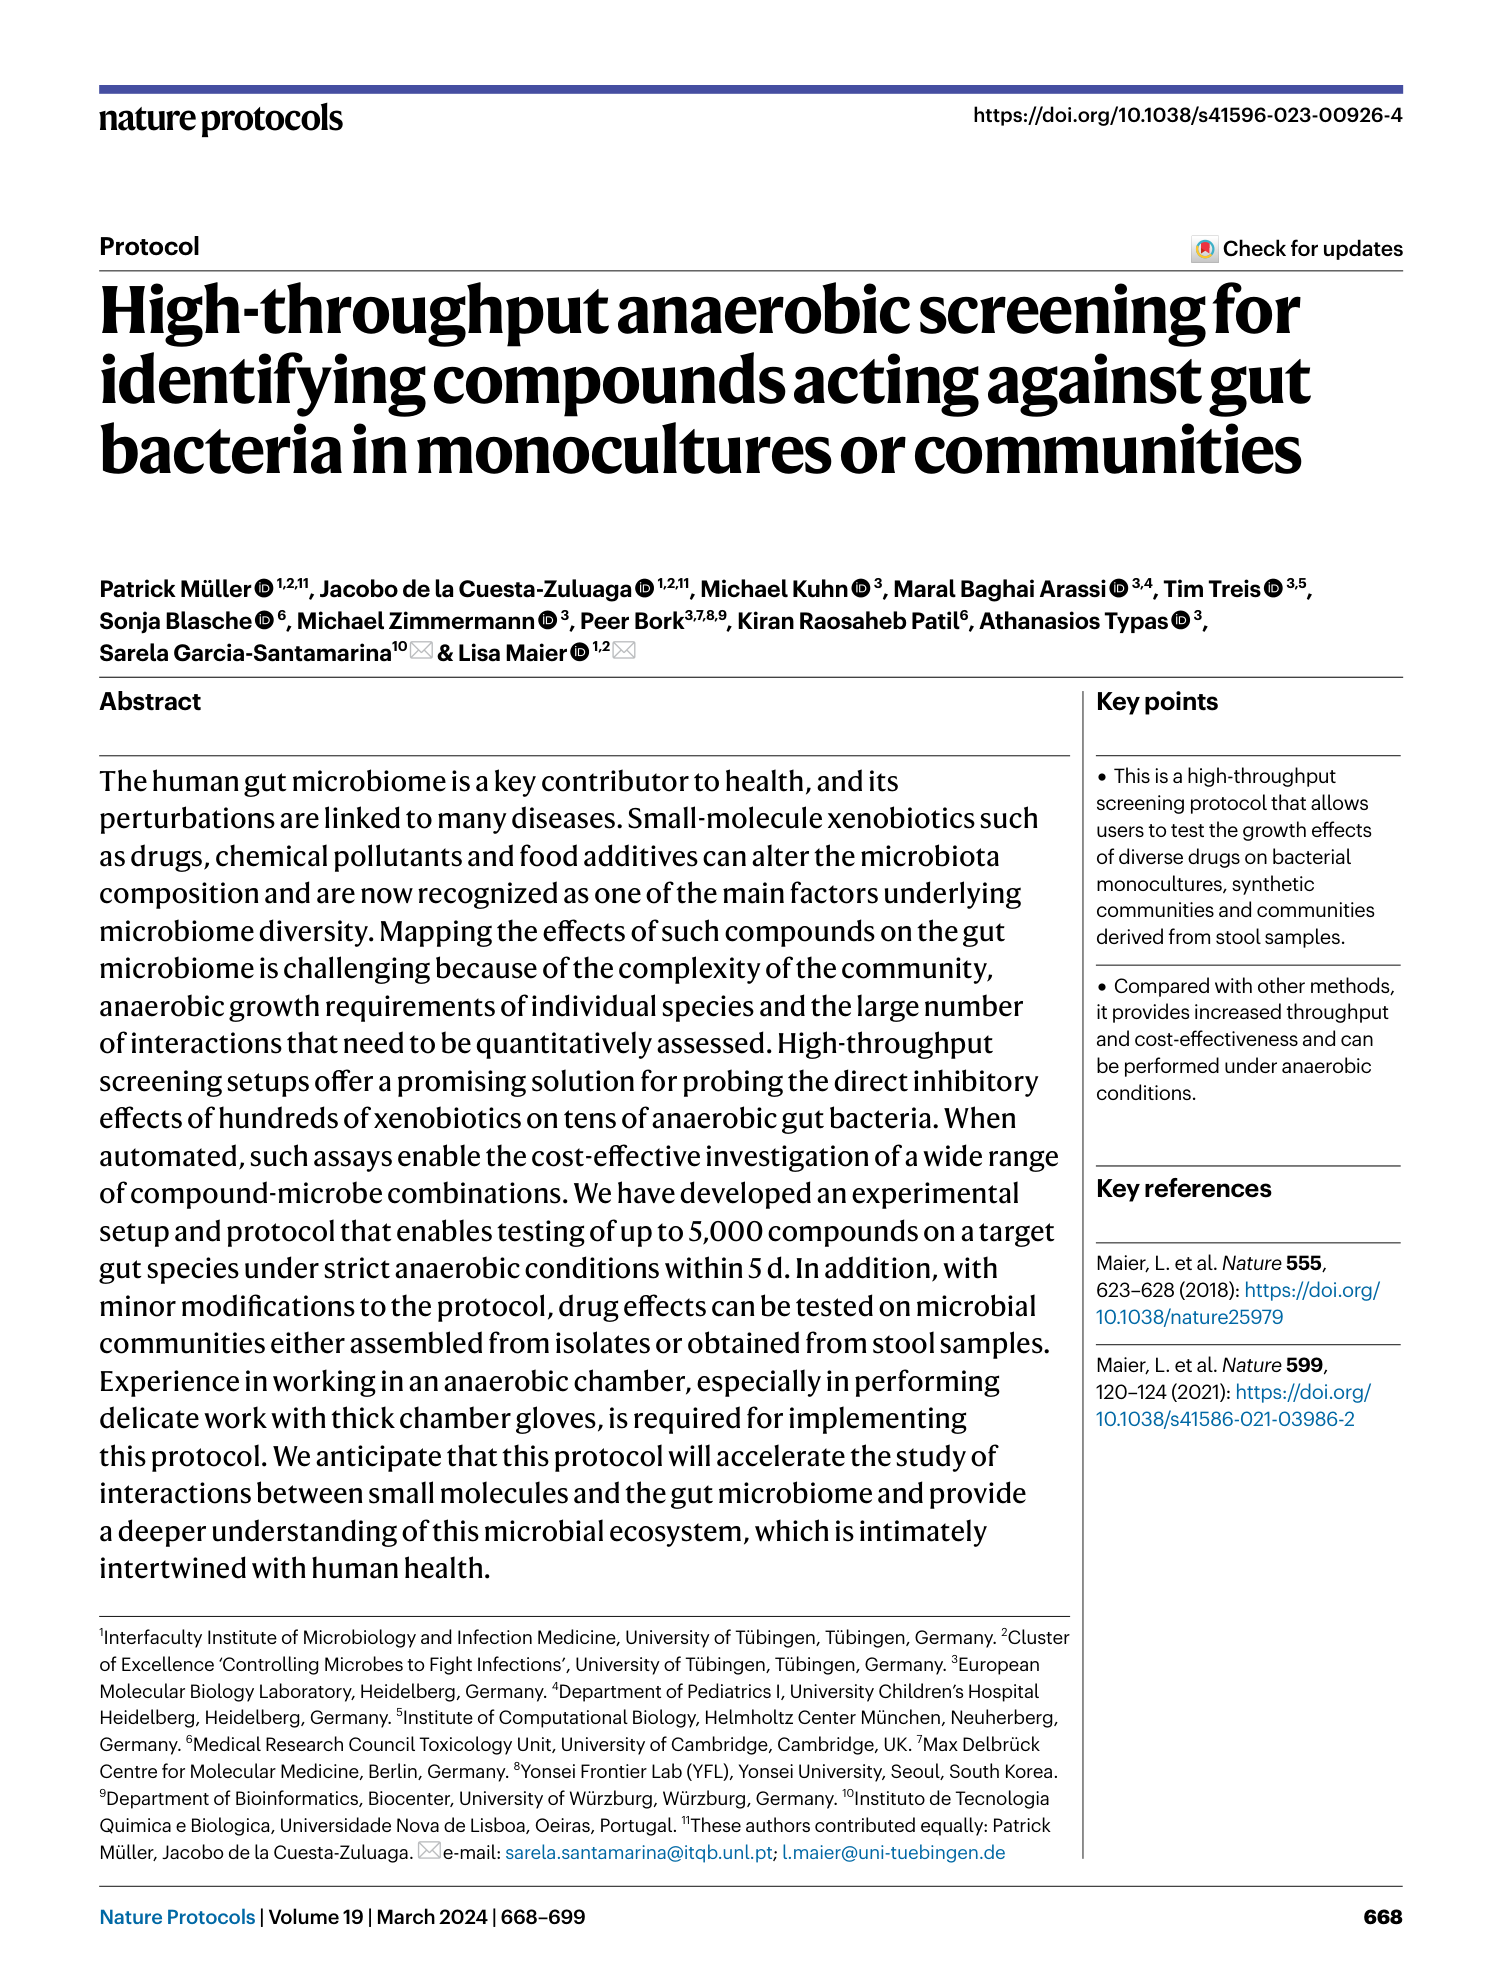
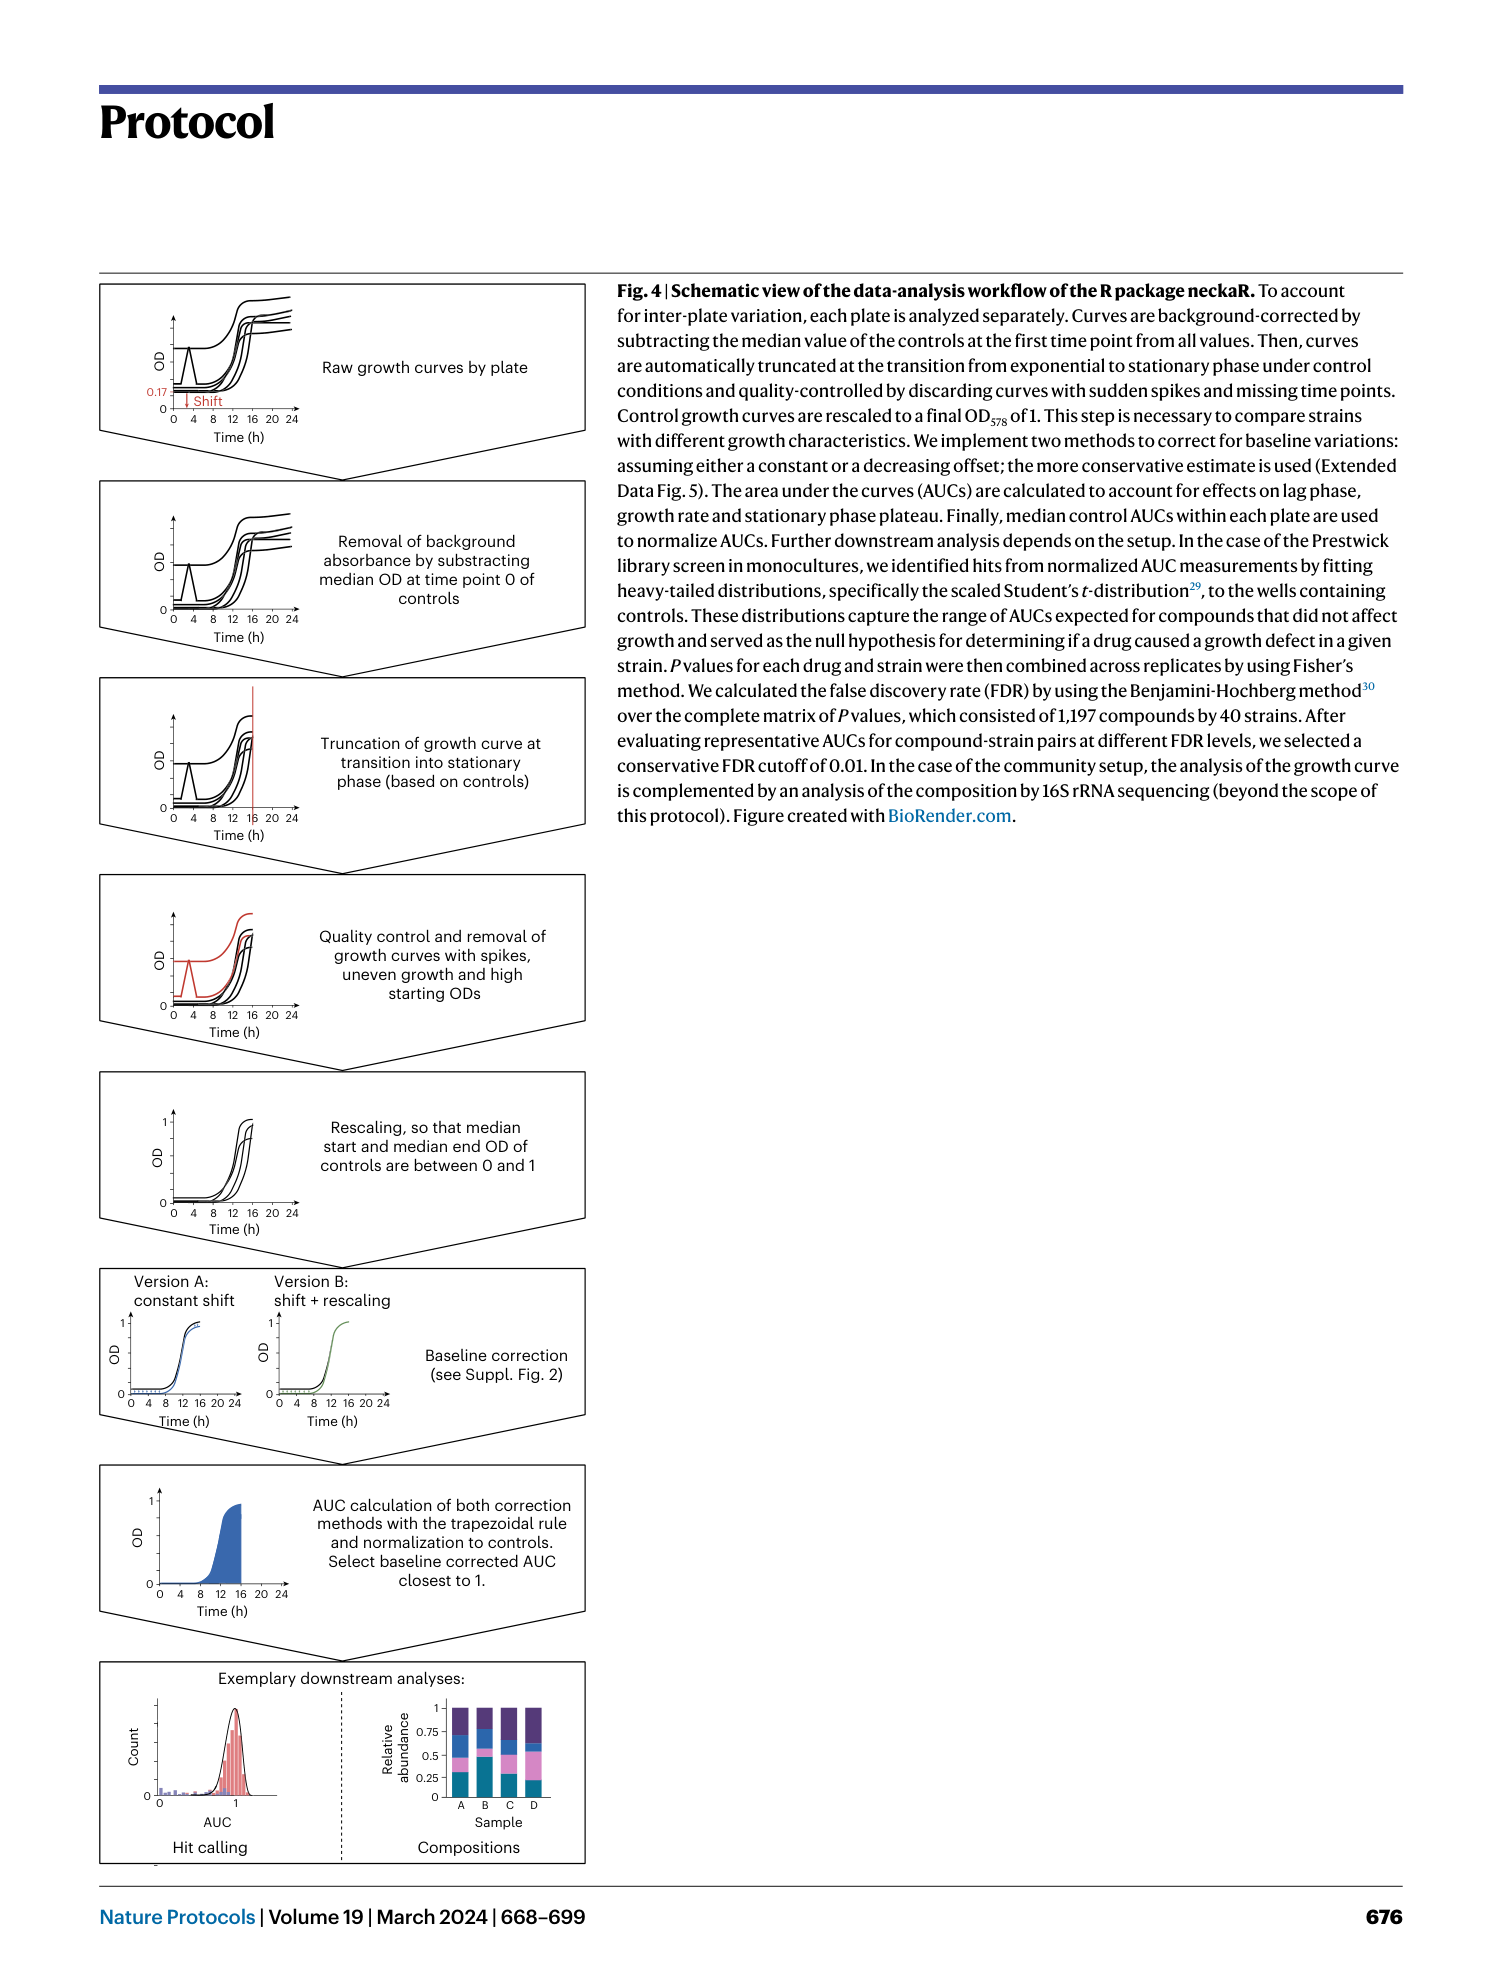
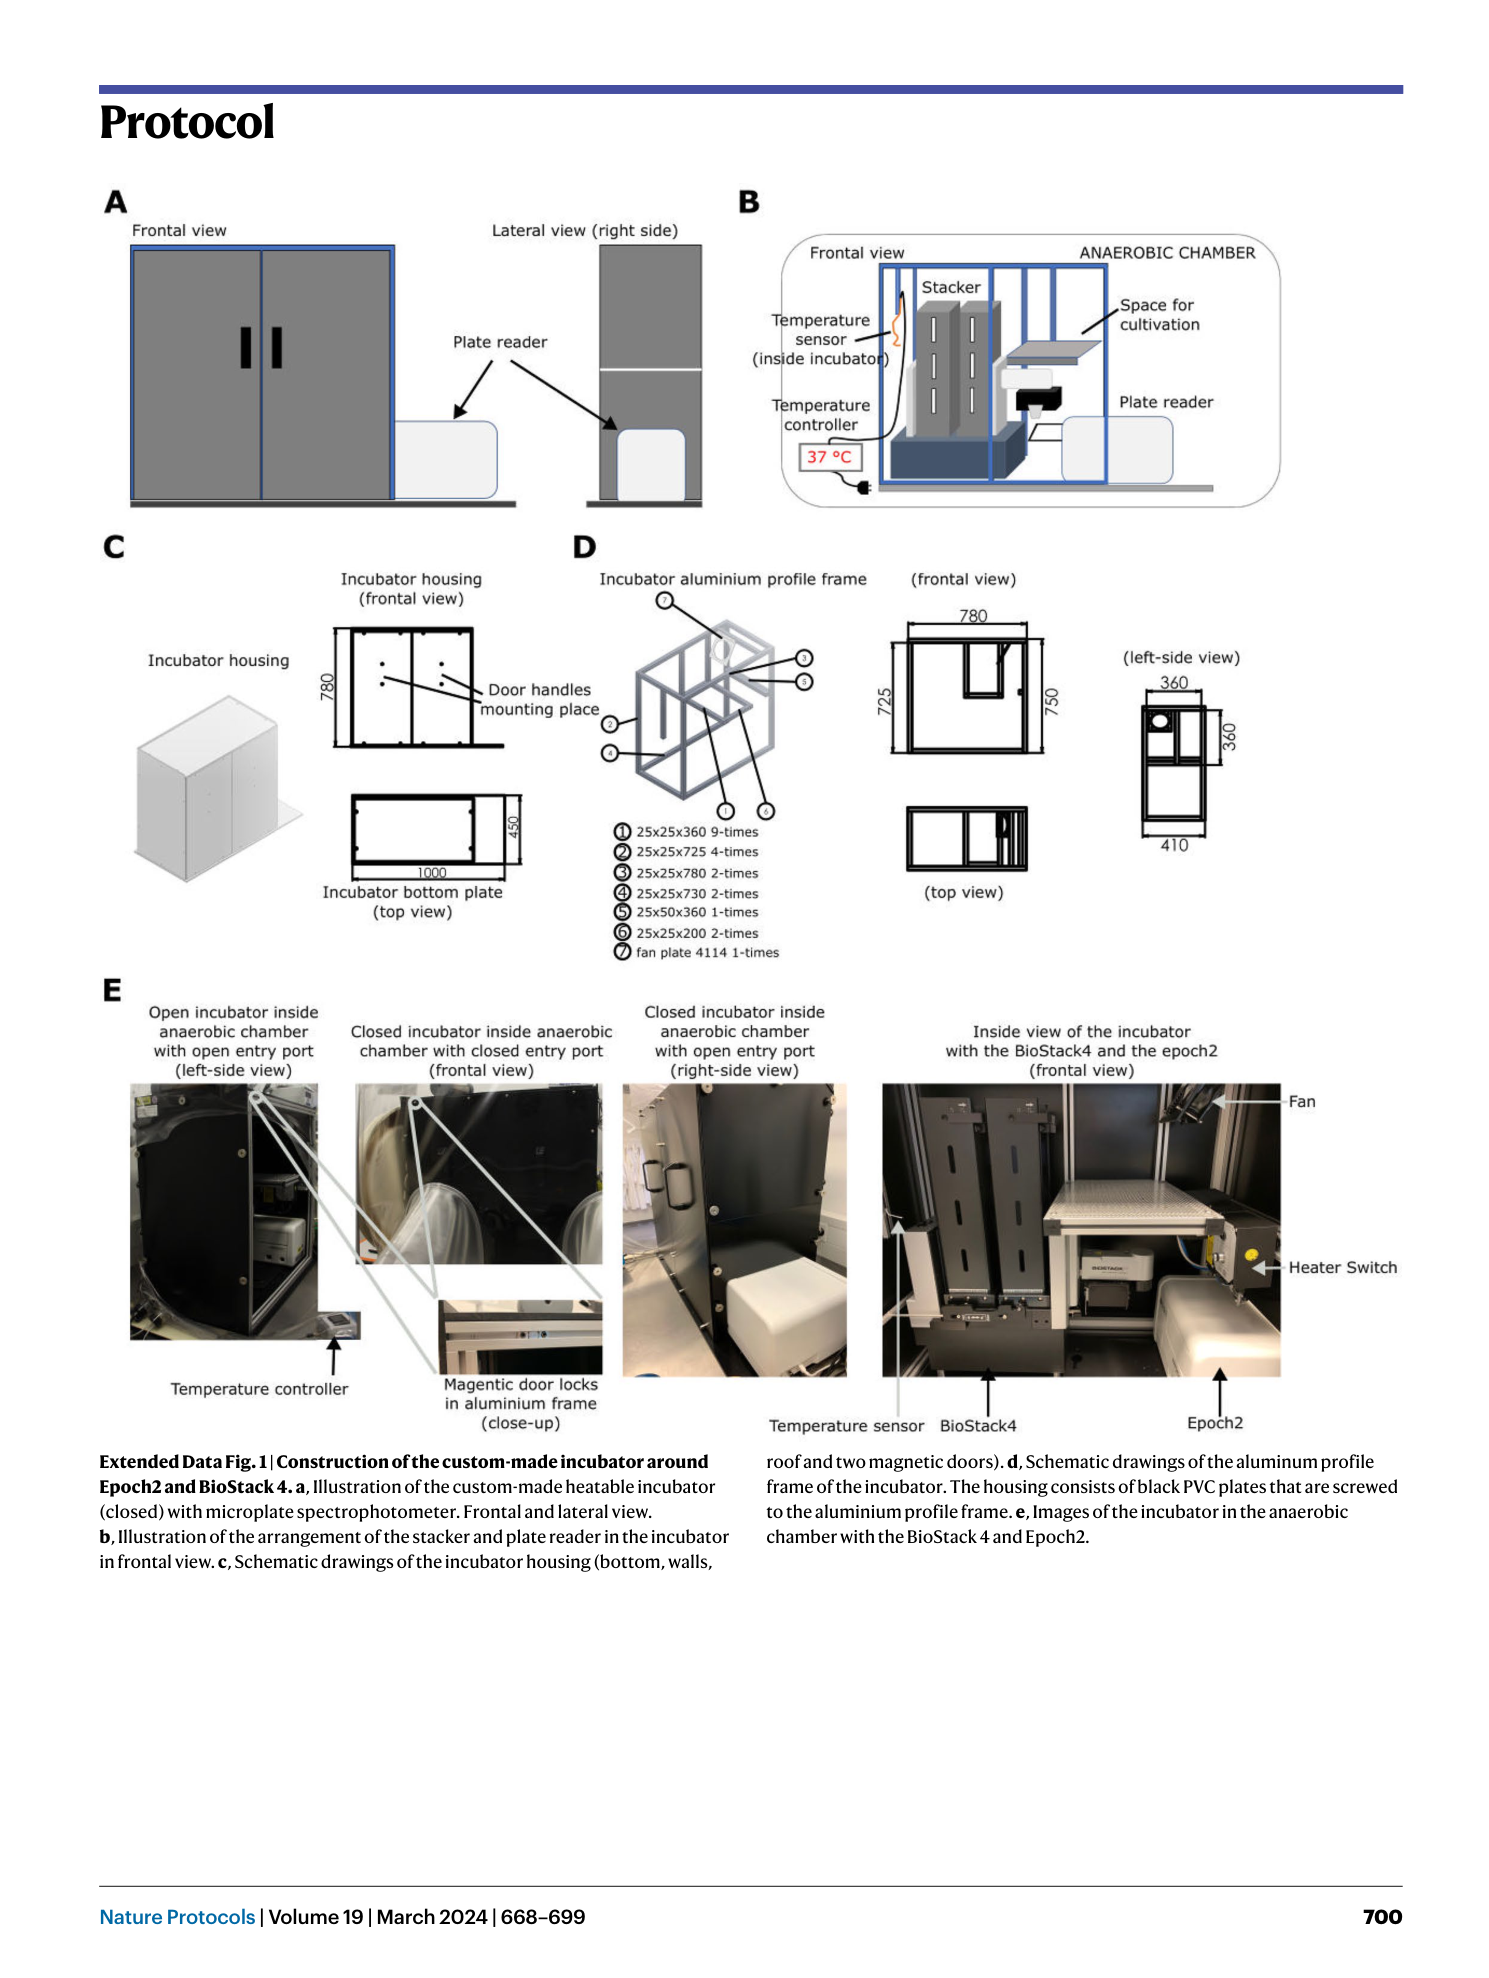
Extended Data Fig. 1 Construction of the custom-made incubator around Epoch2 and BioStack 4.
a , Illustration of the custom-made heatable incubator (closed) with microplate spectrophotometer. Frontal and lateral view. b , Illustration of the arrangement of the stacker and plate reader in the incubator in frontal view. c , Schematic drawings of the incubator housing (bottom, walls, roof and two magnetic doors). d , Schematic drawings of the aluminum profile frame of the incubator. The housing consists of black PVC plates that are screwed to the aluminium profile frame. e , Images of the incubator in the anaerobic chamber with the BioStack 4 and Epoch2.
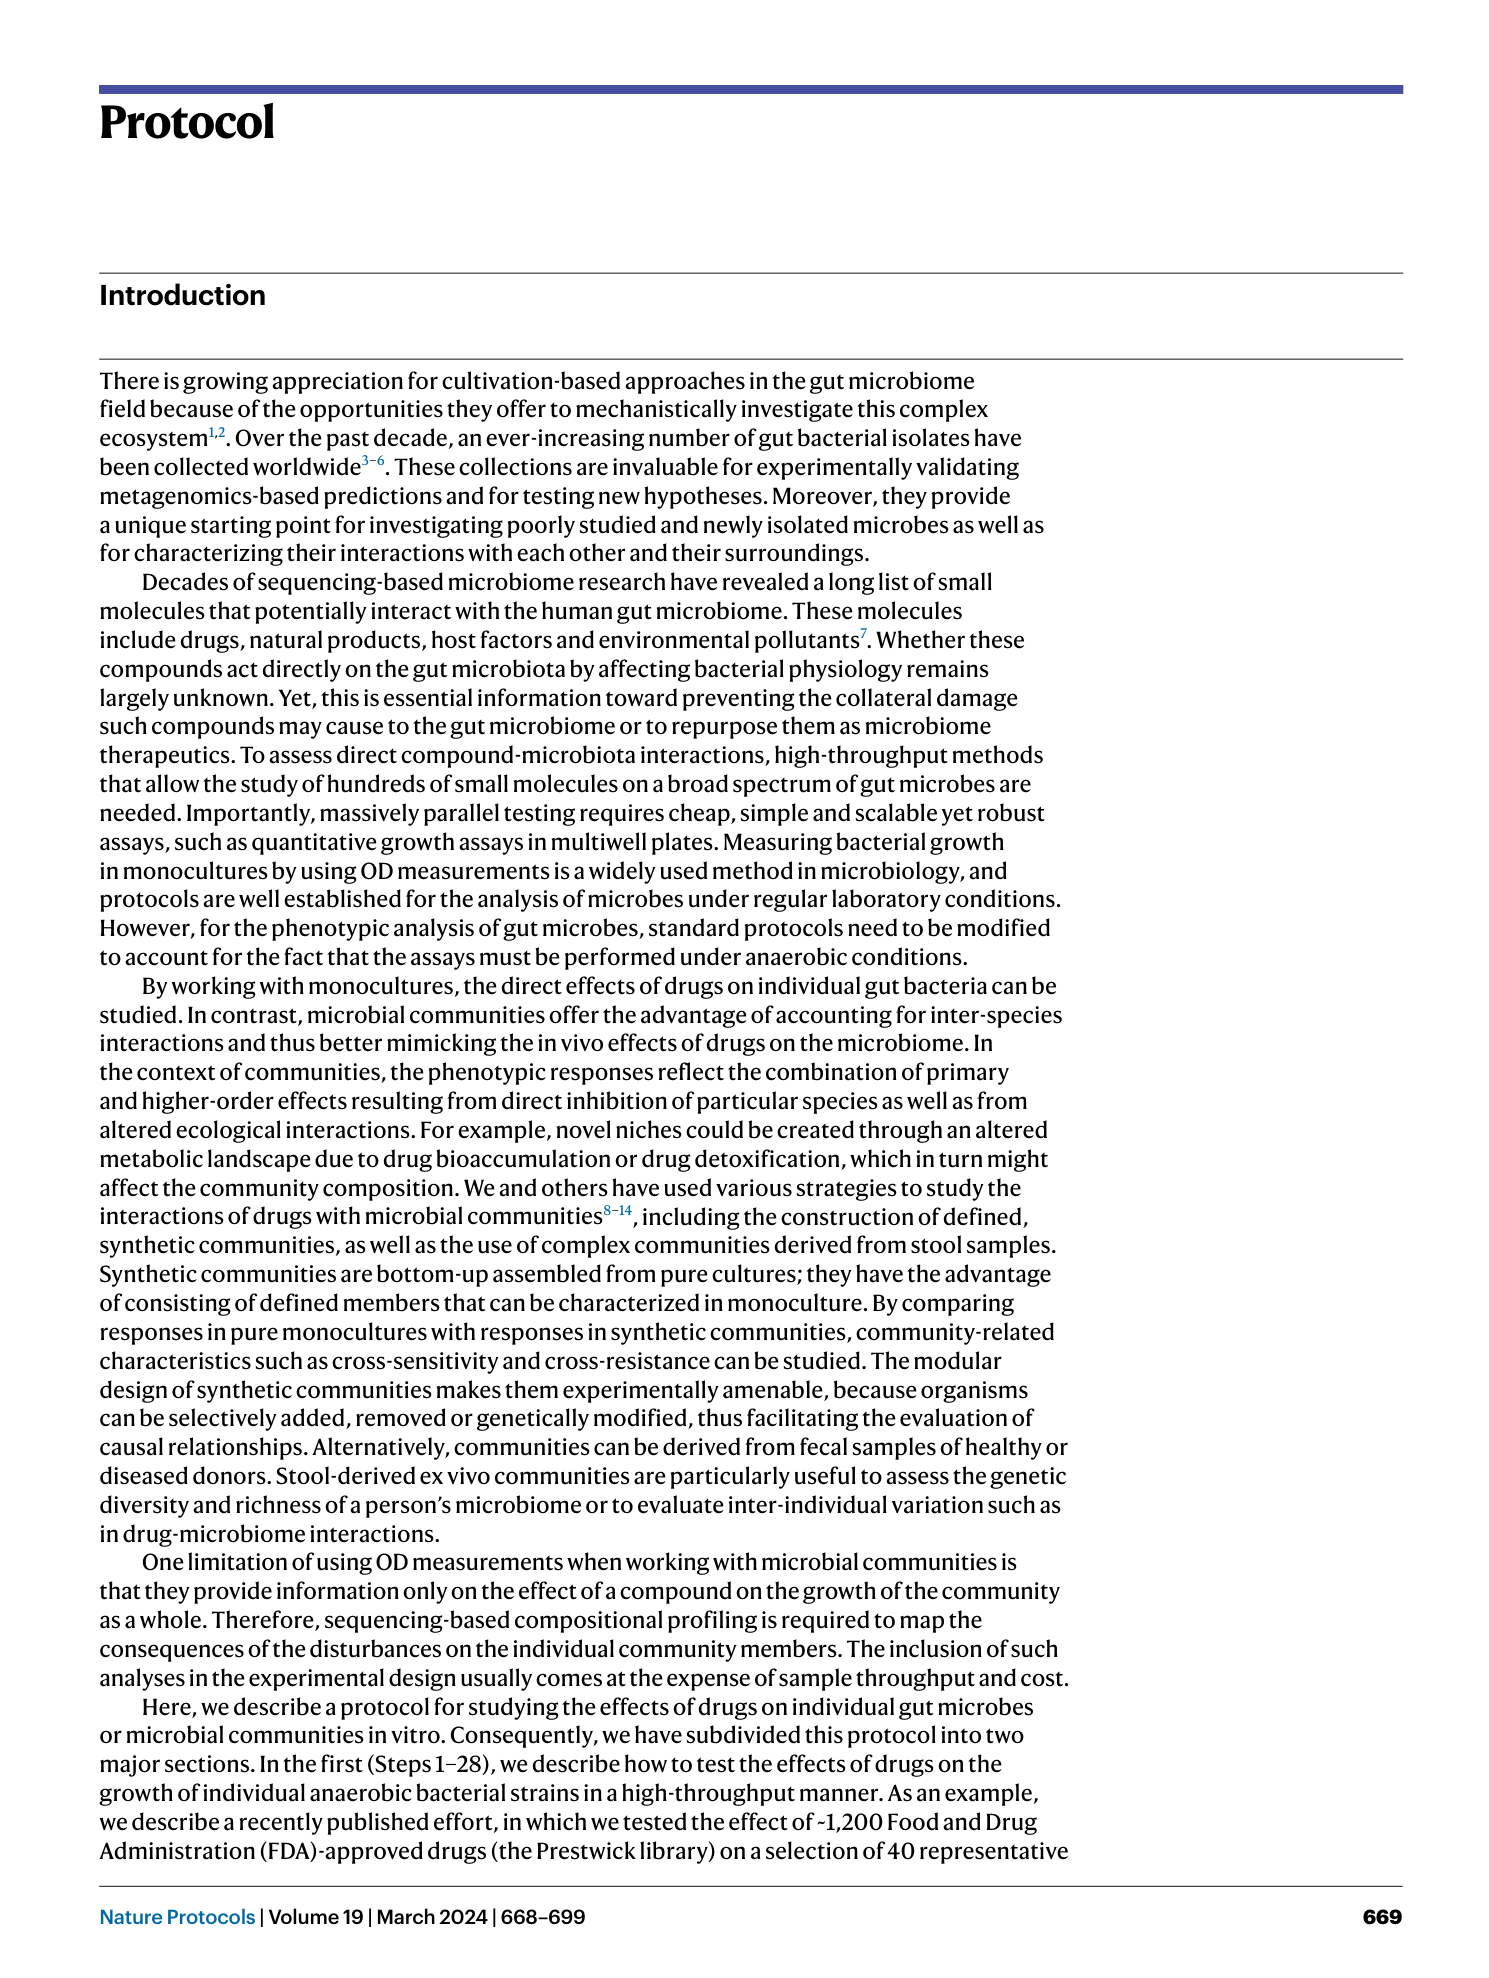
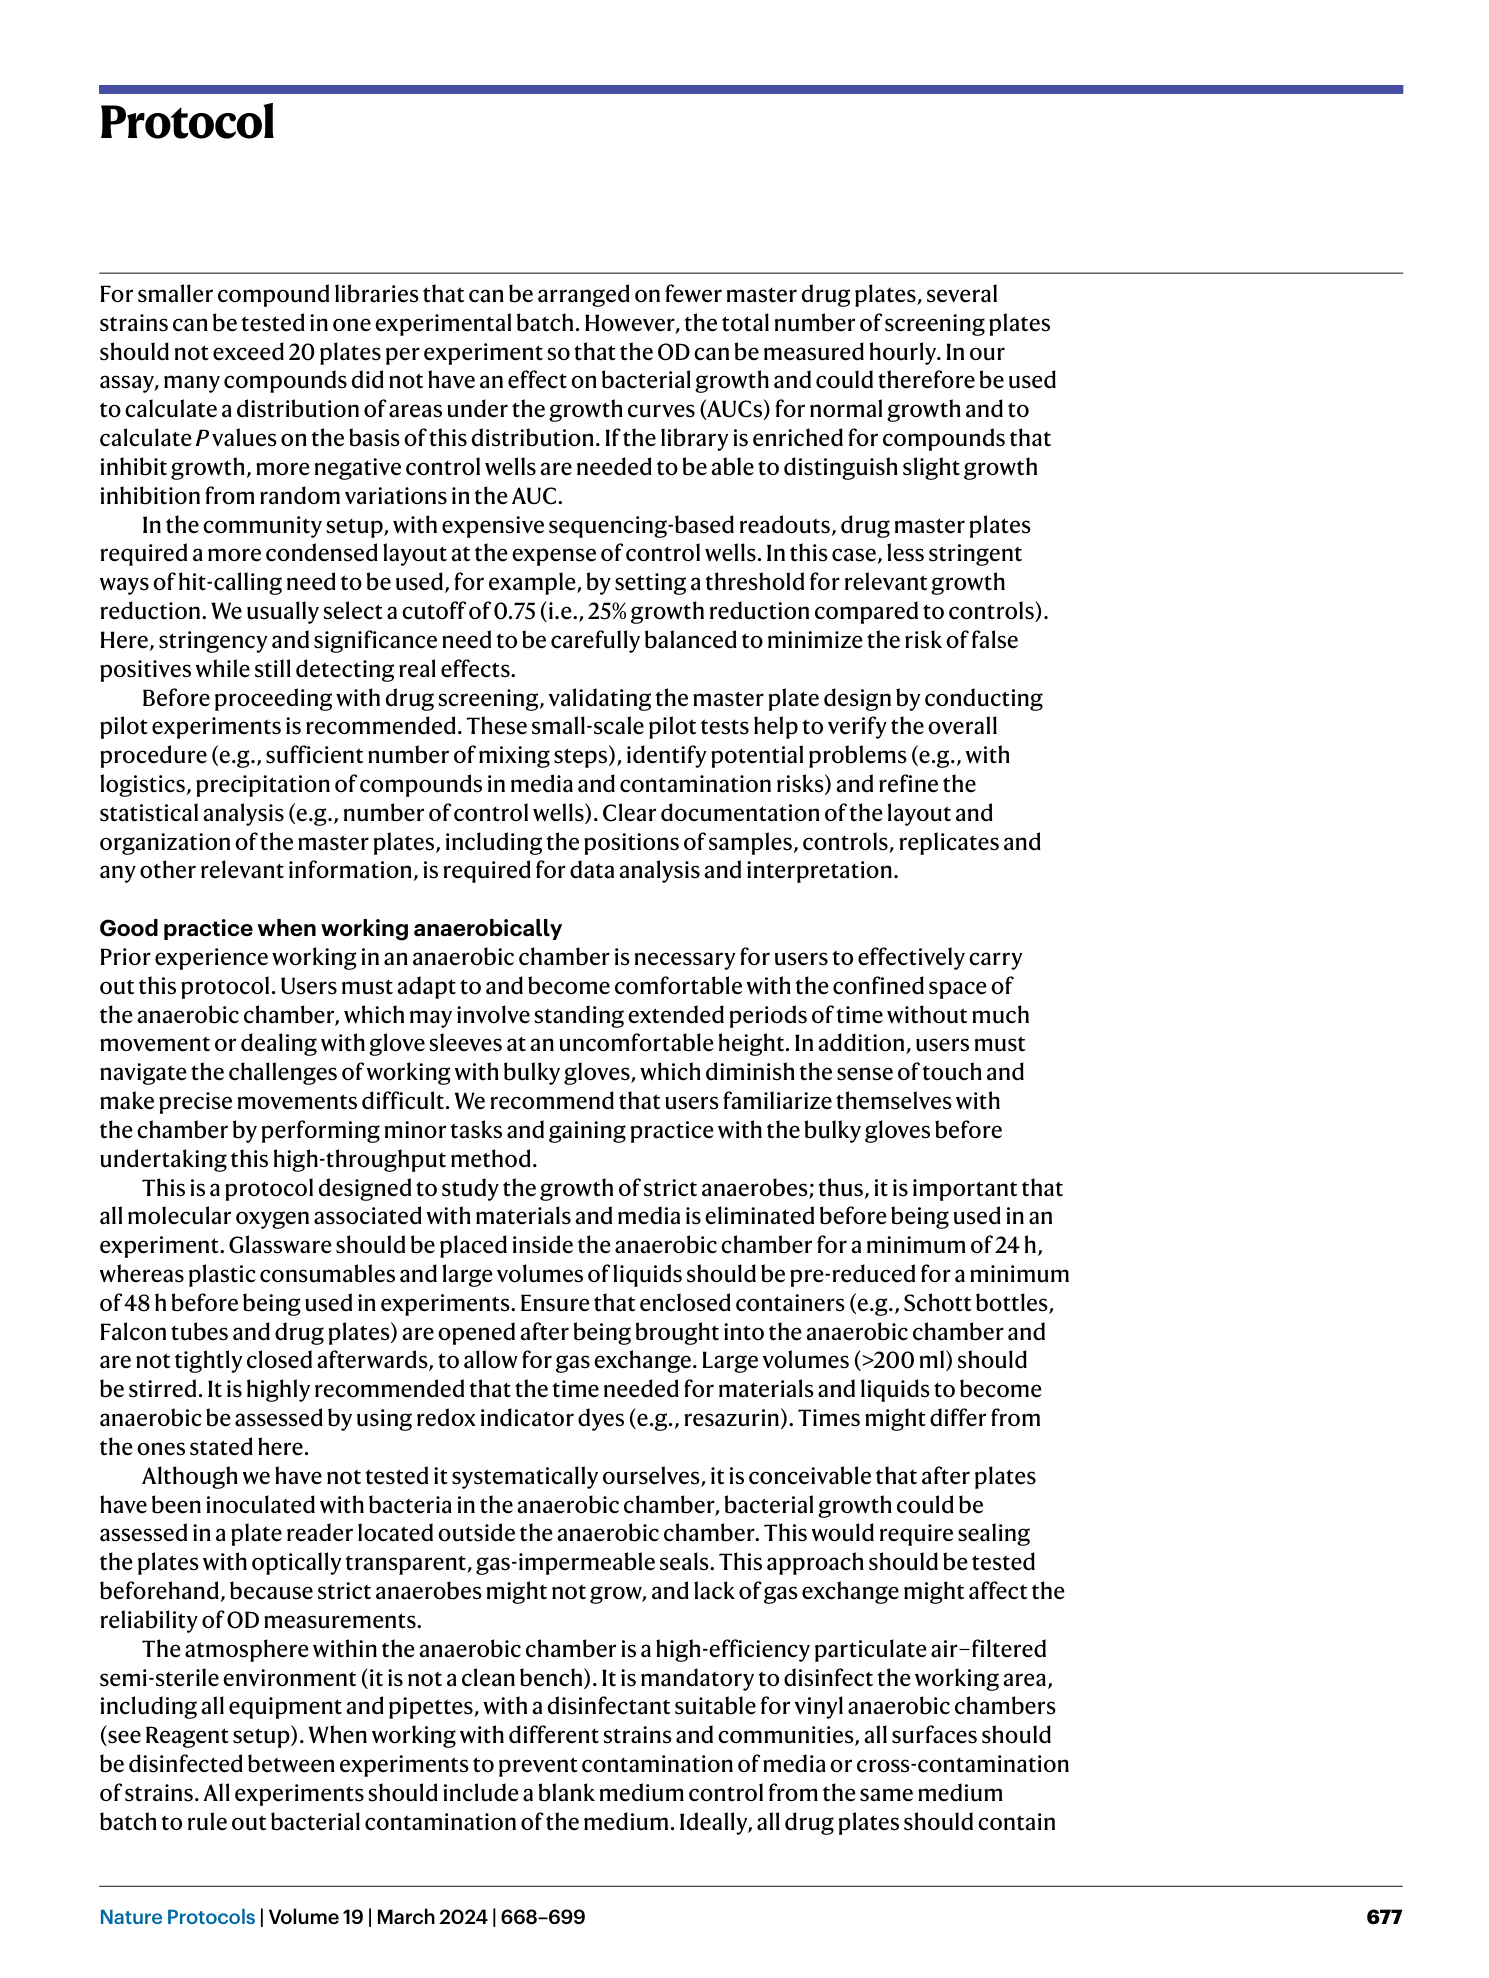
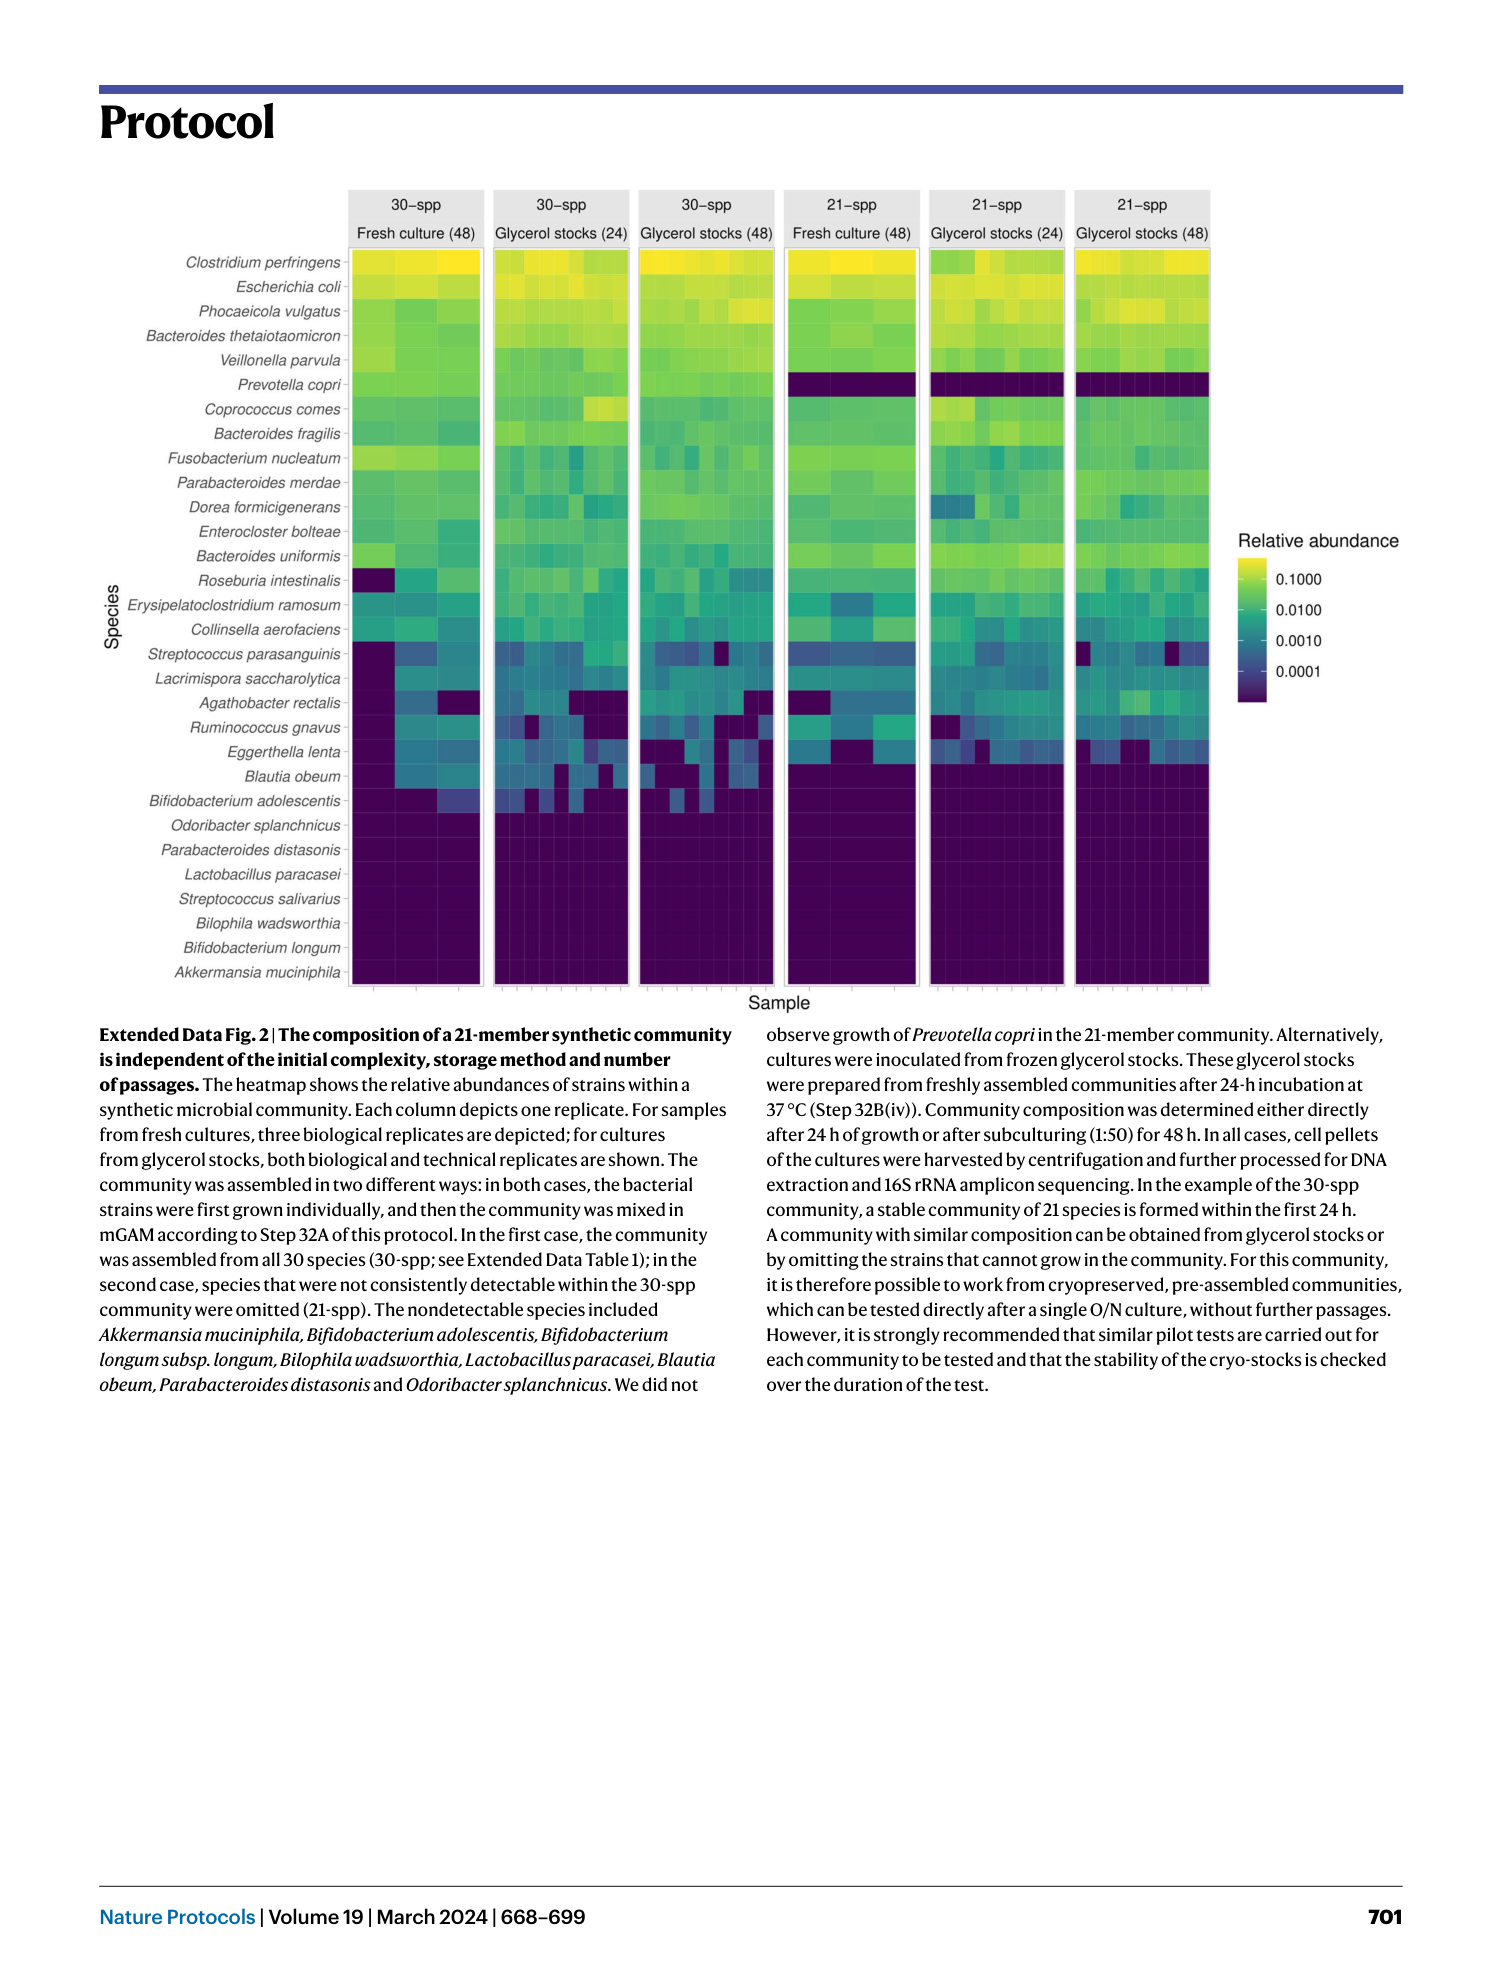
Extended Data Fig. 2 The composition of a 21-member synthetic community is independent of the initial complexity, storage method and number of passages.
The heatmap shows the relative abundances of strains within a synthetic microbial community. Each column depicts one replicate. For samples from fresh cultures, three biological replicates are depicted; for cultures from glycerol stocks, both biological and technical replicates are shown. The community was assembled in two different ways: in both cases, the bacterial strains were first grown individually, and then the community was mixed in mGAM according to Step 32A of this protocol. In the first case, the community was assembled from all 30 species (30-spp; see Extended Data Table 1 ); in the second case, species that were not consistently detectable within the 30-spp community were omitted (21-spp). The nondetectable species included Akkermansia muciniphila, Bifidobacterium adolescentis, Bifidobacterium longum subsp. longum, Bilophila wadsworthia, Lactobacillus paracasei, Blautia obeum, Parabacteroides distasonis and Odoribacter splanchnicus . We did not observe growth of Prevotella copri in the 21-member community. Alternatively, cultures were inoculated from frozen glycerol stocks. These glycerol stocks were prepared from freshly assembled communities after 24-h incubation at 37 °C (Step 32B(iv)). Community composition was determined either directly after 24 h of growth or after subculturing (1:50) for 48 h. In all cases, cell pellets of the cultures were harvested by centrifugation and further processed for DNA extraction and 16S rRNA amplicon sequencing. In the example of the 30-spp community, a stable community of 21 species is formed within the first 24 h. A community with similar composition can be obtained from glycerol stocks or by omitting the strains that cannot grow in the community. For this community, it is therefore possible to work from cryopreserved, pre-assembled communities, which can be tested directly after a single O/N culture, without further passages. However, it is strongly recommended that similar pilot tests are carried out for each community to be tested and that the stability of the cryo-stocks is checked over the duration of the test.
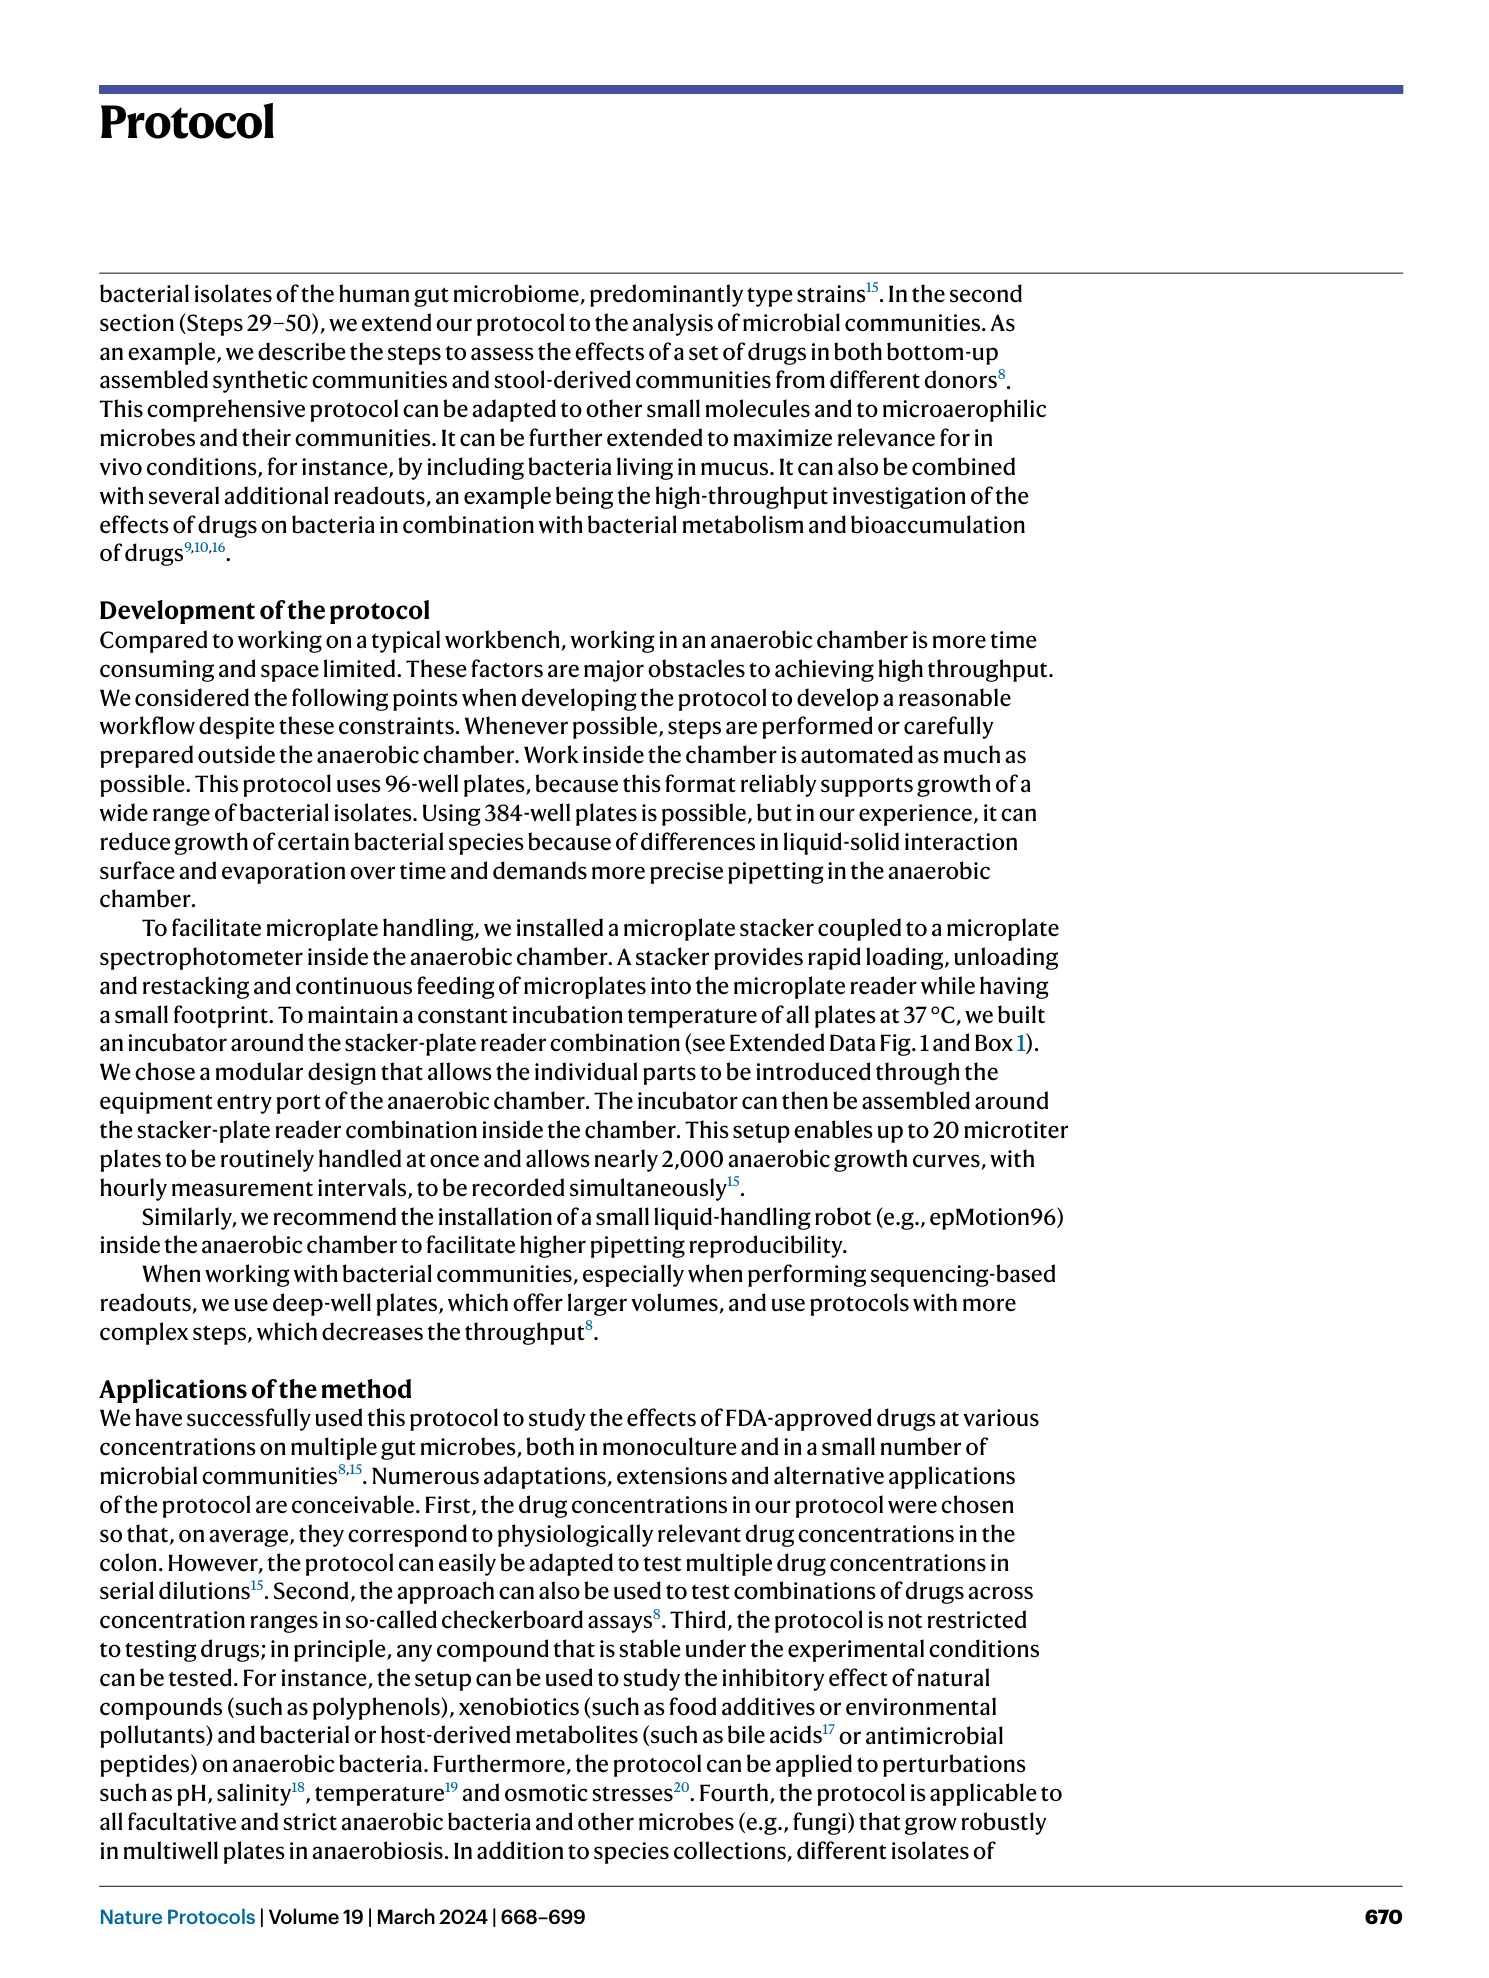
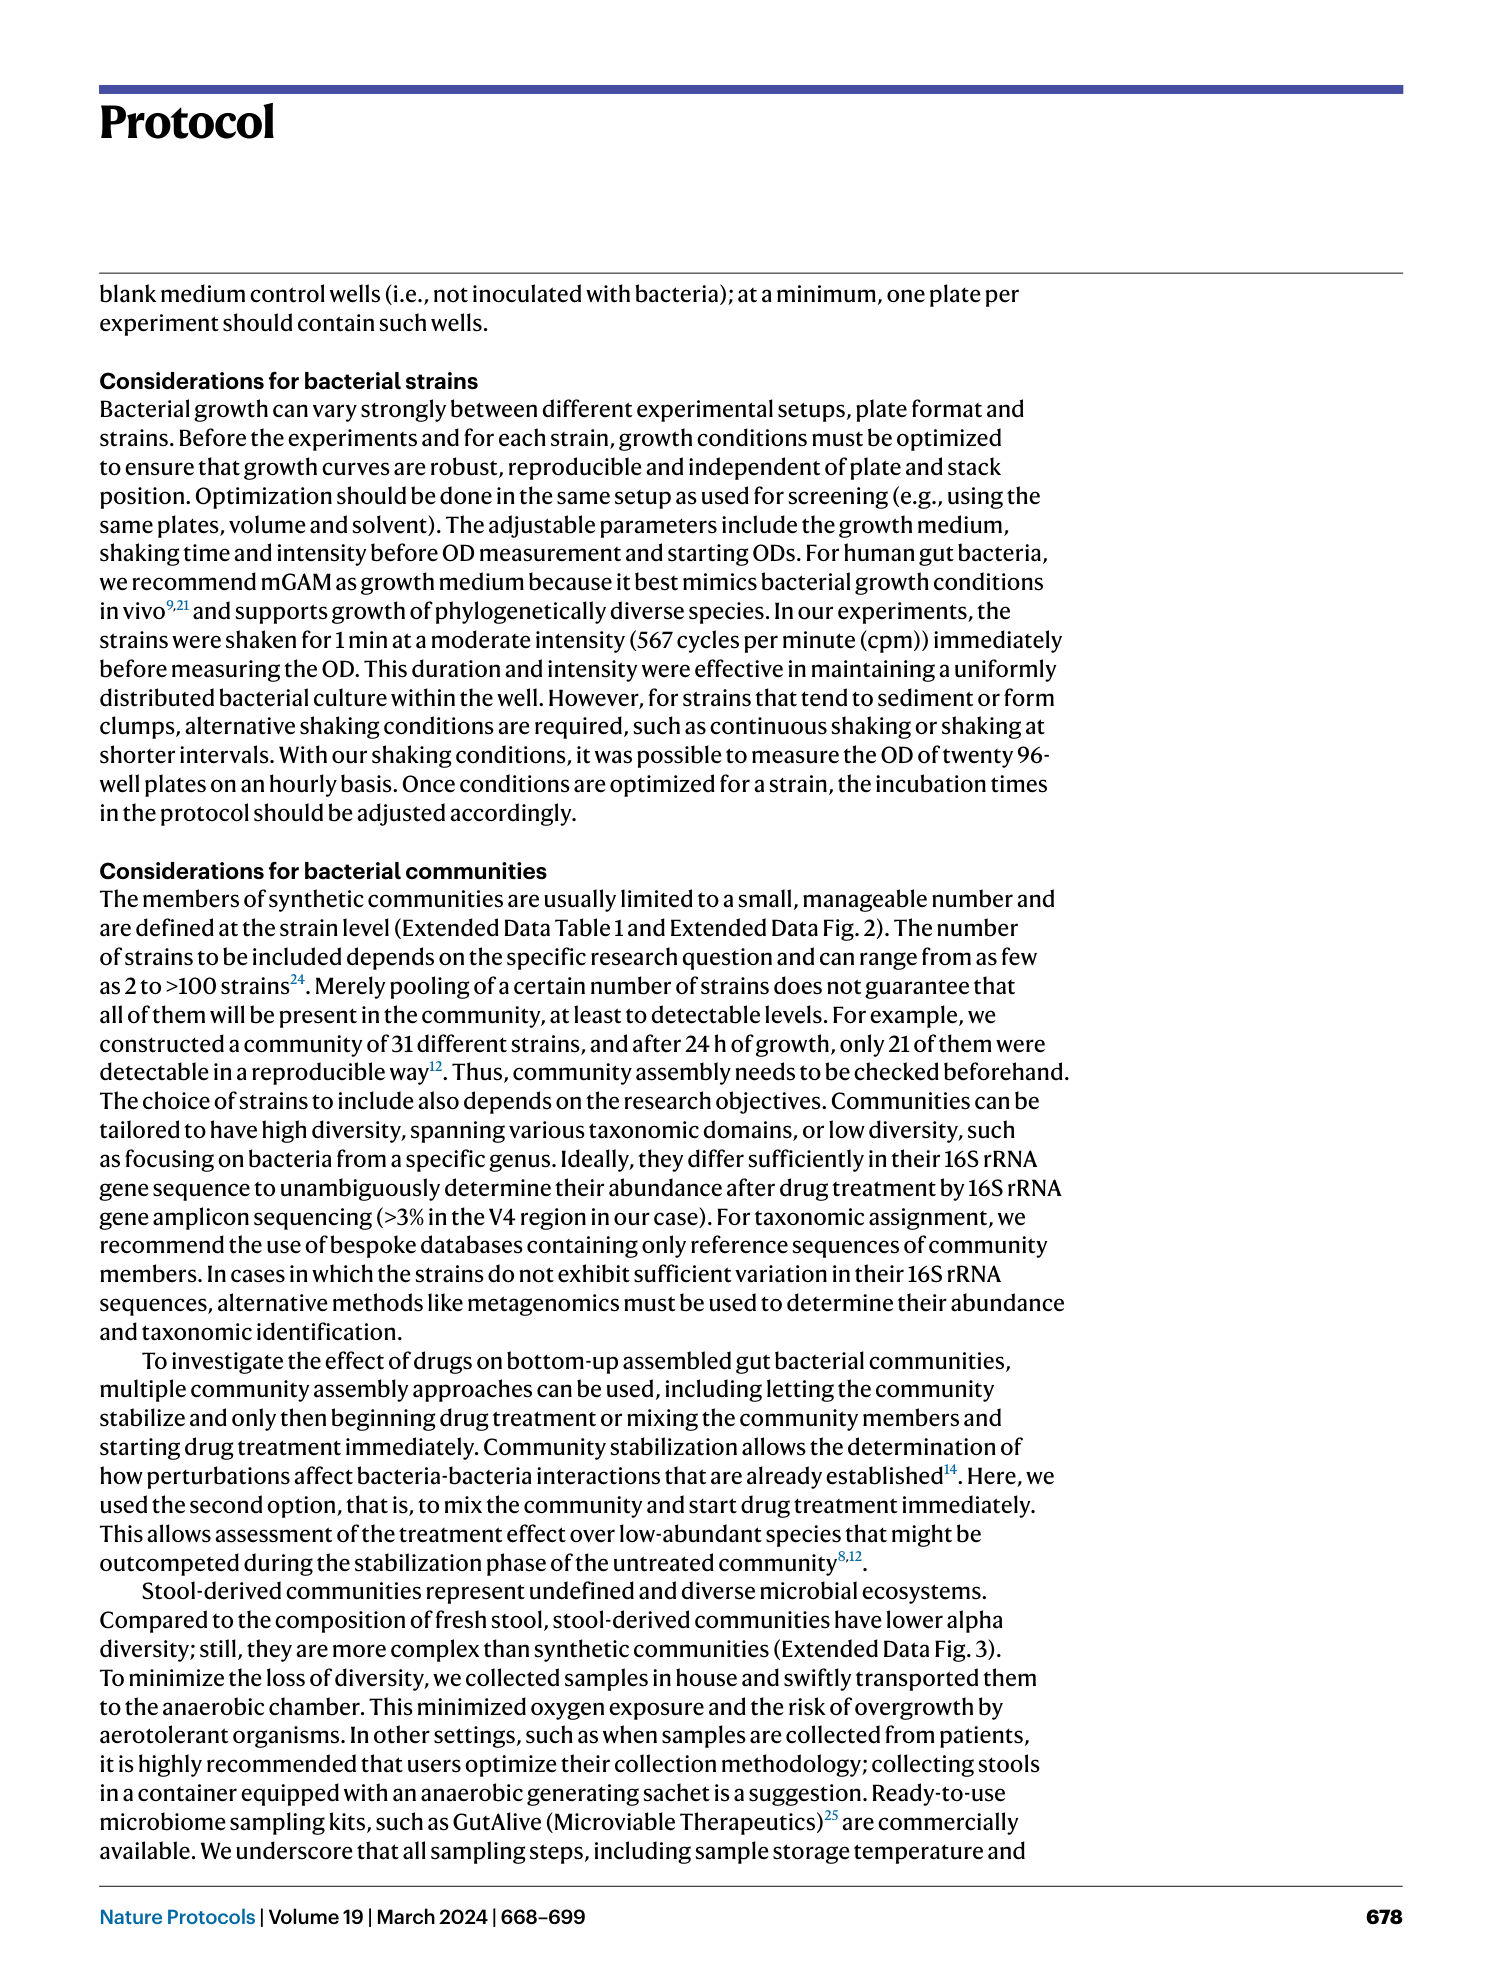
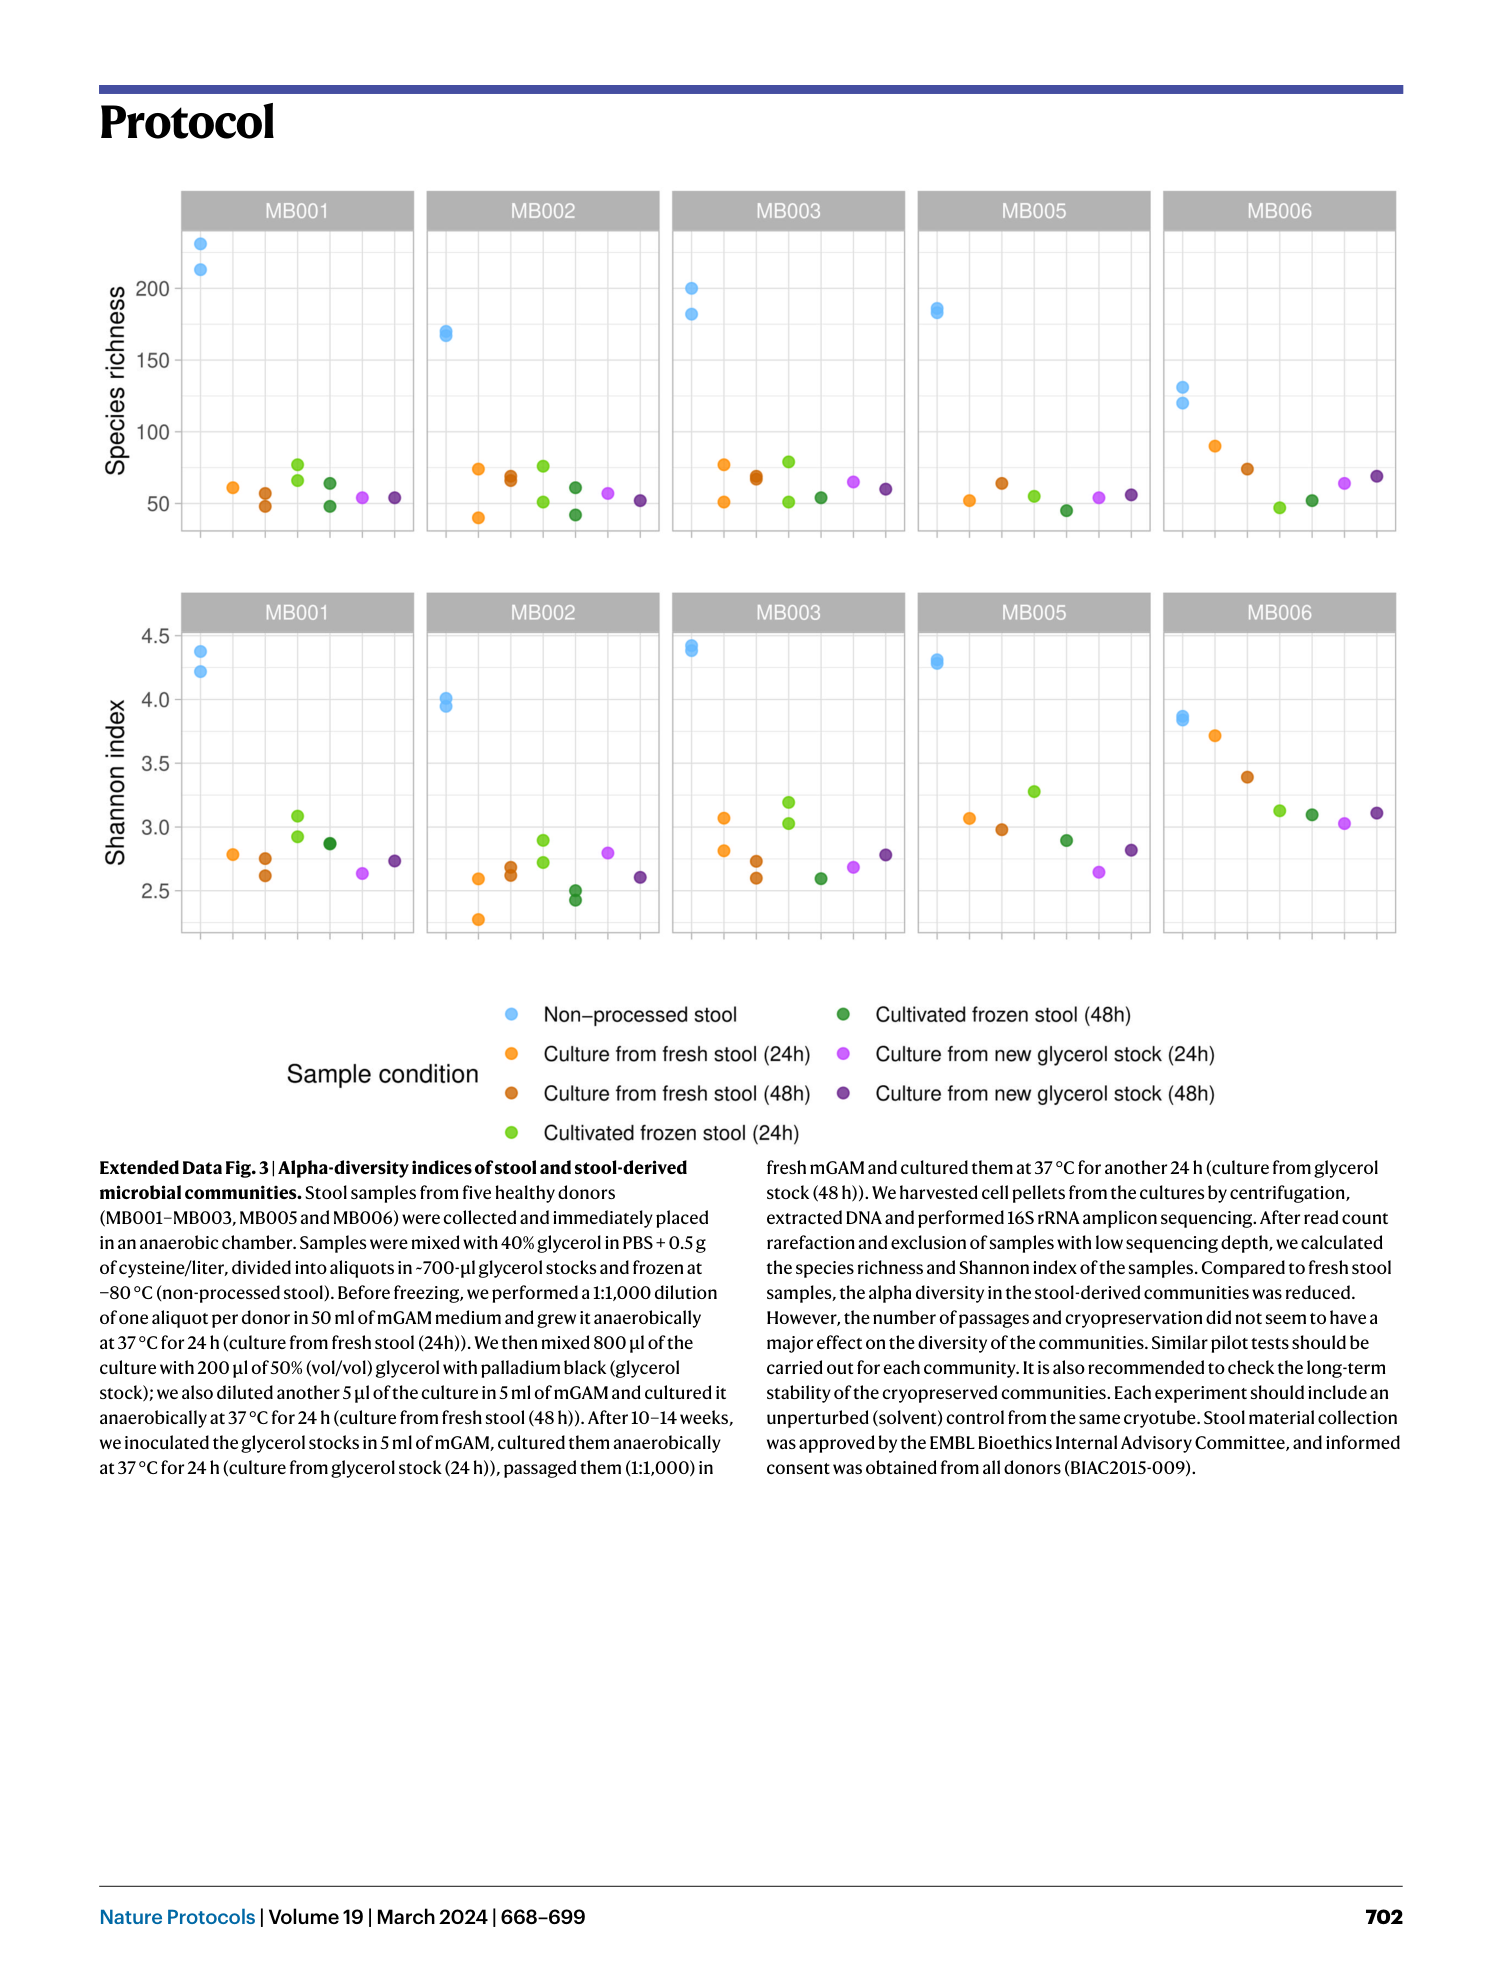
Extended Data Fig. 3 Alpha-diversity indices of stool and stool-derived microbial communities.
Stool samples from five healthy donors (MB001–MB003, MB005 and MB006) were collected and immediately placed in an anaerobic chamber. Samples were mixed with 40% glycerol in PBS + 0.5 g of cysteine/liter, divided into aliquots in ~700-µl glycerol stocks and frozen at −80 °C (non-processed stool). Before freezing, we performed a 1:1,000 dilution of one aliquot per donor in 50 ml of mGAM medium and grew it anaerobically at 37 °C for 24 h (culture from fresh stool (24h)). We then mixed 800 µl of the culture with 200 µl of 50% (vol/vol) glycerol with palladium black (glycerol stock); we also diluted another 5 µl of the culture in 5 ml of mGAM and cultured it anaerobically at 37 °C for 24 h (culture from fresh stool (48 h)). After 10–14 weeks, we inoculated the glycerol stocks in 5 ml of mGAM, cultured them anaerobically at 37 °C for 24 h (culture from glycerol stock (24 h)), passaged them (1:1,000) in fresh mGAM and cultured them at 37 °C for another 24 h (culture from glycerol stock (48 h)). We harvested cell pellets from the cultures by centrifugation, extracted DNA and performed 16S rRNA amplicon sequencing. After read count rarefaction and exclusion of samples with low sequencing depth, we calculated the species richness and Shannon index of the samples. Compared to fresh stool samples, the alpha diversity in the stool-derived communities was reduced. However, the number of passages and cryopreservation did not seem to have a major effect on the diversity of the communities. Similar pilot tests should be carried out for each community. It is also recommended to check the long-term stability of the cryopreserved communities. Each experiment should include an unperturbed (solvent) control from the same cryotube. Stool material collection was approved by the EMBL Bioethics Internal Advisory Committee, and informed consent was obtained from all donors (BIAC2015-009).
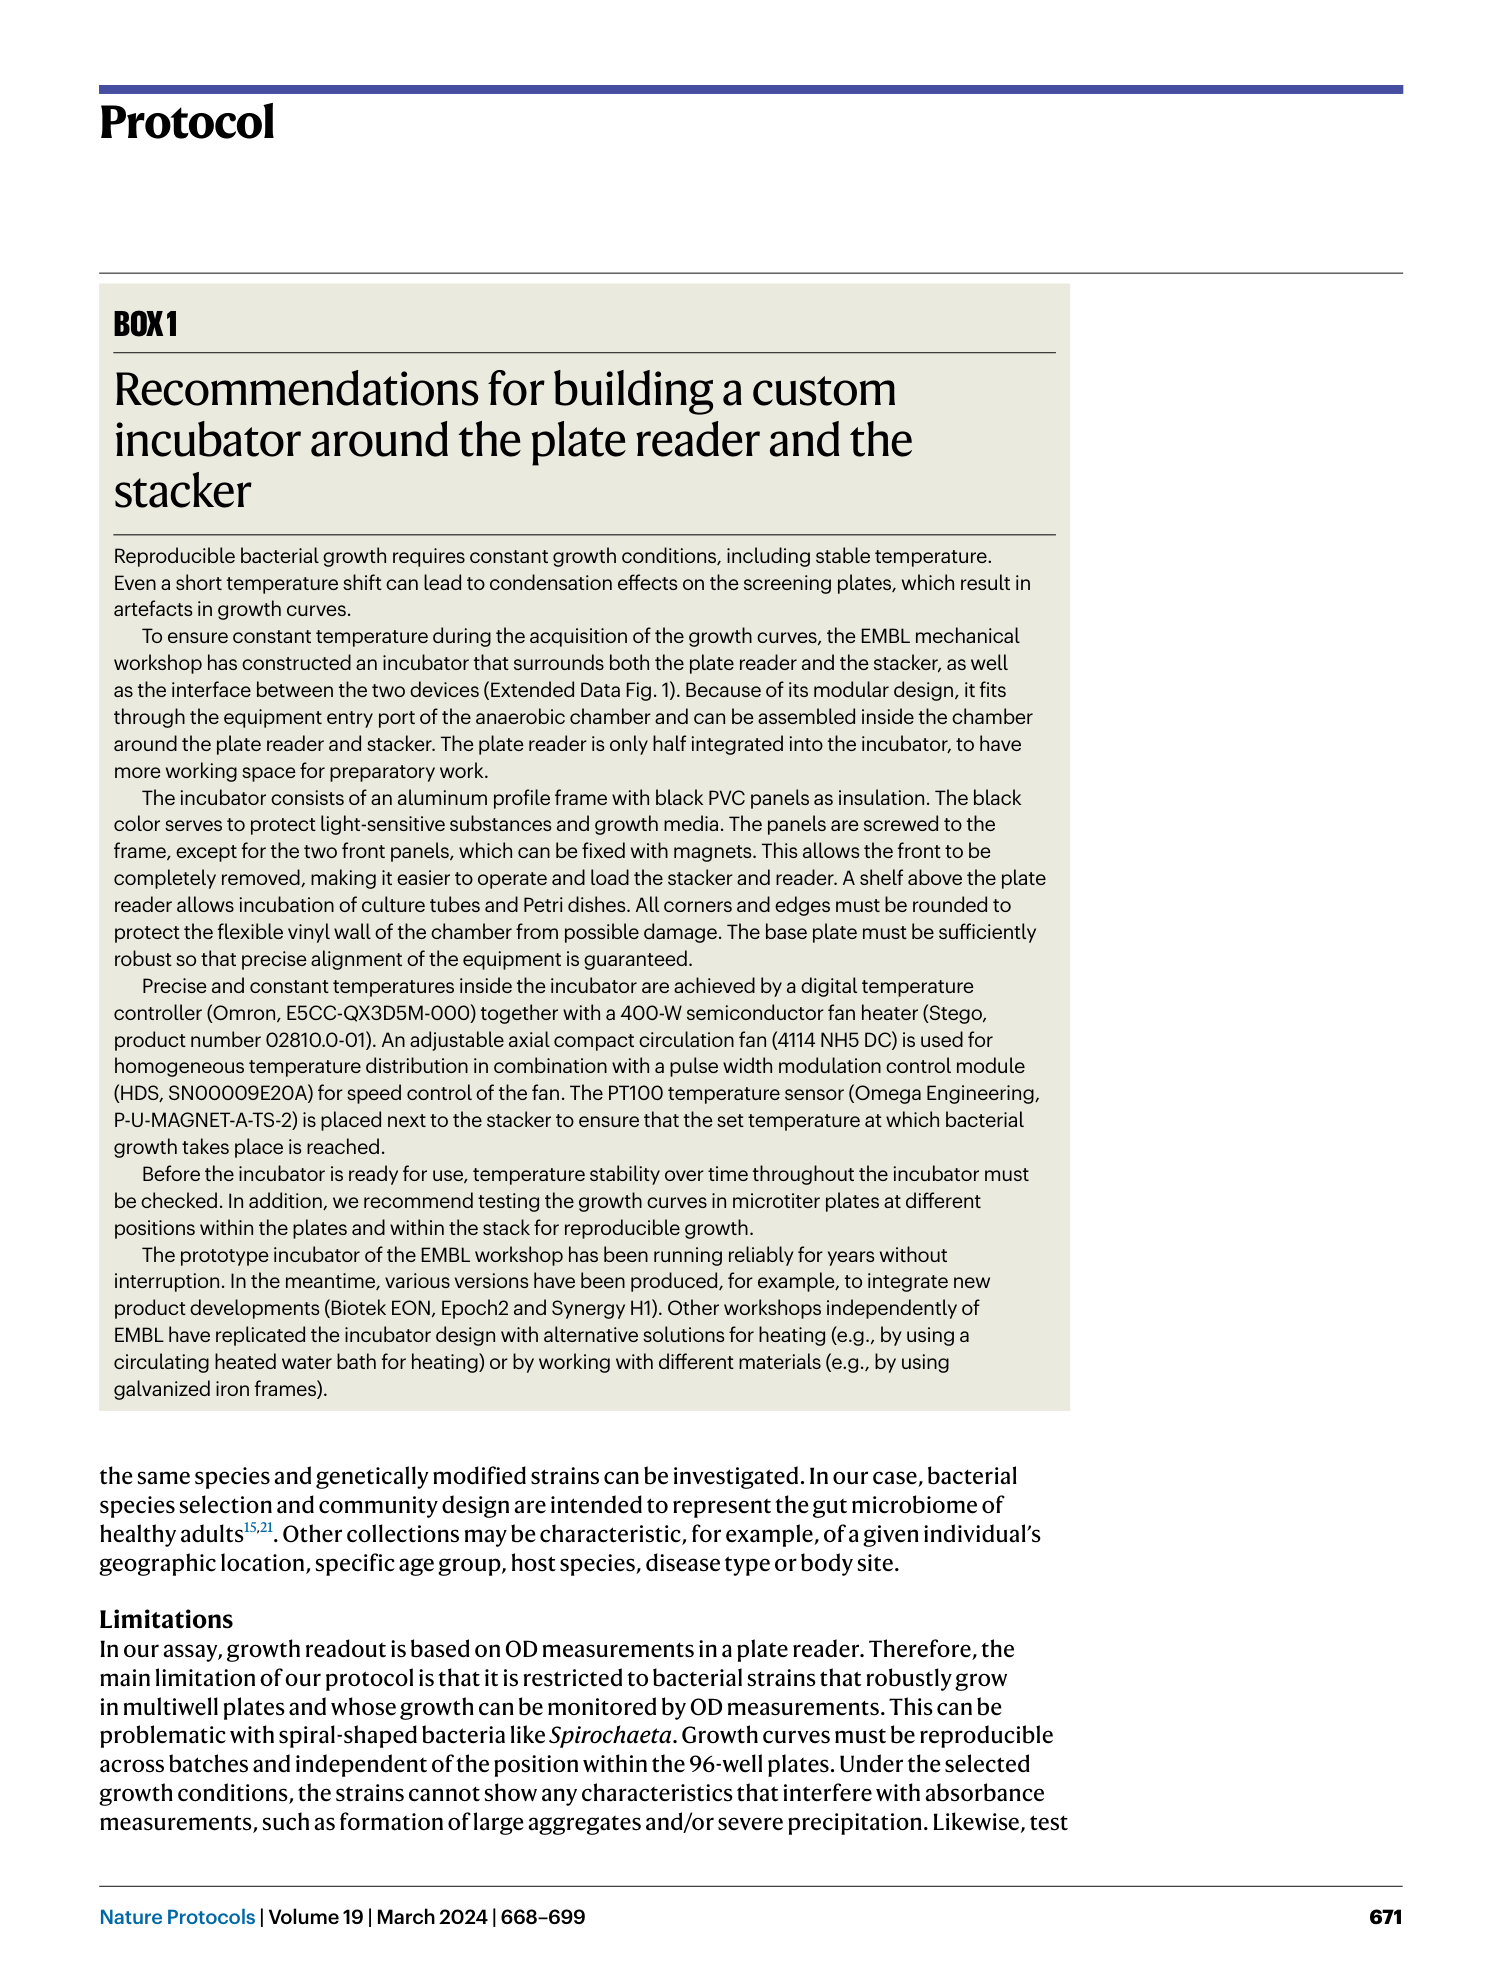
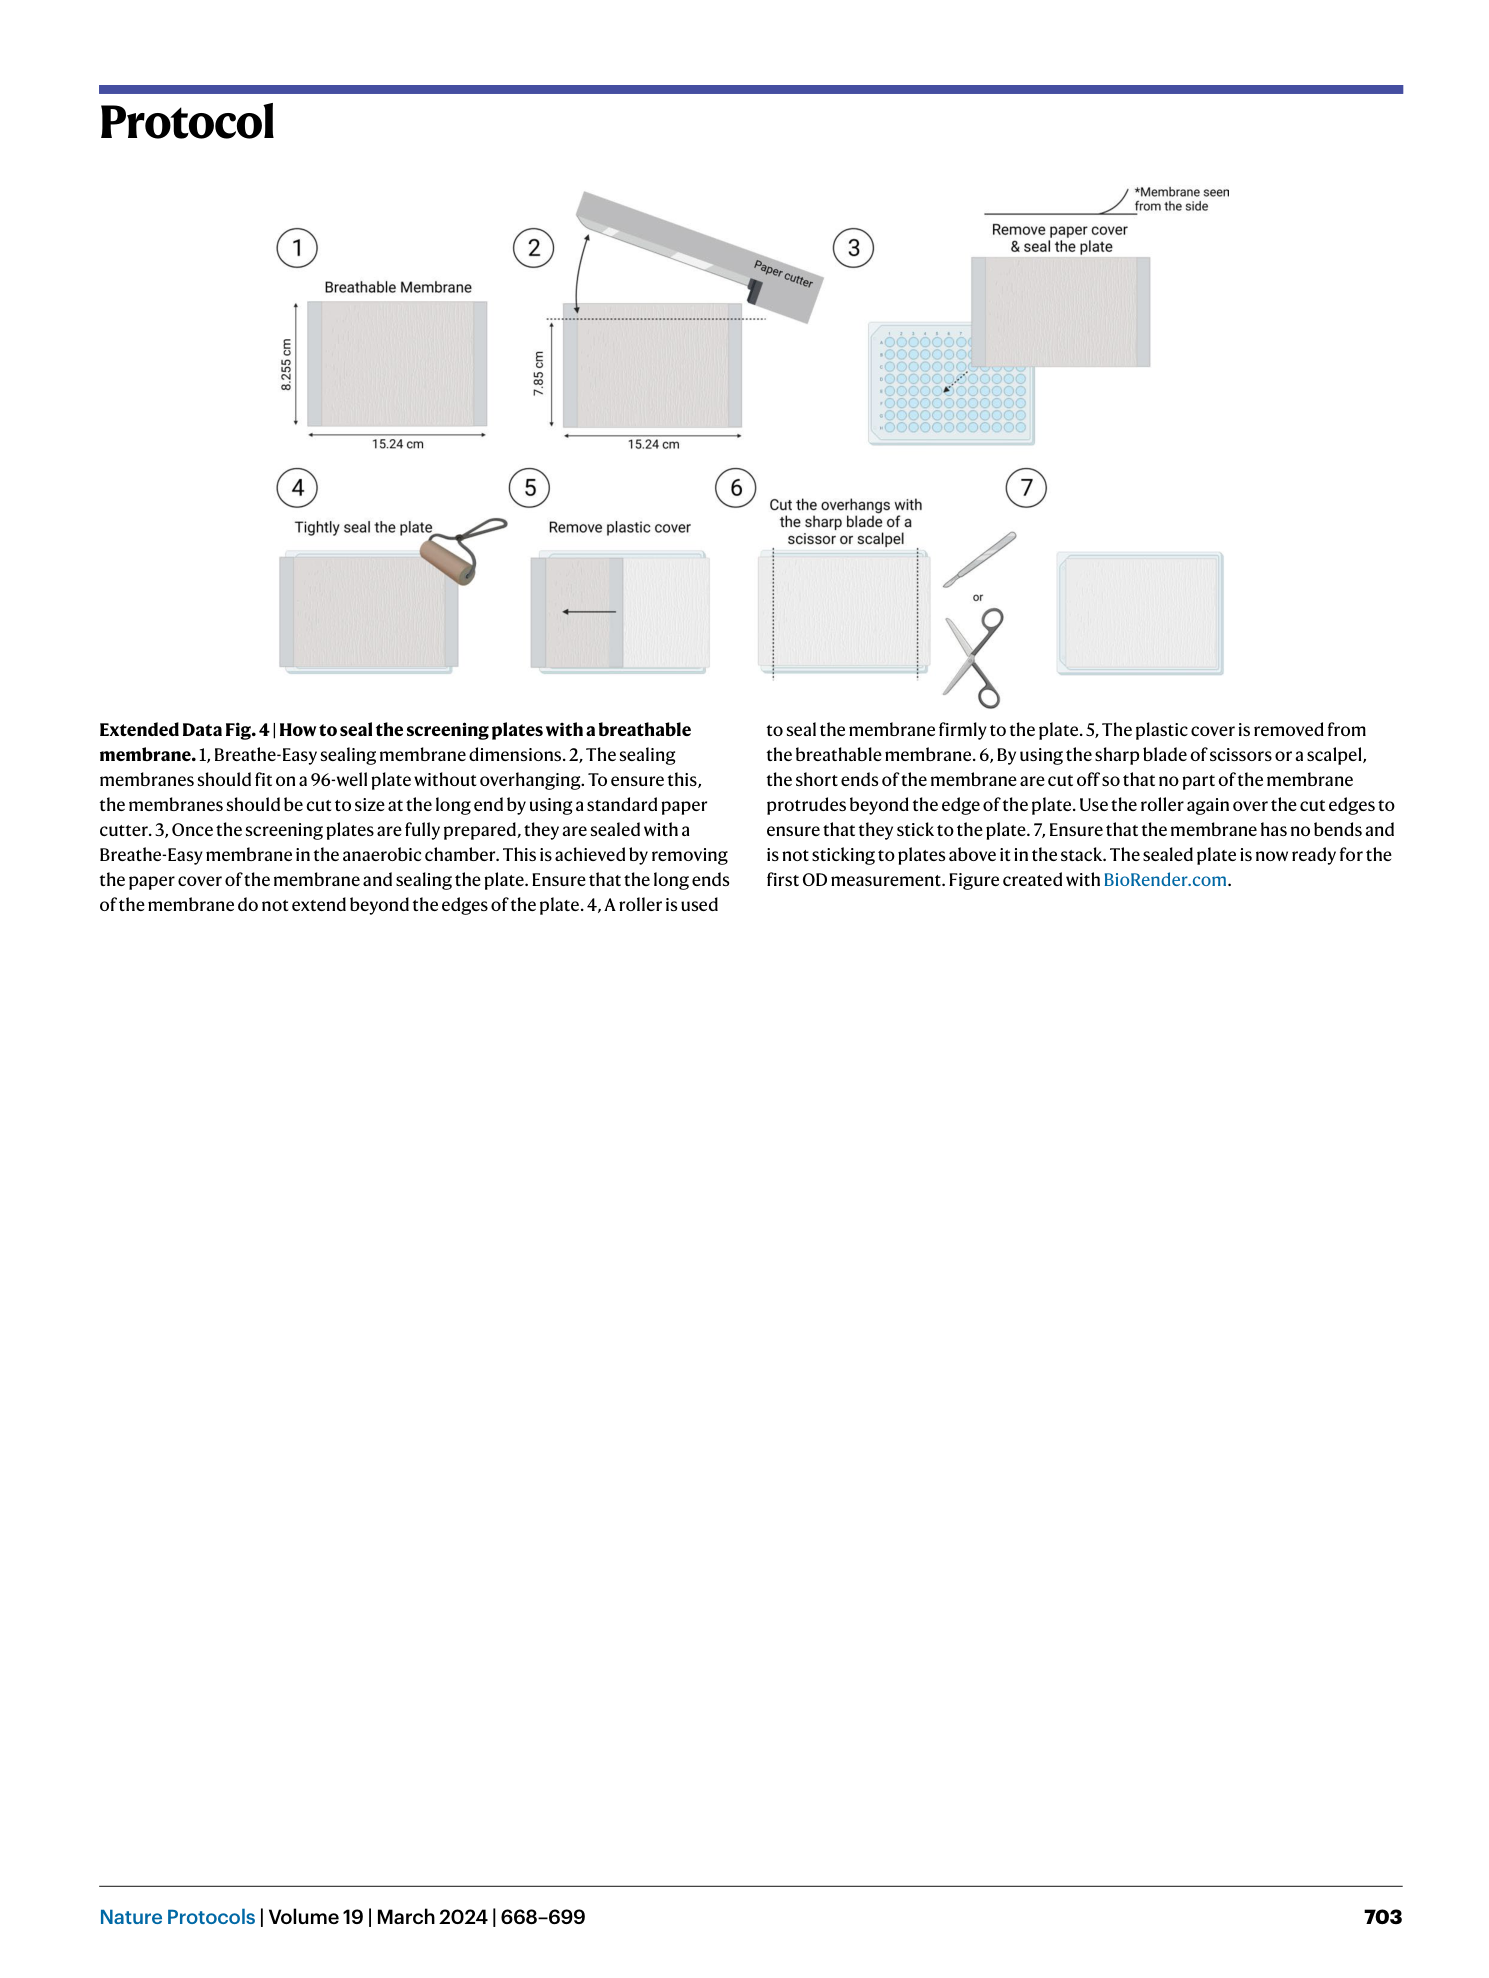
Extended Data Fig. 4 How to seal the screening plates with a breathable membrane.
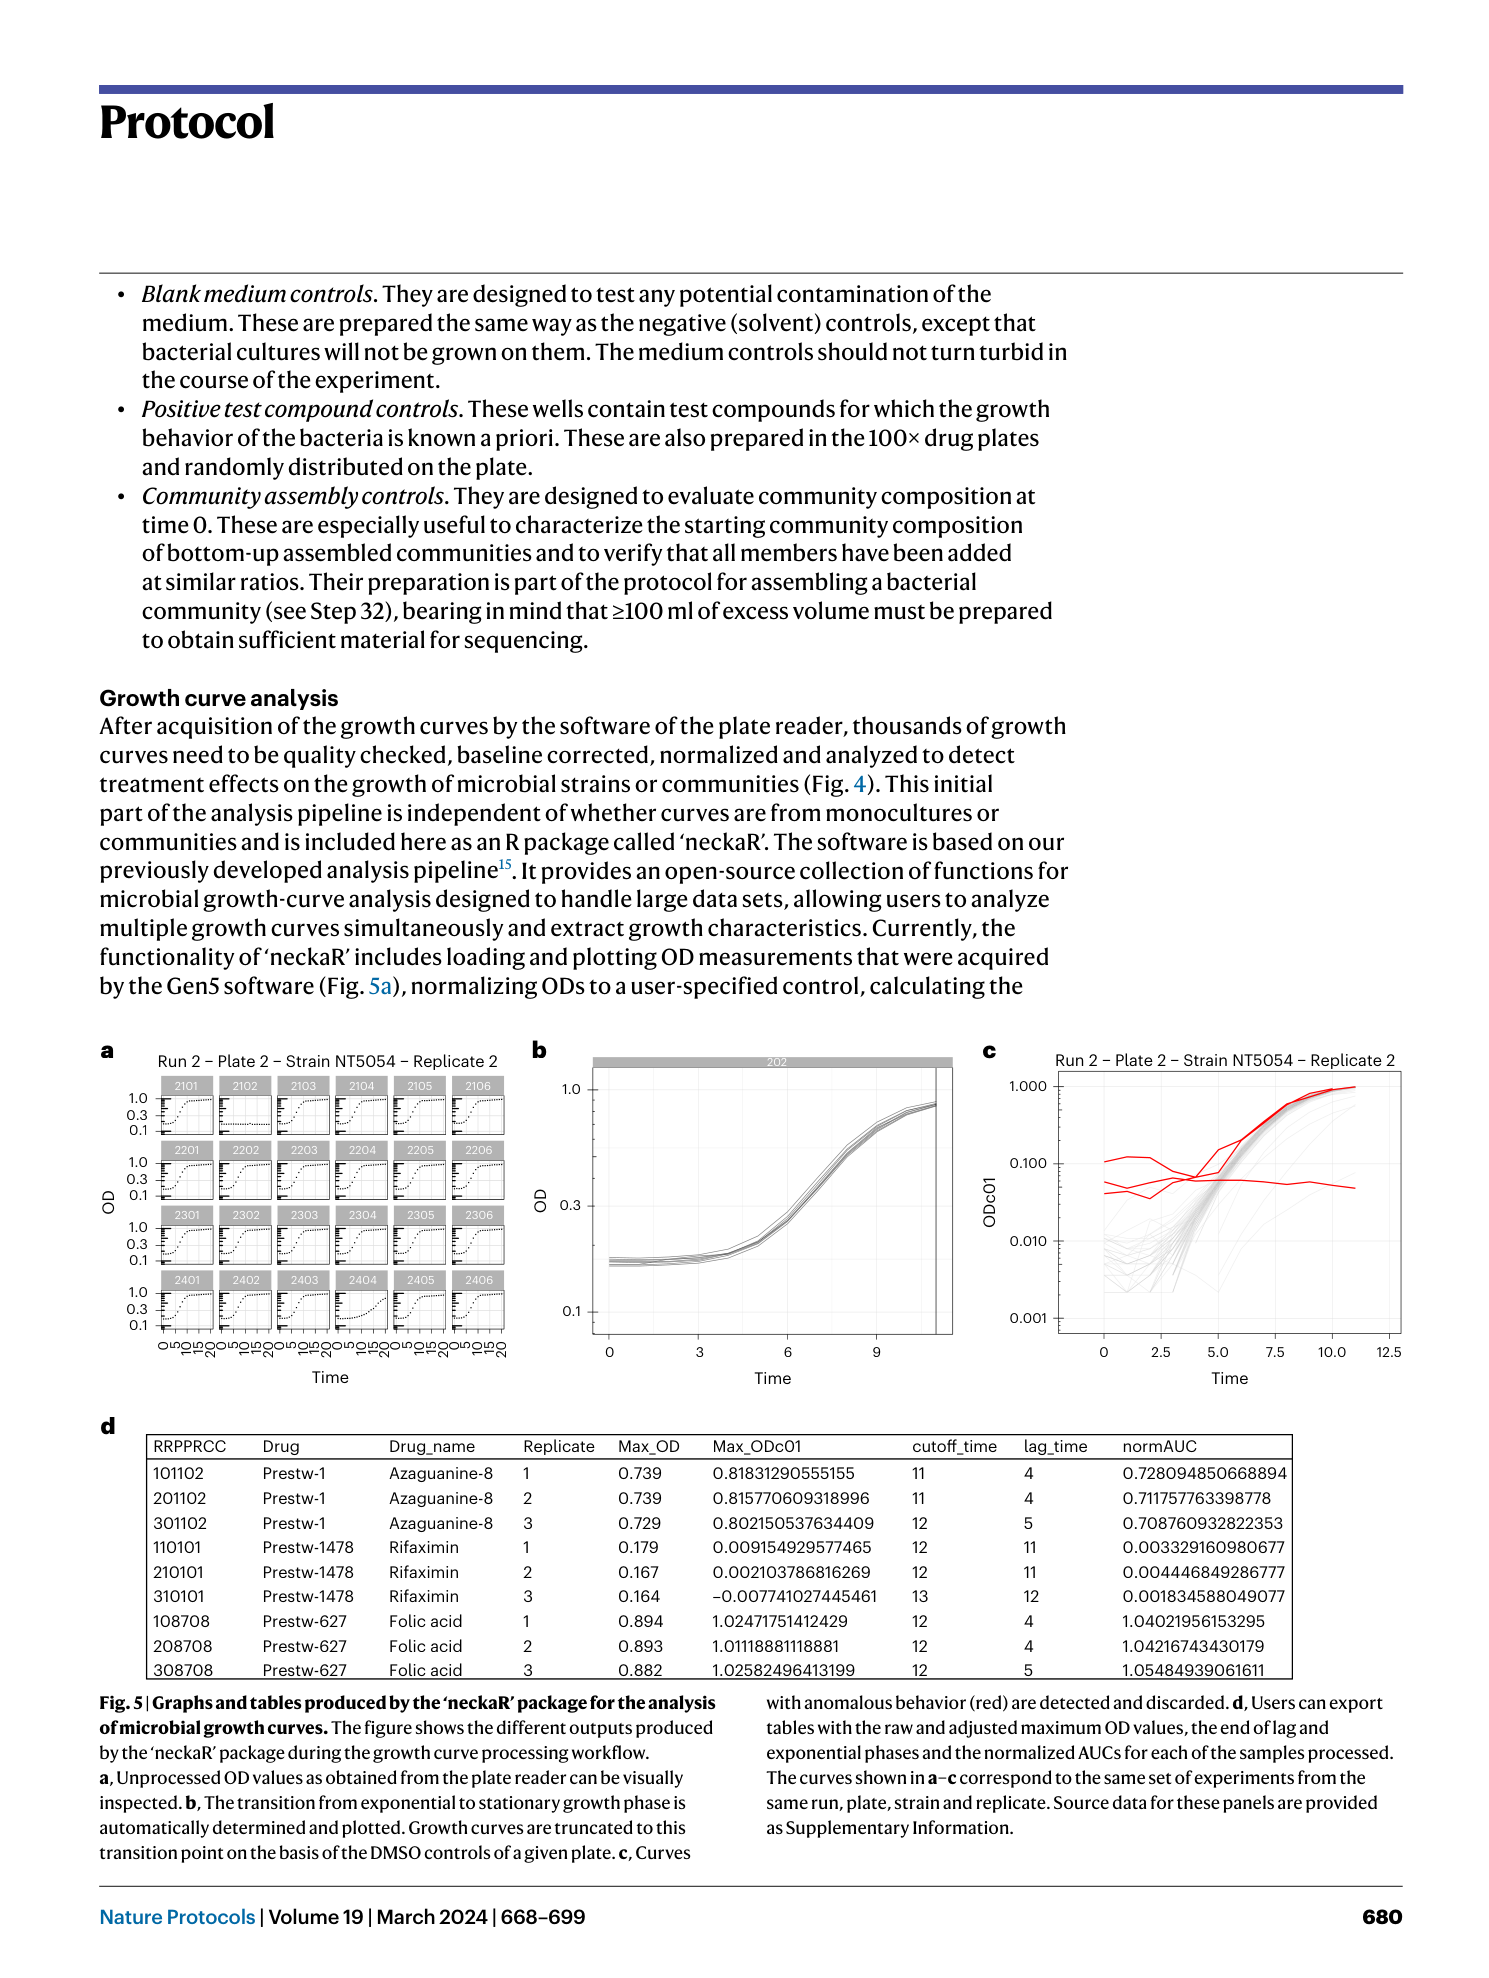
1, Breathe-Easy sealing membrane dimensions. 2, The sealing membranes should fit on a 96-well plate without overhanging. To ensure this, the membranes should be cut to size at the long end by using a standard paper cutter. 3, Once the screening plates are fully prepared, they are sealed with a Breathe-Easy membrane in the anaerobic chamber. This is achieved by removing the paper cover of the membrane and sealing the plate. Ensure that the long ends of the membrane do not extend beyond the edges of the plate. 4, A roller is used to seal the membrane firmly to the plate. 5, The plastic cover is removed from the breathable membrane. 6, By using the sharp blade of scissors or a scalpel, the short ends of the membrane are cut off so that no part of the membrane protrudes beyond the edge of the plate. Use the roller again over the cut edges to ensure that they stick to the plate. 7, Ensure that the membrane has no bends and is not sticking to plates above it in the stack. The sealed plate is now ready for the first OD measurement. Figure created with BioRender.com .
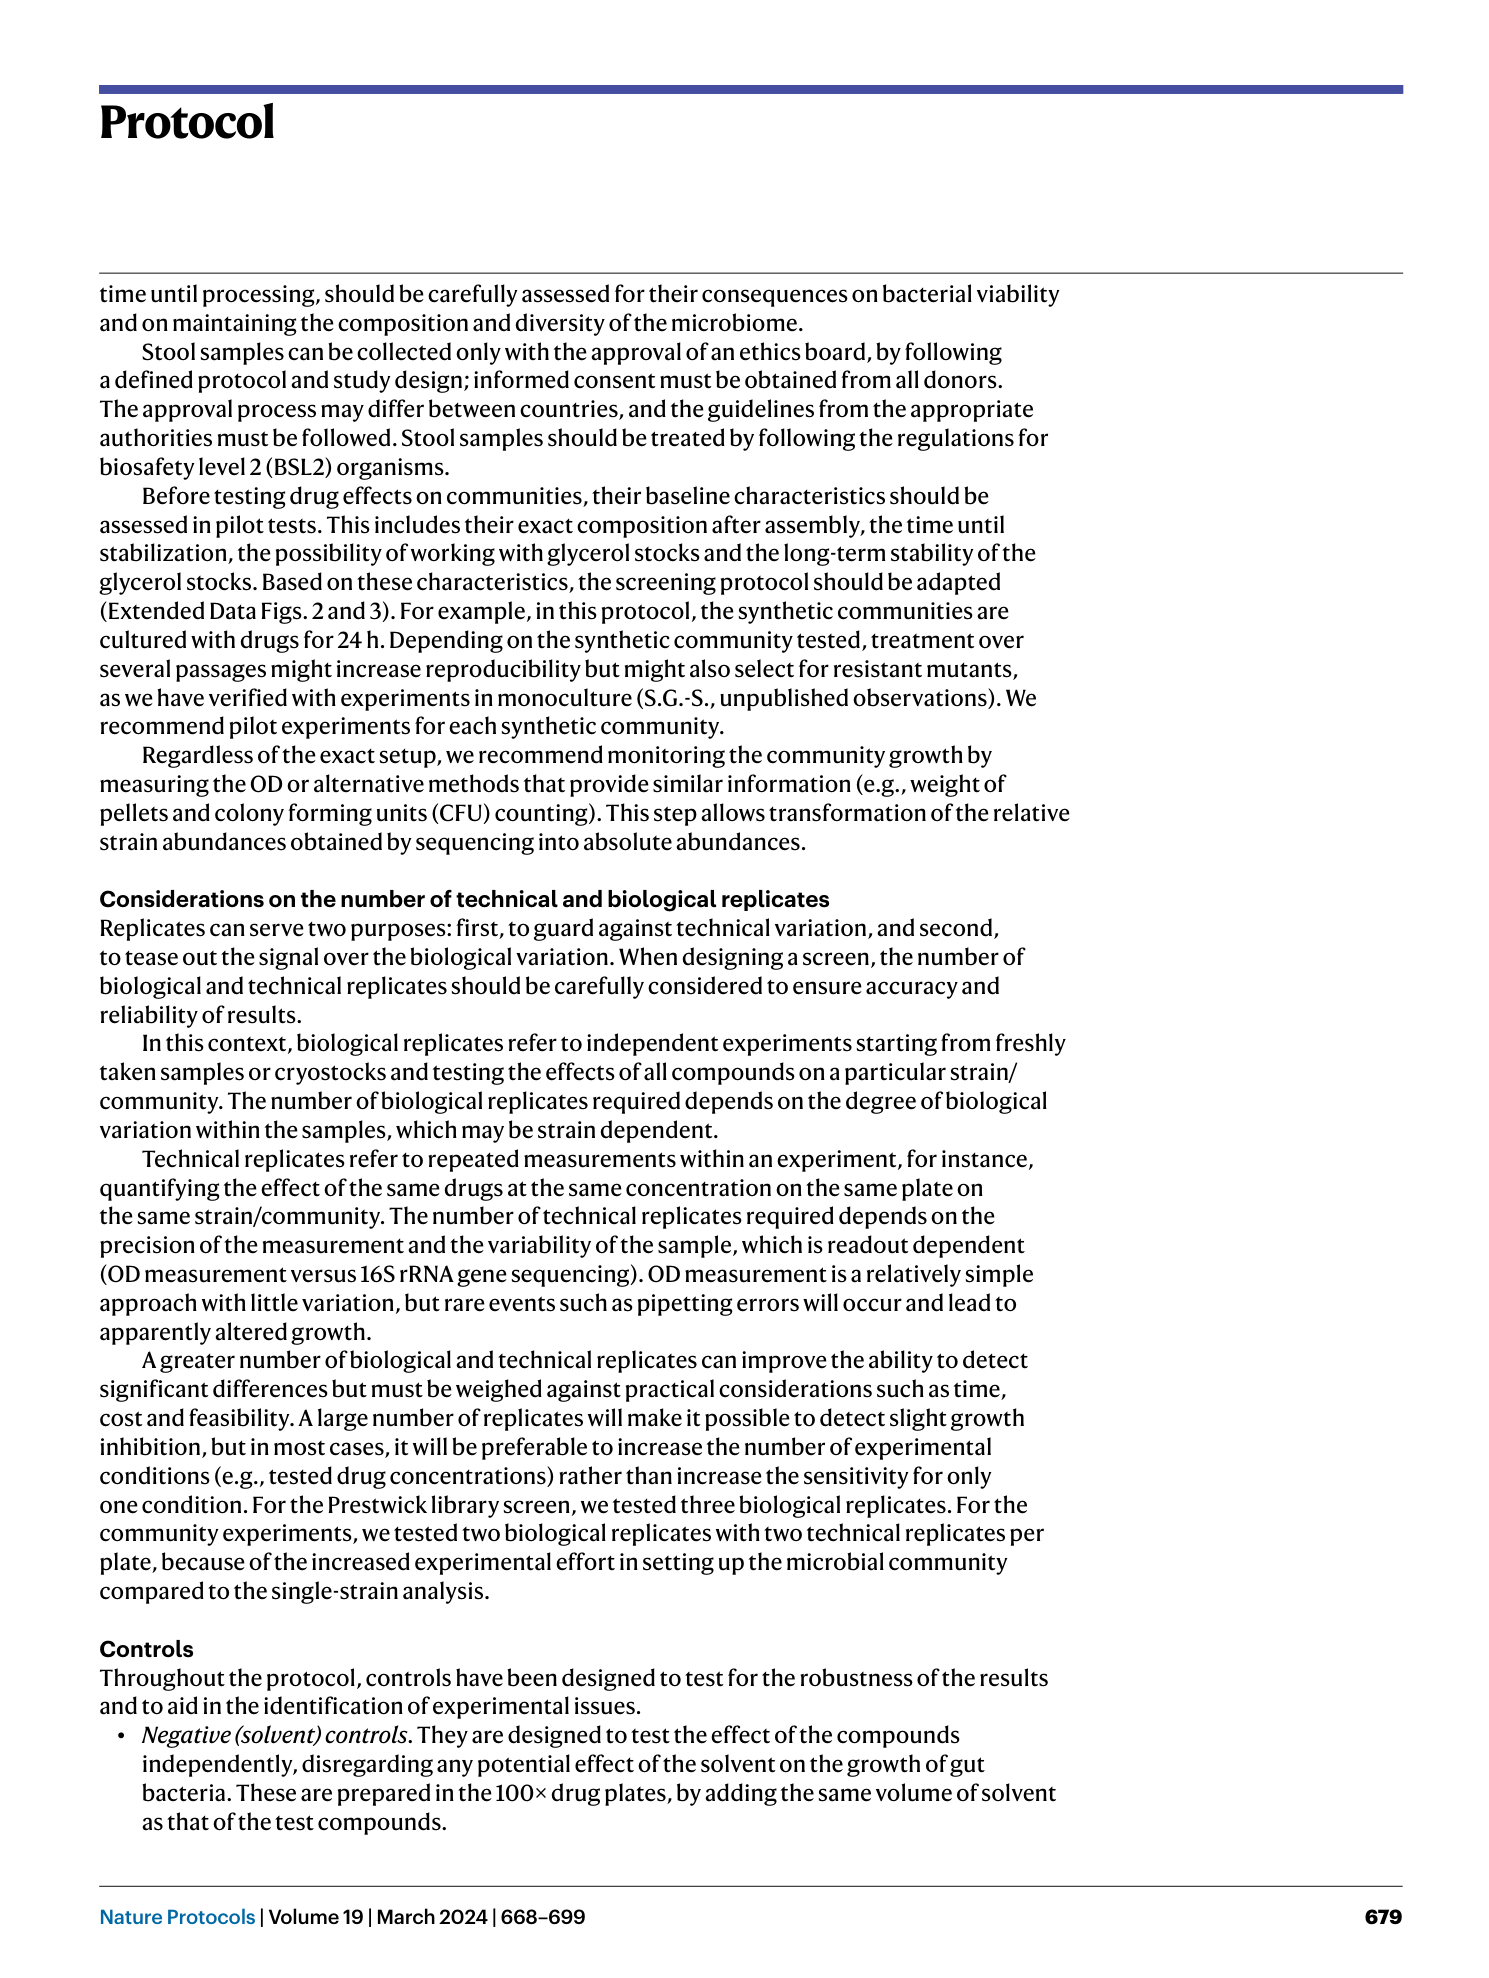
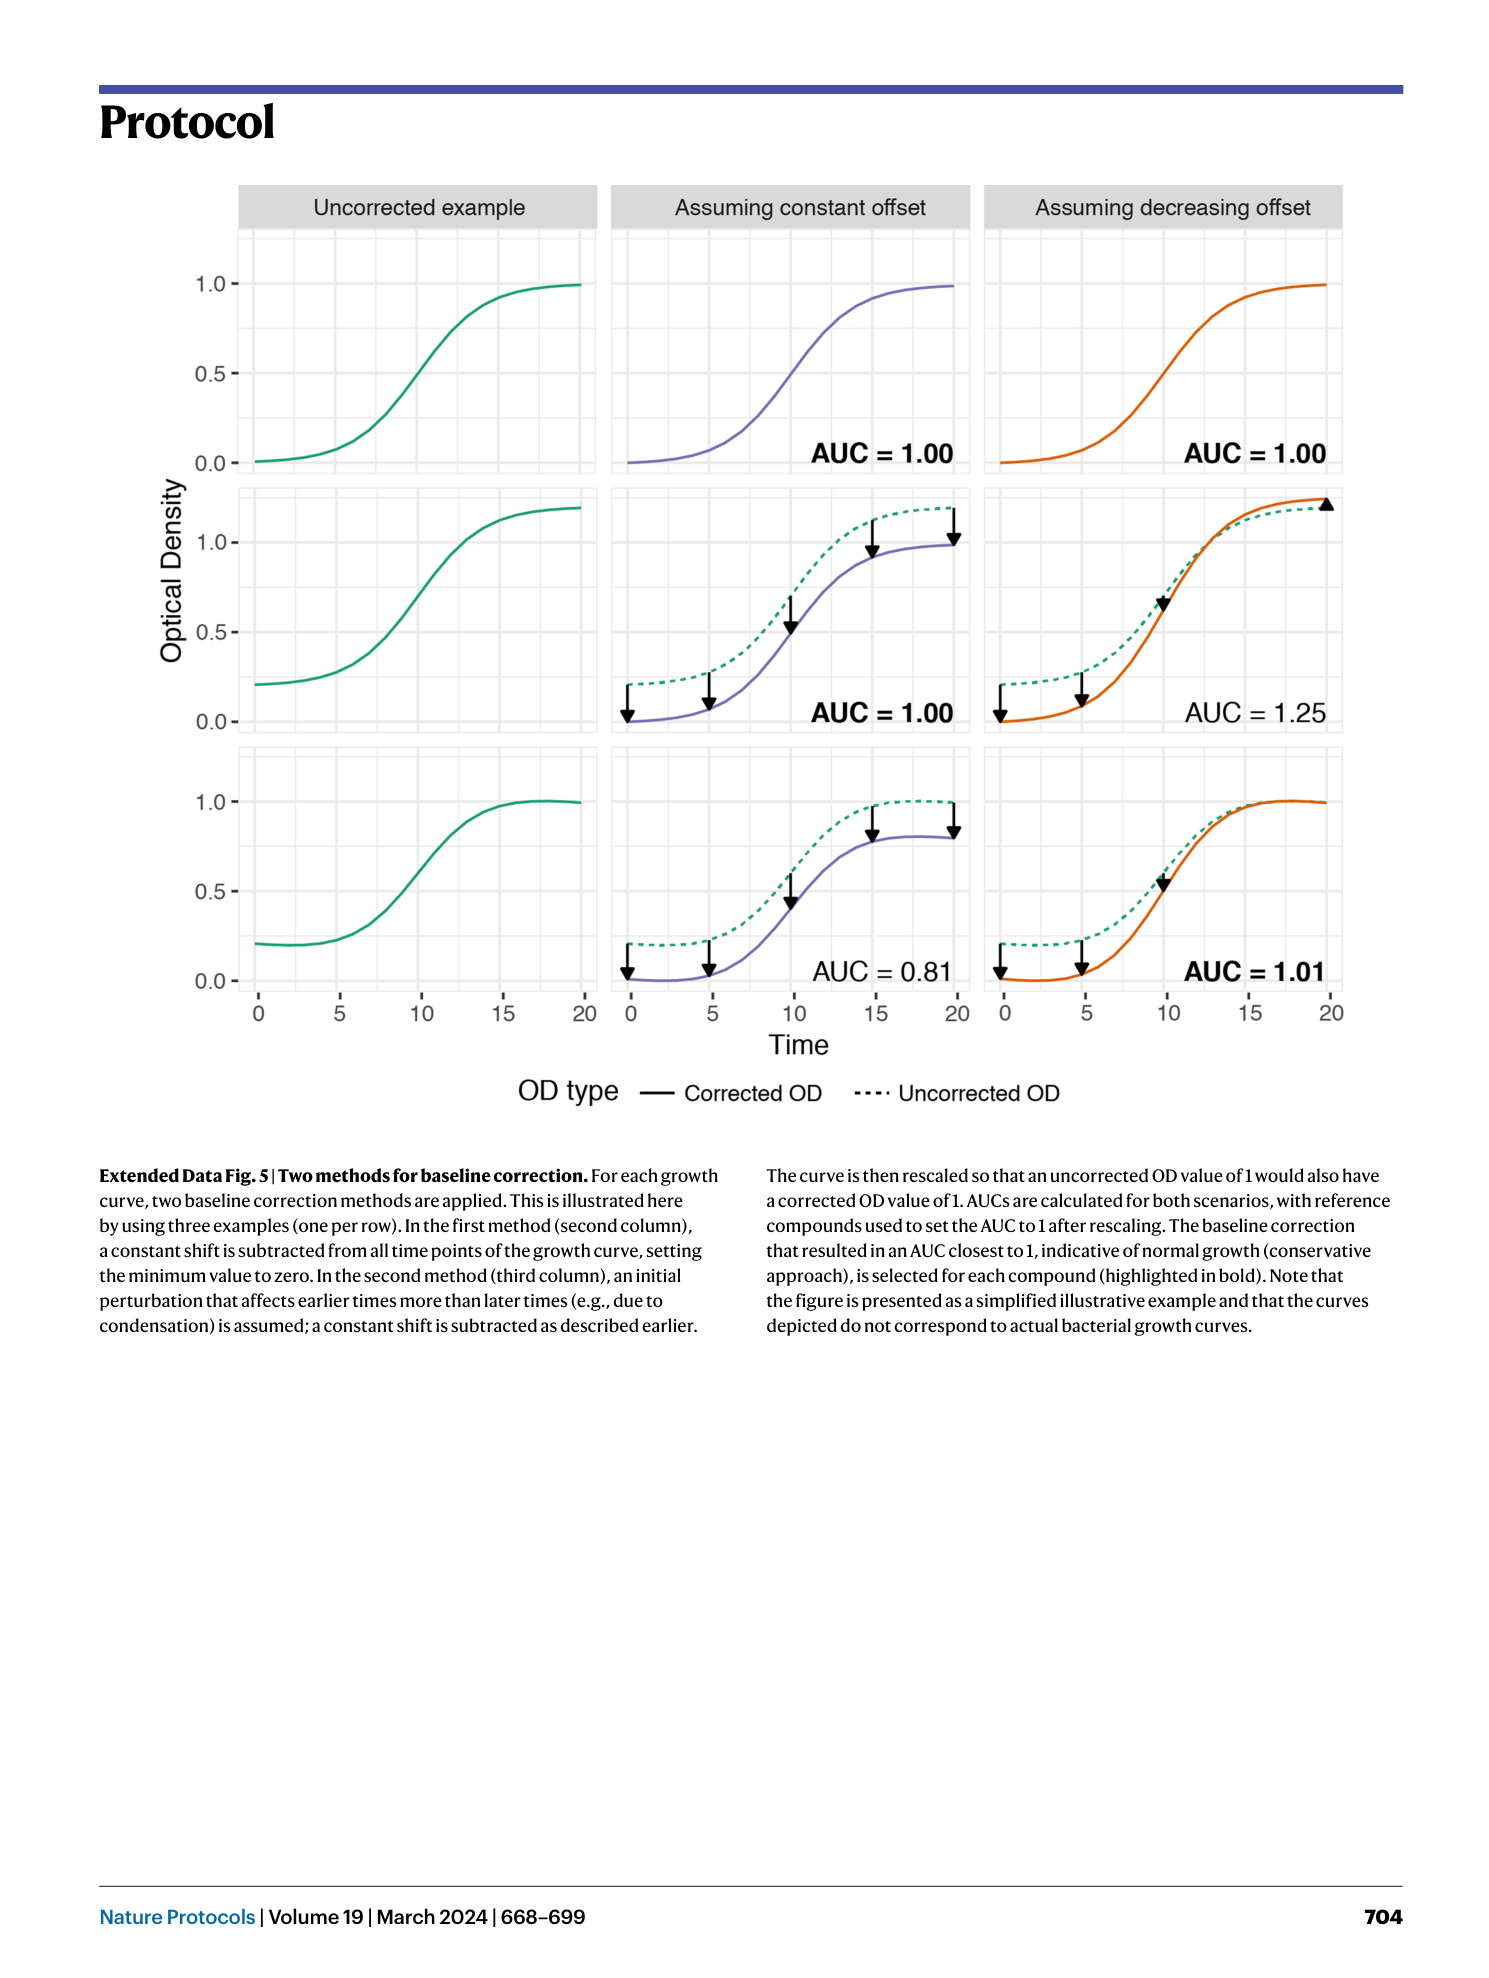
Extended Data Fig. 5 Two methods for baseline correction.
For each growth curve, two baseline correction methods are applied. This is illustrated here by using three examples (one per row). In the first method (second column), a constant shift is subtracted from all time points of the growth curve, setting the minimum value to zero. In the second method (third column), an initial perturbation that affects earlier times more than later times (e.g., due to condensation) is assumed; a constant shift is subtracted as described earlier. The curve is then rescaled so that an uncorrected OD value of 1 would also have a corrected OD value of 1. AUCs are calculated for both scenarios, with reference compounds used to set the AUC to 1 after rescaling. The baseline correction that resulted in an AUC closest to 1, indicative of normal growth (conservative approach), is selected for each compound (highlighted in bold). Note that the figure is presented as a simplified illustrative example and that the curves depicted do not correspond to actual bacterial growth curves.
Extended Data Table 1 Strains used in this study
