Enzyme-free targeted DNA demethylation using CRISPR–dCas9-based steric hindrance to identify DNA methylation marks causal to altered gene expression
Daniel M. Sapozhnikov, Moshe Szyf





Extended
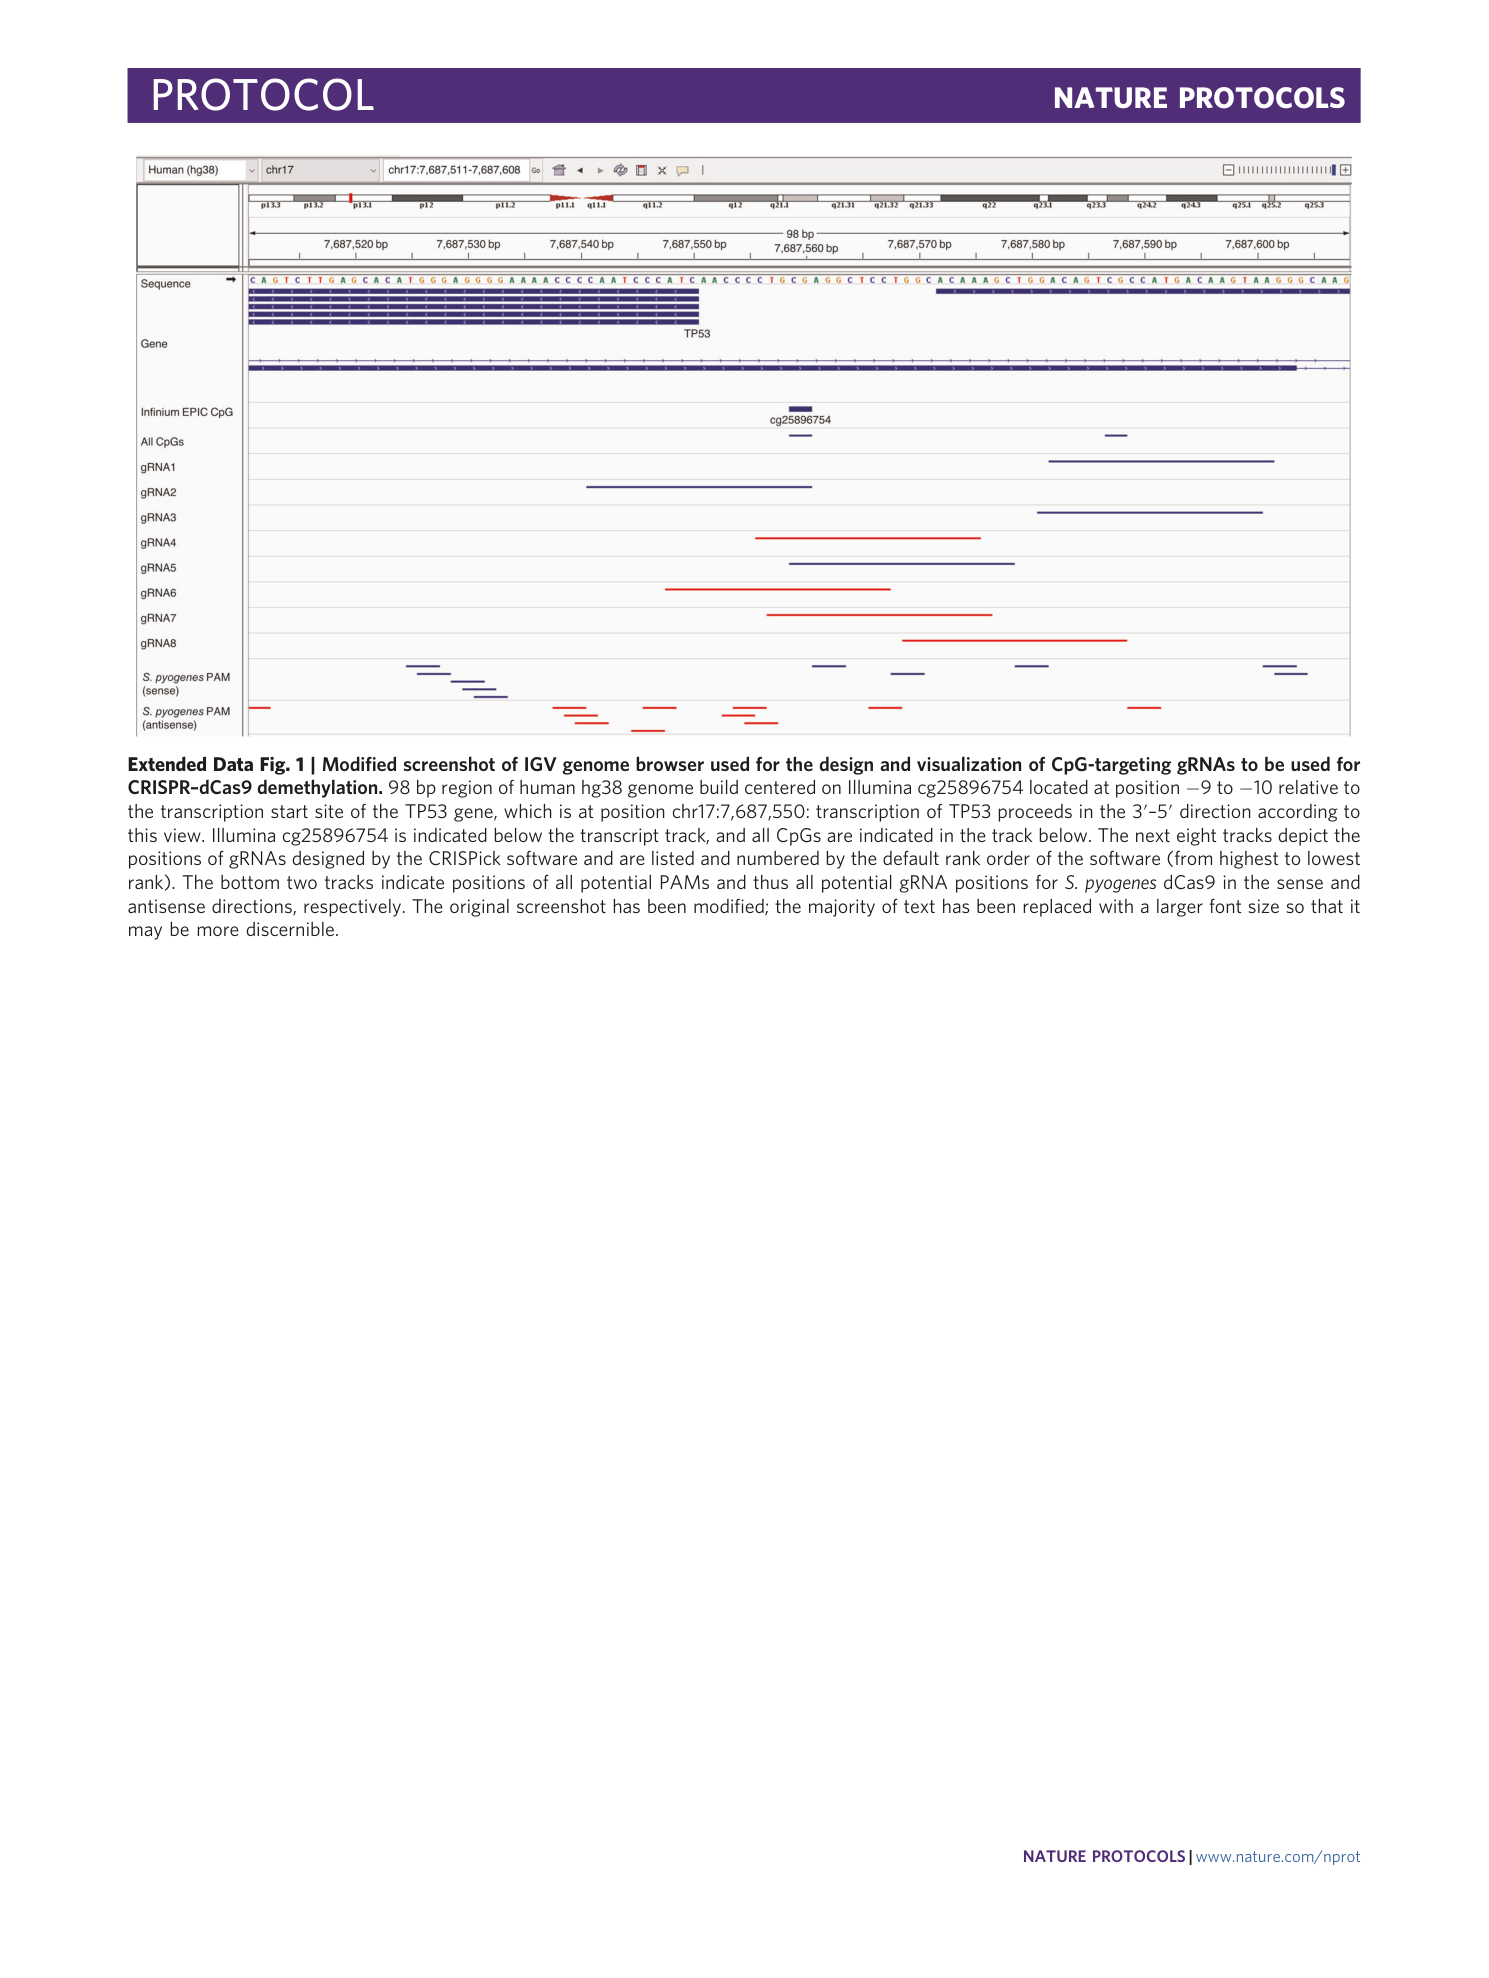
Extended Data Fig. 1 Modified screenshot of IGV genome browser used for the design and visualization of CpG-targeting gRNAs to be used for CRISPR–dCas9 demethylation.
98 bp region of human hg38 genome build centered on Illumina cg25896754 located at position −9 to −10 relative to the transcription start site of the TP53 gene, which is at position chr17:7,687,550: transcription of TP53 proceeds in the 3′–5′ direction according to this view. Illumina cg25896754 is indicated below the transcript track, and all CpGs are indicated in the track below. The next eight tracks depict the positions of gRNAs designed by the CRISPick software and are listed and numbered by the default rank order of the software (from highest to lowest rank). The bottom two tracks indicate positions of all potential PAMs and thus all potential gRNA positions for S. pyogenes dCas9 in the sense and antisense directions, respectively. The original screenshot has been modified; the majority of text has been replaced with a larger font size so that it may be more discernible.
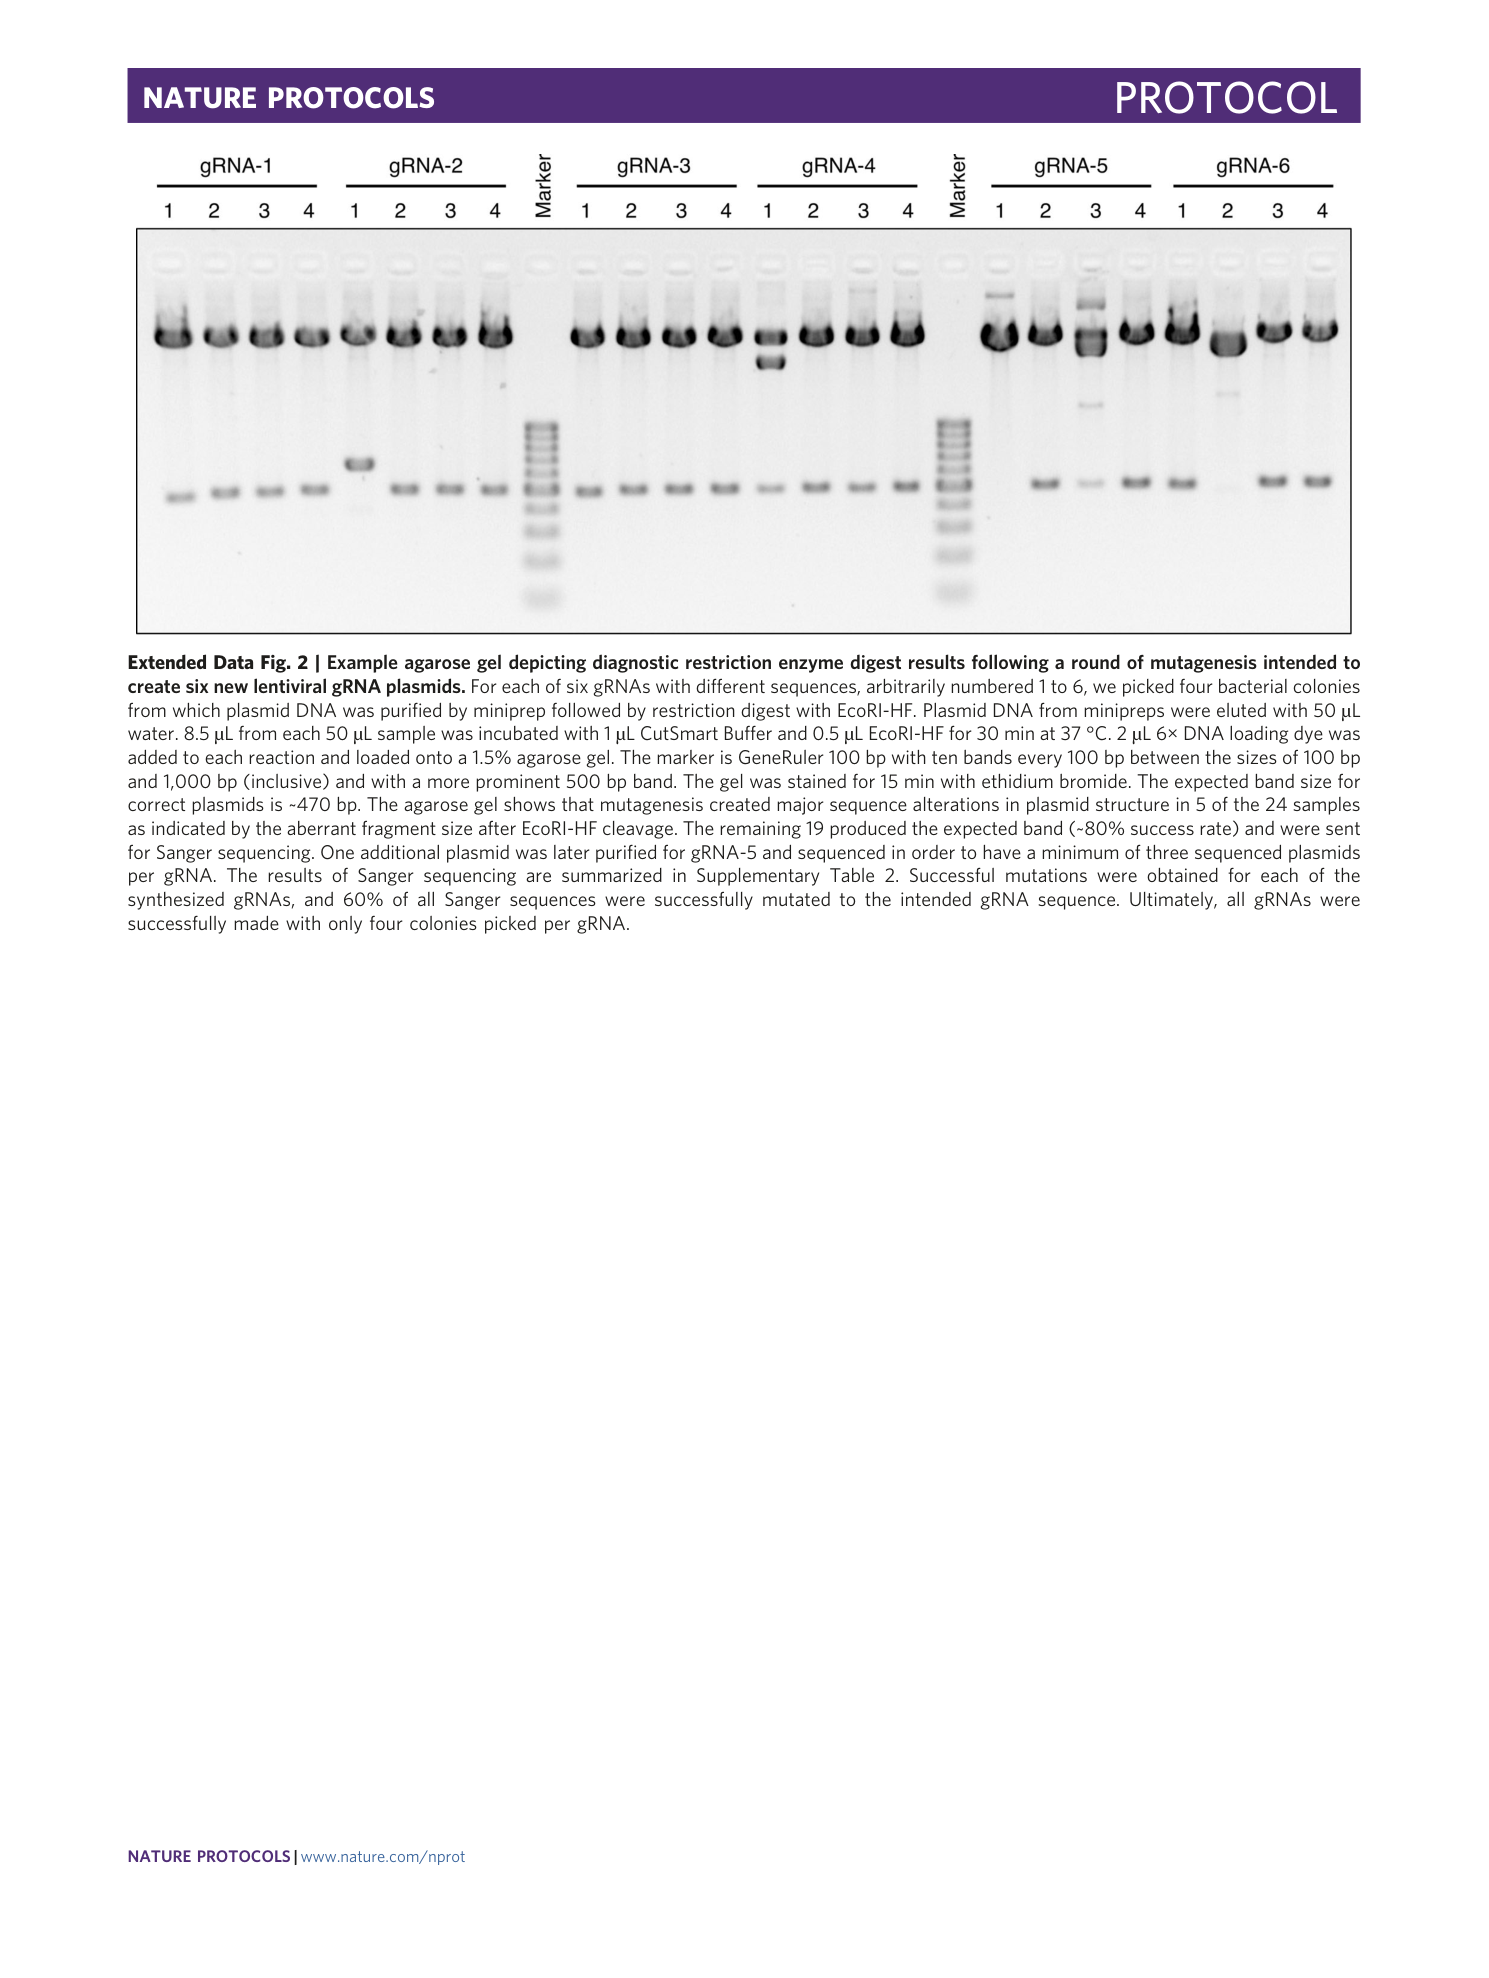
Extended Data Fig. 2 Example agarose gel depicting diagnostic restriction enzyme digest results following a round of mutagenesis intended to create six new lentiviral gRNA plasmids.
For each of six gRNAs with different sequences, arbitrarily numbered 1 to 6, we picked four bacterial colonies from which plasmid DNA was purified by miniprep followed by restriction digest with EcoRI-HF. Plasmid DNA from minipreps were eluted with 50 µL water. 8.5 µL from each 50 µL sample was incubated with 1 µL CutSmart Buffer and 0.5 µL EcoRI-HF for 30 min at 37 °C. 2 µL 6× DNA loading dye was added to each reaction and loaded onto a 1.5% agarose gel. The marker is GeneRuler 100 bp with ten bands every 100 bp between the sizes of 100 bp and 1,000 bp (inclusive) and with a more prominent 500 bp band. The gel was stained for 15 min with ethidium bromide. The expected band size for correct plasmids is ~470 bp. The agarose gel shows that mutagenesis created major sequence alterations in plasmid structure in 5 of the 24 samples as indicated by the aberrant fragment size after EcoRI-HF cleavage. The remaining 19 produced the expected band (~80% success rate) and were sent for Sanger sequencing. One additional plasmid was later purified for gRNA-5 and sequenced in order to have a minimum of three sequenced plasmids per gRNA. The results of Sanger sequencing are summarized in Supplementary Table 2 . Successful mutations were obtained for each of the synthesized gRNAs, and 60% of all Sanger sequences were successfully mutated to the intended gRNA sequence. Ultimately, all gRNAs were successfully made with only four colonies picked per gRNA.
Supplementary information
Supplementary Information
Supplementary Methods.
Supplementary Table 1
Potential off-target sites of scrambled gRNA sequence in pLenti-gRNA-puro in human and mouse genomes.
Supplementary Table 2
Sanger sequencing results of gRNA plasmid mutagenesis, related to Extended Data Fig. 2.
Supplementary Software 1
Excel template for fold-enrichment and P -value calculations for anti-Flag (dCas9) chromatin immunoprecipitation qPCR.

