Automated Quantification of Mitochondrial Fragmentation in an In Vitro Parkinson's Disease Model
Daniel J. Rees, Daniel J. Rees, Luke Roberts, Luke Roberts, M. Carla Carisi, M. Carla Carisi, Alwena H. Morgan, Alwena H. Morgan, M. Rowan Brown, M. Rowan Brown, Jeffrey S. Davies, Jeffrey S. Davies
Abstract
Neuronal mitochondrial fragmentation is a phenotype exhibited in models of neurodegeneration such as Parkinson's disease. Delineating the dysfunction in mitochondrial dynamics found in diseased states can aid our understanding of underlying mechanisms of disease progression and possibly identify novel therapeutic approaches. Advances in microscopy and the availability of intuitive open-access software have accelerated the rate of image acquisition and analysis, respectively. These developments allow routine biology researchers to rapidly turn hypotheses into results. In this protocol, we describe the utilization of cell culture techniques, high-content imaging (HCI), and the subsequent open-source image analysis pipeline for the quantification of mitochondrial fragmentation in the context of a rotenone-based in vitro Parkinson's disease model. © 2020 The Authors.
Basic Protocol 1 : SN4741 neuron culture and treatment in a rotenone-based model of Parkinson's disease
Basic Protocol 2 : Identification of cell nuclei, measurement of mitochondrial membrane potential, and measurement of mitochondrial fragmentation in mouse-derived midbrain dopaminergic neurons
INTRODUCTION
The extraction of substantial quantitative data from fluorescence and light-microscopic images of in vitro and ex vivo biological samples is beyond the ability of most day-to-day laboratory researchers. In the last few decades, the development of microscopy technology and the blending of routine biology and computer science skills have resulted in the development of intuitive open-source image analysis software to support laboratory experiments. The existence of software allows the successful automation of data-extraction processes to liberate investigators from hours of image-by-image manual data capture. As a result, the routine utilization of such techniques by biology researchers has accelerated (Kamentsky et al., 2011). Many protocols (or pipelines) developed can be readily adapted by biologists to analyze myriad cell biology contexts. Here, we describe a protocol for the analysis of mitochondria.
In eukaryotic cells, mitochondria continuously undergo flux between fission and fusion, resulting in an observable difference in morphology (Scott & Youle, 2010). Dysfunction in mitochondrial dynamics in neurons is recognized as a measurable phenotype of in vitro and in vivo models of Parkinson's disease (PD) and other neurodegenerative diseases such as Alzheimer's disease and Huntington's disease (Franco, Li, Rodriguez-Rocha, Burns, & Panayiotidis, 2010; Haque et al., 2008; Pozo Devoto & Falzone, 2017). In vitro rotenone-based PD models represent a reliable and reproducible tool for investigating disease characteristics through analysis of subcellular organelle morphology (Betarbet et al., 2000; Sherer et al., 2002).
Rotenone is a highly lipophilic compound and an inhibitor of the electron transport system's complex 1 (NADH dehydrogenase) (Hoglinger et al., 2005; Jayaraj, Tamilselvam, Manivasagam, & Elangovan, 2013). Inhibition of electron transfer from NADH to ubiquinone in complex 1 of the electron complex system causes a build-up of electrons in the mitochondrial inner membrane space and an increase in the mitochondrial membrane potential (Mehta & Li, 2009). Rotenone exposure induces features of Parkinson's disease (PD) in vitro and in vivo, including selective nigrostriatal dopaminergic degeneration and formation of ubiquitin- and α-synuclein-positive inclusions (Betarbet et al., 2000; Sherer et al., 2002).
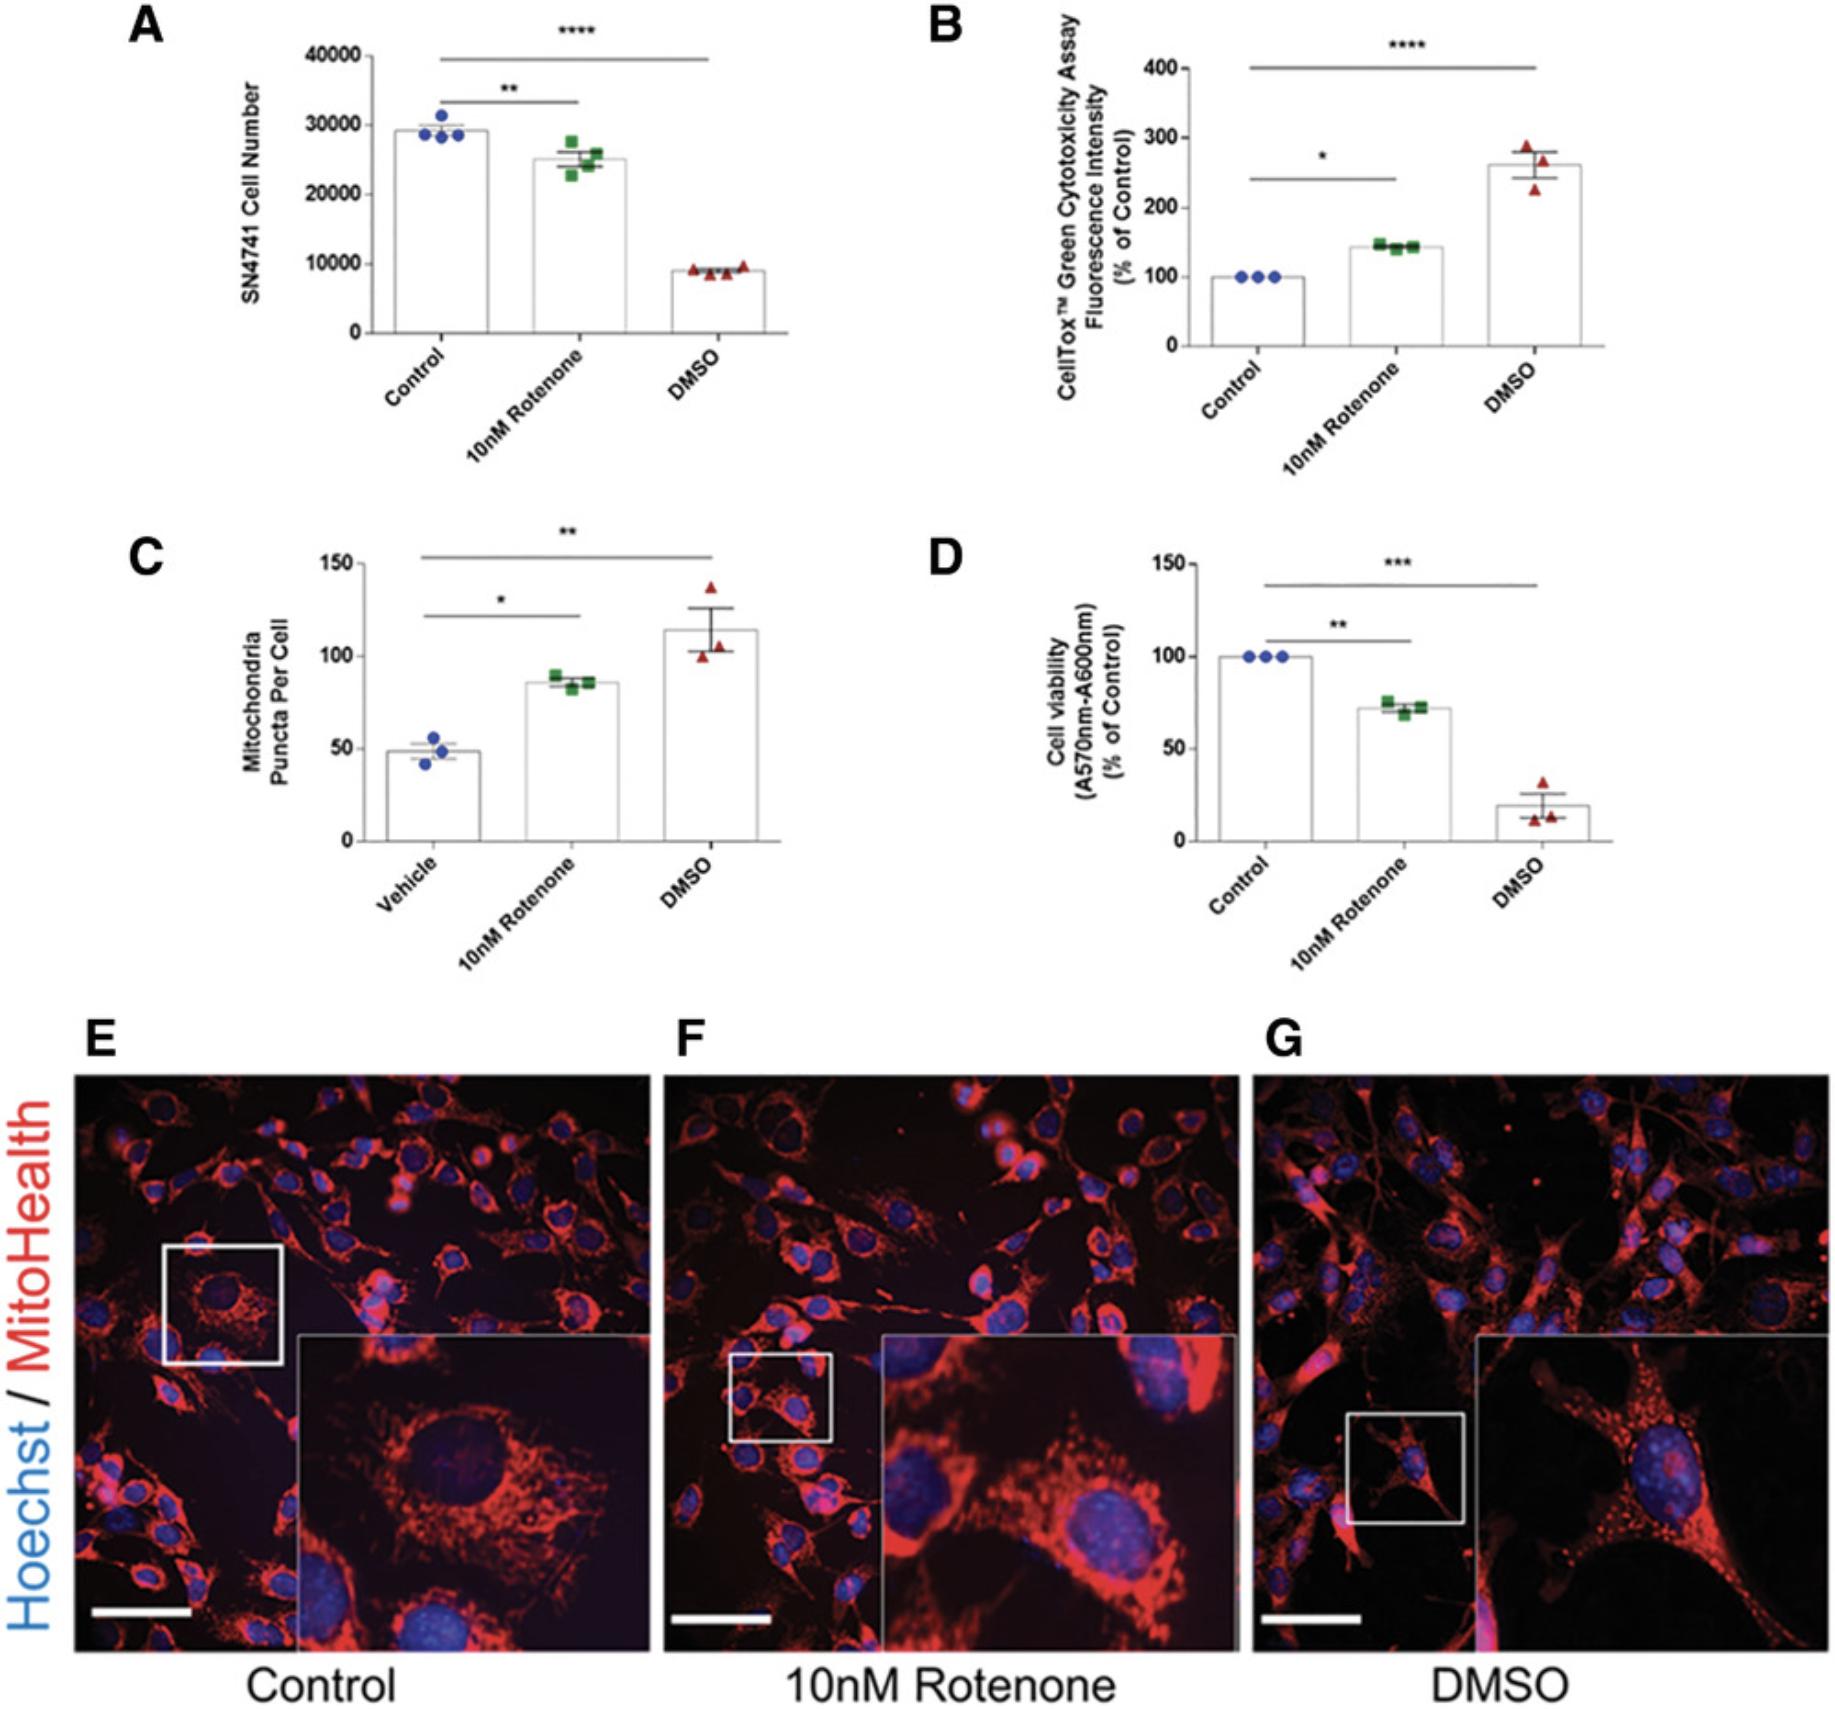
In our in vitro PD model, mitochondrial fragmentation is elevated following challenge with the neurotoxin rotenone. The 24-hr neurotoxin challenge also results in decreased cell viability, increased cell cytotoxicity, and loss of cell number. Here, we describe a simple, yet robust protocol for the quantification of mitochondrial fragmentation using routine laboratory neuron cell culture techniques aided by automated analysis via open-source computer software. See Figure 10 in Understanding Results for supplementary data.
In this article, we separate the method into its two key strands: SN4741 neuron culture and treatment in a rotenone-based model of Parkinson's disease (PD), which outlines an in vitro rotenone PD model, fluorescence labeling of mitochondria, and image acquisition (Basic Protocol 1); and step-by-step construction and execution of an automated CellProfilerTM (CellProfiler) pipeline for the analysis of mitochondrial fragmentation (Basic Protocol 2).
Basic Protocol 1: SN4741 NEURON CULTURE IN A ROTENONE-BASED MODEL OF PARKINSON'S DISEASE
This protocol details wet-lab sample preparation and subsequent image-acquisition procedures. The images acquired in this protocol are saved onto a physical or cloud storage platform. A step-by-step guide to building and executing an automated CellProfiler (https://cellprofiler.org/) analysis pipeline for the extraction of mitochondrial measurements will be detailed in Basic Protocol 2.
In Basic Protocol 1, we acquire images for subsequent data measurements related to mitochondrial health and fragmentation status. We utilize an in vitro rotenone-based PD model the use of which which results in increased cytotoxicity coupled with decreased neuron viability and neuron loss (see Figure 10 in Understanding Results). At the experimental endpoint, MitoTracker Orange (HCS Mitochondrial Health Kit, Invitrogen, cat. no. H10295) is used to label mitochondria with polarized membranes. In this assay, signal intensity in the orange channel is proportional to membrane potential and mitochondrial health. The experimental setup was designed for testing the effects of a range of putative anti-PD compounds on mitochondrial structure and function.
Membrane potential is a central feature of healthy mitochondria, and membrane depolarization is a good indicator of mitochondrial dysfunction and a measure of cytotoxicity (Jayaraj et al., 2013; Reddy, 2009). This protocol uses Invitrogen MitoTracker Orange as an indicator of mitochondrial function, because its accumulation in the mitochondria of live cells is proportional to the mitochondrial membrane potential (Scorrano, Petronilli, Colonna, Di Lisa, & Bernardi, 1999), to provide a relative assessment of mitochondrial membrane potential. Several other fluorescent lipophilic cationic dyes [e.g., MitoTracker, tetramethylrhodamine methyl (TMRM) and ethyl (TMRE)] have also become important tools for making a relative assessment of mitochondrial membrane potential in live cells (Perry, Norman, Barbieri, Brown, & Gelbard, 2011). Cationic probes such as TMRM are readily sequestered in the matrix space of polarized mitochondria, and are released once mitochondria experience a loss in membrane potential (Kholmukhamedov, Schwartz, & Lemasters, 2013). MitoTracker dyes possess a reactive chloromethyl group that forms a covalent bond with thiols on proteins and peptides, which traps MitoTracker dyes within mitochondria. As a result, mitochondria retain MitoTracker dyes after loss of their membrane potential, e.g., upon aldehyde fixation. Although the relationship between mitochondrial membrane potential and fluorescence signal intensity is less linear with MitoTracker dyes, for relative assessment of mitochondrial membrane potential, these dyes possess the advantage of being aldehyde fixable (Elmore, Nishimura, Qian, Herman, & Lemasters, 2004; Perry et al., 2011; Poot et al., 1996). Invitrogen Hoechst 33342 is used as a segmentation tool to identify cells. Hoechst 33342 nucleic acid stain is a popular cell-permeant nuclear counterstain that emits blue fluorescence when bound to dsDNA. Hoechst 33342 binds preferentially to adenine-thymine (A-T) regions of DNA. This stain binds into the minor groove of DNA (Sandhu, Warters, & Dethlefsen, 1985). A viability stain, such as the Invitrogen Image-iT DEAD Green Viability Stain, can be easily incorporated to further multiplex the assay; however, it is omitted from this protocol. These dyes have sufficient retention of fluorescence signal intensity upon formaldehyde fixation and detergent permeabilization to be useful in fixed endpoint assays, as well as in applications involving immunocytochemistry for specific protein detection.
In this protocol, we use the SN4741 mouse midbrain neuronal cell line, which are substantia nigra dopaminergic cells derived from transgenic mouse embryos (Son et al., 1999). The SN4741 cell line is a transformed cell line, and the procedure undertaken for the establishment of the SN4741 line at Cornell University Medical College and Laboratory of Molecular Neurobiology is described in detail in Son et al. (1999). The use of these cells for neurodegenerative models is reported in many in vitro experiments (Fishman-Jacob, Reznichenko, Youdim, & Mandel, 2009; Rodriguez-Losada, Romero, Estivill-Torrús, Guzmán de Villoria, & Aguirre, 2017; Son et al., 1999; Wang et al., 2017). The SN4741 cells were gifted to our lab and can be sourced from the founding laboratory.
Briefly, SN4741 neurons, an immortalized midbrain-derived dopaminergic mouse cell line (Son et al., 1999), were treated 24 hr with rotenone, then incubated with MitoTracker Orange, as described in the manufacturer's user manual, prior to formaldehyde fixation and Hoechst 33342 nuclear counterstaining. We subsequently use a CellProfiler image analysis pipeline to quantify intracellular mitochondrial fragmentation and fluorescence intensity of mitochondria in the peri-nuclear area of SN4741 neurons (see Basic Protocol 2).
In this article, MitoTracker Orange will be referred to as “MitoHealth.”
Materials
-
SN4741 mouse midbrain derived neuronal cell line, cryopreserved in liquid N2 (Cornell University Medical College and Laboratory of Molecular Neurobiology; see Son et al. (1999))
-
Complete SN4741 cell culture medium (see recipe)
-
Phosphate-buffered saline (PBS), pH 7.4, (Gibco, cat. no. 10010023)
-
Trypsin/EDTA (Gibco, cat. no. 15400054)
-
0.4% trypan blue stain (ThermoFisher, cat. no. 15250061)
-
Rotenone (Tocris, cat. no. 3616)
-
Dimethyl sulfoxide (DMSO; Sigma-Aldrich, cat. no. D2650)
-
MitoTracker Orange and Hoechst 33342 from the Invitrogens HCS Mitochondrial Health Kit (Invitrogen, cat. no. H10295)
-
Paraformaldehyde (PFA), 16% (w/v) aq. soln. (Fisher Scientific, Product Code.11490570)
-
T-75 cell culture flasks (Thermo Fisher, cat. no. 156499)
-
Water bath set to 37.5°C for pre-warming cell culture medium prior to application
-
37°C, 5% CO2 cell culture incubator
-
Benchtop vortex
-
25-, 10-, and 5-ml sterile pipettes, individually wrapped [Fisherbrand™ Product codes 12559546 (25 ml), 11809660 (10 ml), and 11899650 (5 ml)]
-
15-ml conical tubes (e.g., BD Falcon)
-
Countess™ Automated Cell Counter (Invitrogen Cat no. C10227) or manual hemocytometer
-
P-1000, P-200, and P-20 pipettes and filtered LTS pipette tips [VWR, 613-4774 (1000 µl), RAIN30389239 (200 µl), and 732-0273 (20 µl)]
-
37°C, 5% CO2 incubator
-
Corning® 96-well clear flat-bottom polystyrene TC-treated microplates, individually wrapped, with lids, sterile (Corning, Product no. 3596)
-
Microscope system: HCA wide-field fluorescence (GE Healthcare InCell 2000/6000), 40× objective lens, able to acquire 52 fields of view per well
-
Toshiba HDTB320EK3AA 2 TB Canvio Basics USB 3.0 Portable External Hard Drive (Toshiba)
-
Additional reagents and equipment for basic cell culture techniques including trypsinization and counting viable cells by trypan blue exclusion (see Current Protocols article: Phelan, 2001)
Seeding SN4741 cells for in vitro rotenone PD model
1.Retrieve cryovial of SN4741 cells (approximately 1 × 10⁶ cells) from liquid nitrogen storage.
2.Thaw cryovial of SN4741 cells in a 37°C water bath and pipette contents into 20 ml of pre-warmed complete cell culture medium to expand culture for experimental procedure.
3.Remove medium from cells in T-75 flask and wash once with 10 ml PBS. Swirl flask and use pipette to remove excess.
4.Apply 3-4 ml of trypsin/EDTA solution to the surface of the T-75 flask; swirl to ensure coverage, and return flask to incubator for 3-5 min until SN4741 cells become detached from surface of culture vessel. Check flask every few minutes to gauge cell detachment. Gently tap flask to detach residual cells from the surface of the T-75 flask.
5.Neutralize the trypsin by the addition of 4 ml complete cell culture medium.
6.Using a sterile pipette, pipette cell suspension up and down against surface of flask (∼10 times) to ensure single cell suspension and removal of the remaining adhering cells.
7.Transfer cell suspension to a 15-ml tube and count viable cells using trypan blue exclusion and scoring via a Countess cell counter (automated) or hemocytometer (manual).
8.Prepare a cell suspension with a concentration of 30,000 cells/ml (i.e., 3000 cells/100 µl) in complete culture medium.
9.Using a P-200 pipette and pipette tip, pipette 100 µl (∼3000 cells) of the cell suspension into each experimental well of a 96-well plate.
10.Place plate in incubator overnight (16-24 hr) for cells to adhere and proliferate.
11.Add 100 µl of culture medium to each well following 24-hr incubation, and incubate for a further 24 hr.
Preparation and addition of 10 nM rotenone in in vitro PD model
Concentrated (3×) rotenone stock is prepared by the addition of DMSO to a concentration of 100 mM. Aliquots are prepared and sealed in a 50-ml conical tube (BD Falcon), protected from light, and stored at −20°C.
12.Dilute 50 mg of powdered rotenone in 1.267 ml DMSO to prepare 100 mM rotenone stock.
13.Thoroughly mix (vortex) 3 µl of 100 mM rotenone stock diluted in DMSO into 10 ml of complete culture medium, producing a 30,000 nM rotenone solution.
14.Sequentially prepare 3000, 300, and 30 nM rotenone solutions by performing serial 1:10 dilutions—i.e., 100 µl of 30,000 nM rotenone solution mixed into 900 µl of cell medium to produce 1 ml of 3000 nM rotenone solution, etc.
15.Prepare vehicle controls from DMSO using the same dilution method. Use 100 µl of a 50:50 solution of DMSO in PBS as a positive control for analysis of cell death.
16.Add 100 µl of the 3× concentrated rotenone solution (30 nM) to appropriate wells [this is a 1:3 dilution, resulting in final well concentration of 10 nM (1×)].
17.Incubate cells for 24 hr under standard conditions (5% CO2, 37°C).
Application of MitoHealth dye
MitoHealth solution is prepared according to the kit developers’ instructional protocol. The MitoHealth kit contains Hoechst (Blue) and MitoHealth stain (red/orange).
18.Remove 175 µl of culture medium from appropriate wells of the plate from step 17, leaving 125 µl remaining.
19.Add 1.75 µl MitoHealth staining solution to 1 ml of complete medium. Protect from light.
20.Add 50 µl of staining solution prepared in step 19 to each well.
21.Incubate cells under normal cell culture conditions for 30 min.
22.Prepare fixation-counterstaining solution by adding 16% PFA stock solution and the Hoechst 33342 solution supplied with the Mitochondrial Health Kit to PBS in the ratio 3 ml: 6 µl: 9 ml. This makes a total of 14 ml of fixation-staining solution containing 4% PFA and 1:2000 Hoechst 33342.
23.Remove cell culture medium.
24.Add 100 µl of fixation-staining solution to each well. Protect from light and incubate at room temperature for 15 min.
25.Remove fixation-staining solution and gently wash cells once with 100 µl PBS to remove excess staining solution.
26.Add 200 µl PBS to each well.
Image acquisition at experimental endpoint
27.Acquire 52 2D-deconvoluted .tif format images per well at 40× magnification.
| HCS Mitochondrial Health Kit stain | Approximate FI excitation wavelength | Approximate FI emission wavelength | Location of cellular stain | InCell 40× objective filter |
|---|---|---|---|---|
| MitoHealth stain | 550 nm | 580 nm | Perinuclear/cytoplasmic | Cy3 |
| Image-iT® DEAD Green™ Viability Stain | 488 nm | 515 nm | Nucleus | FITC |
| Hoechst 33342 | 350 nm | 461 nm | Nucleus | DAPI |
28.Store image files on an external hard drive for downstream image analysis with CellProfiler image-analysis pipeline (described in Basic Protocol 2).
Basic Protocol 2: IDENTIFICATION OF CELL NUCLEI, MEASUREMENT OF MITOCHONDRIAL MEMBRANE POTENTIAL, AND MEASUREMENT OF MITOCHONDRIAL FRAGMENTATION IN MOUSE-DERIVED MIDBRAIN DOPAMINERGIC NEURONS
CellProfilerTM software is a flexible, user-friendly platform on which to conduct image analysis. The software and corresponding website—http://www.cellprofiler.org (RRID:SCR_007358)—contain pre-made computer algorithms (modules) and example analysis pipelines, respectively. CellProfiler is not an out-of-the-box, plug-and-play image-analysis software. Rather, these pre-made modules and example pipelines are used to teach researchers, with little computer programming or macro script writing experience, how to design and assemble an image-analysis pipeline to fit the specific needs of their experimental question. Interestingly, CellProfiler also allows for ImageJ (NIH) software input of macro scripts to aid image analysis.
The protocol below describes the step-by-step CellProfiler pipeline for the identification of nuclei, measurement of MitoHealth staining intensity, and quantification of the mitochondrial fragmentation protocol used for SN4741 cell mitochondrial measurements from 40× magnification digital images. This protocol was developed by optimizing a range of modules and example protocols. Each step includes a description, CellProfiler-derived notes, and rationale, followed by instructions on how to execute the step in CellProfiler software (in italic font). “Notes” are referenced from http://cellprofiler.org/manuals. The CellProfiler pipeline and modules described here are transferable between CellProfiler software versions 2.0 and 3.0 (Kamentsky et al., 2011; McQuin et al., 2018).
Materials
- CellProfiler software: version 2.1.0 or newer; versions 2.2.0 or newer will require Java 8; available at https://cellprofiler.org/releases/
- Digital images: on internal/external hard drive or cloud storage (Basic Protocol 1)
- Laptop or desktop PC: macOS, Windows (32-bit) or Windows (64-bit).
- MS Excel software
- GraphPad Prism or other relevant graphing or statistical analysis programs (e.g., MS Excel or SPSS) for graphs and statistical analysis
- Hard Drive for data storage: we use Toshiba HDTB320EK3AA 2 TB Canvio Basics USB 3.0 Portable External Hard Drive
Upload image set and perform image sorting, image pre-processing, and illumination correction
1.Open CellProfiler software.
2.Select ‘Images’ in the ‘Input Module’ window. Click inside the empty ‘File list’ window, then Browse and select the experimental image set.
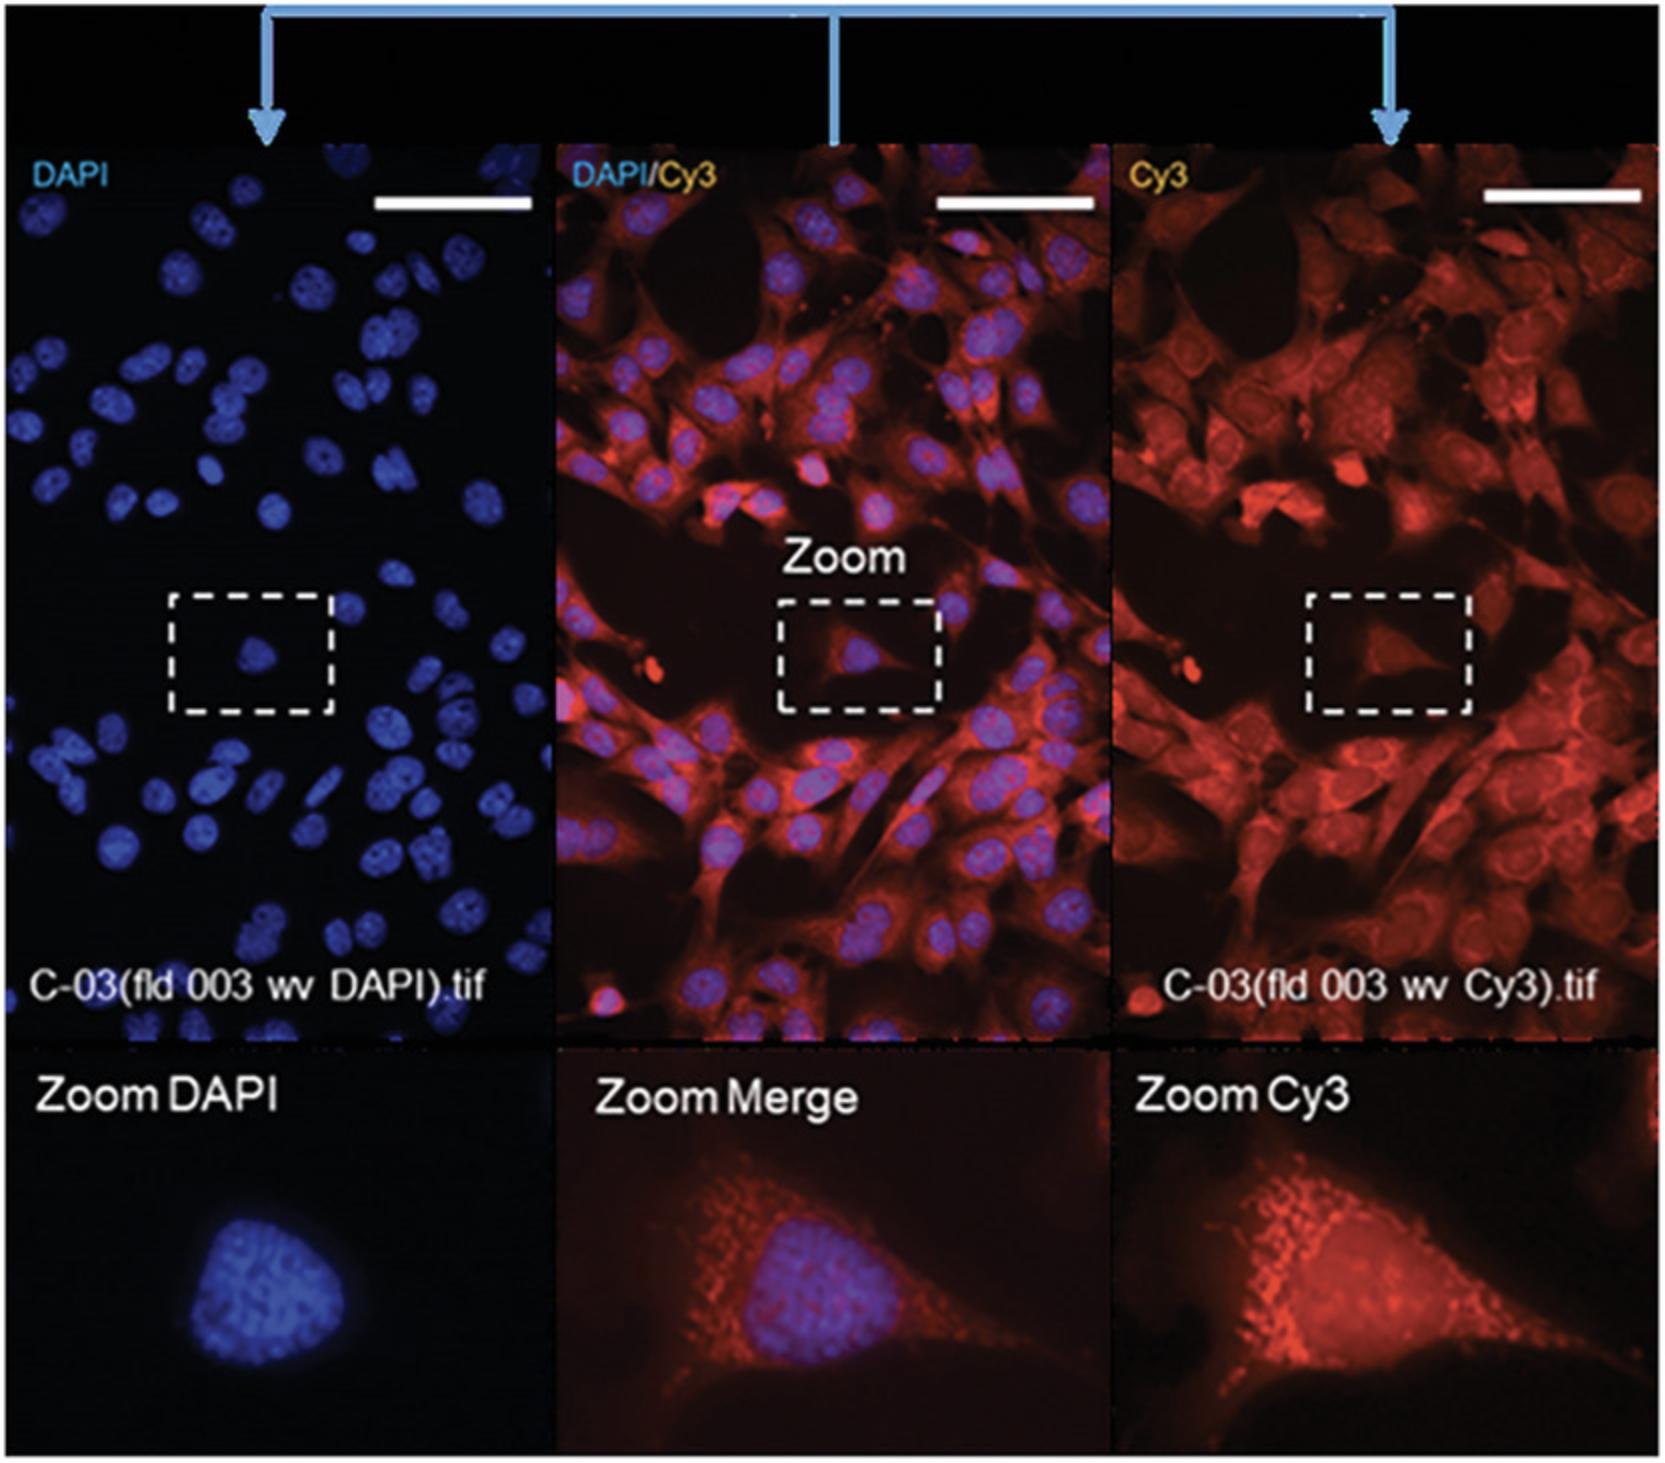
3.To filter the image according to filename, select ‘Names and Types’ in the pipeline Input modules. Select ‘Images Matching Rules’, then select ‘File’, ‘Does’, ‘Contain’ from the drop-down box selections. Type ‘DAPI’ into the input box to group DAPI channel images.
4.Select ‘Add another image’ and repeat the process with the exception of entering ‘Cy3’ into the input box to group Cy3 channel images. Assign a (user-defined) name for grouped files, then Select ‘Update’.
Care must be taken when filtering image sets by common phrases in filenames (see Fig. 1), such as ‘DAPI’ and ‘Cy3’, as phrases are case-sensitive. Inconsistency in spelling or case-sensitivity results in failure to identify files and sub-group images. The experimental image set should now be grouped in two file lists under user-defined group titles, e.g., DAPI and Cy3, and ranked in numerical order.
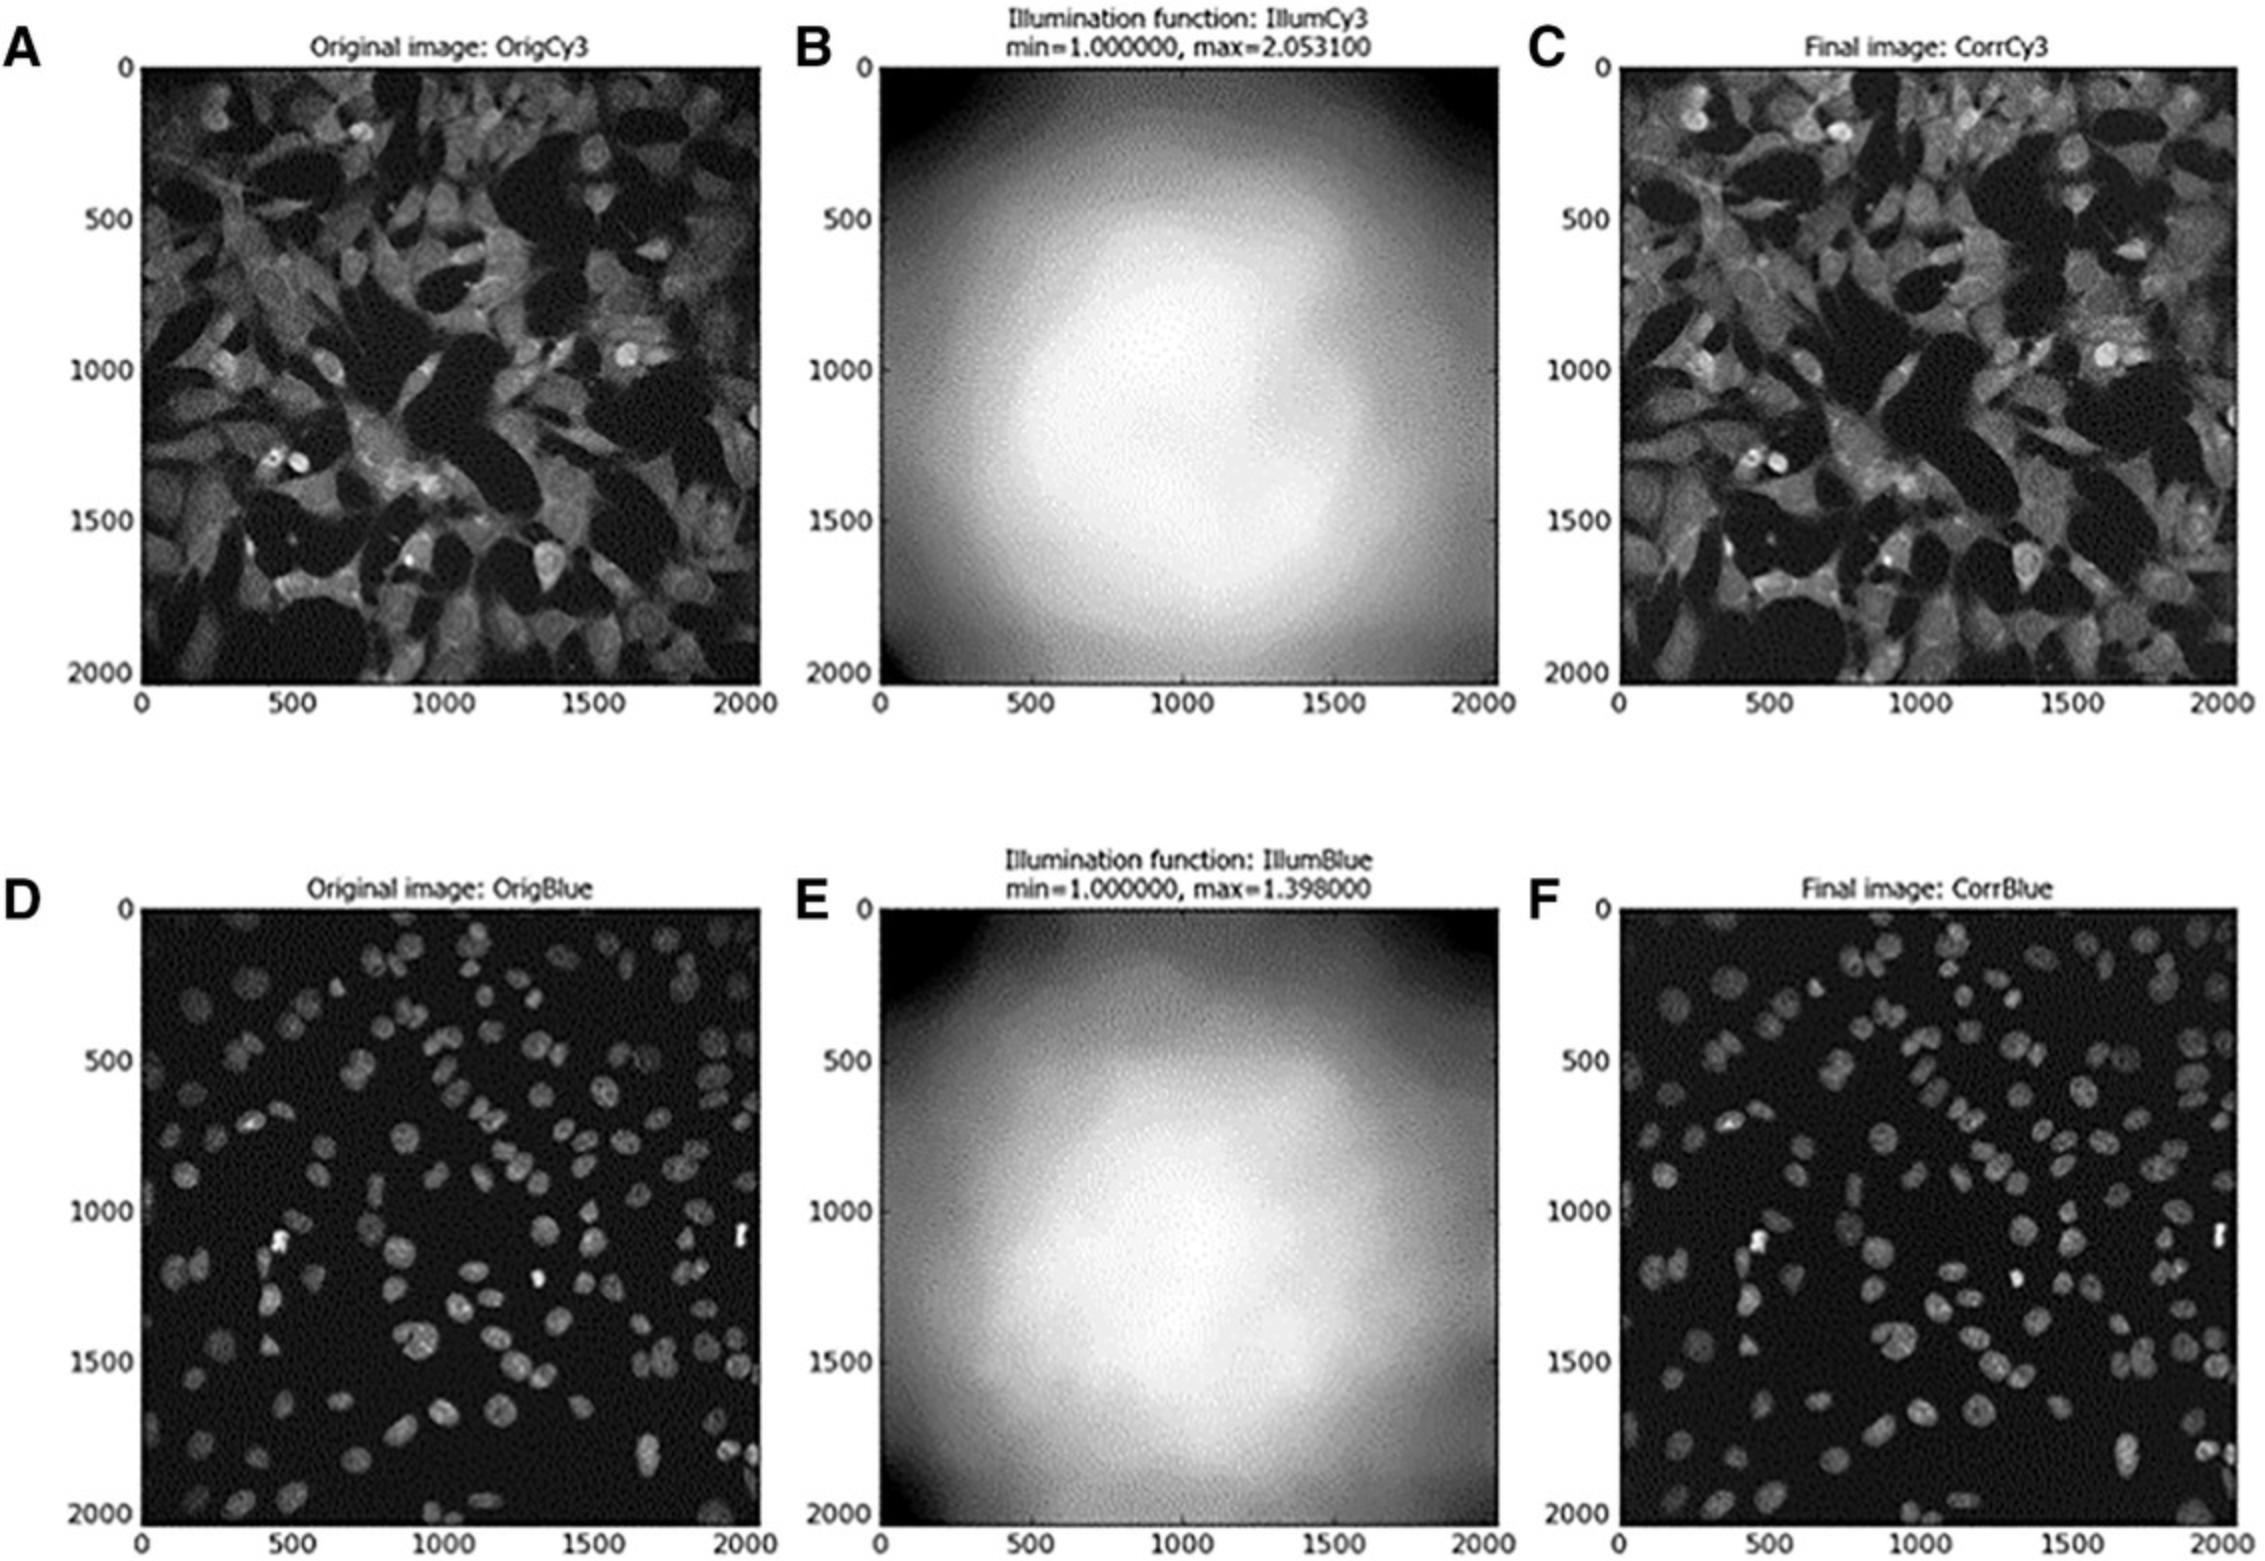
For the analysis of images taken with a fluorescence microscope, it is common for the images to be pre-processed prior to analysis. The most common reason for this is uneven illumination across a field of view, as the light source does not evenly illuminate across the entire area. This results in areas with greater illumination than other areas, usually the corners of the image.
5.Calculate correct illumination function:
1.Select Correct Illumination Calculate module, then select input image (name assigned from Names and Types). 2.Insert a (user-defined) Name for the Output Image, e.g., ‘IllumCy3’. 3.Select the ’Regular’ option in ‘How the illumination function is calculated’.
The option ‘Regular’ is selected if stained objects (e.g., cell bodies, nuclei) are evenly dispersed across your image(s) and cover most of the image. This is true in the case of Cy3- and DAPI-channel images. ‘Regular’ intensities create the illumination function based on the intensity at each pixel of the image (or group of images if you are in ‘All’ mode) and are applied by division using the Correct Illumination Apply module.
4.Select ‘Median Filter’, Select ‘Manual’ method to calculate filter size, then input smoothing filter size ‘325’.
Illumination function is calculated across the entire image set prior to initiation of object identification and subsequent data measurements.
6.To apply the illumination function calculated by Correct Illumination Calculate :
- Select the Correct Illumination Apply module.
- Input a user-defined name into the ‘Name the output image’ box e.g., ‘CorrCy3’.
- Select illumination function from drop-down box (as defined in the Correct Illumination Calculate module, e.g., IllumCy3).
- Select ‘Divide’ as method for how the illumination function is applied.
‘Divide’ is the recommended method for applying illumination function if the illumination correction function was created using ‘Regular’ in the Correct Illumination Calculate module.
Figure 2 illustrates the shading seen on edges of Cy3- and DAPI-channel-acquired images before and after application of illumination function as described above.
Identification of nuclei
Here, we identify cell nuclei (a feature) based on their high-contrast background-to-foreground staining intensity. In CellProfiler software, a primary object is defined as an object or feature (usually a cellular sub-compartment, e.g., nucleus) which can be used as the basis upon which the subsequent image analysis steps can be built.
Nuclei are commonly selected as the primary object of an image-analysis pipeline due to their relatively uniform morphology and high background-to-foreground staining intensity ratio, which make them easily identifiable.
Text in italic below represents instructions on how to execute the step in CellProfiler software.
7.Select > ‘Identify Primary Objects’ module.
8.Input > (user-named illumination-corrected) DAPI image(s).
9.Input > Typical Nucleus diameter range (pixels). Min: 50 and Max: 135.
10.Discard objects outside the diameter range > Yes.
11.Discard objects touching the border of the image > Yes.
Estimate nucleus diameter using CellProfiler by selecting a DAPI image by right clicking, selecting ‘Show Selected Image’, and selecting ‘Tools > Measure length’.
12.For thresholding, select ‘Global’ Thresholding Strategy with ‘Otsu’ method and ‘Two Classes’ thresholding. Set threshold correction factor of ‘1.0’, and lower and upper bounds to ‘0.0’ and ‘1.0’, respectively.
The ‘Global’ thresholding strategy uses the pixel intensities in each un-masked image to calculate a single threshold value to classify pixels as foreground (intensity above the threshold value) or background (intensity below the threshold value). This thresholding strategy is fast and robust, and is commonly applied to images that have a uniformly illuminated background. Foreground-to-background pixels are easily distinguishable using Hoechst-counterstained SN4741 cell nuclei. Foreground and background pixels of Hoechst-counterstained nuclei are easily identifiable in DAPI-channel images; thus, we use the ’Global’ thresholding strategy for primary object (nuclei) identification. Otsu is a method of automatically finding thresholds by splitting image pixels into two (foreground and background) or three classes (foreground, mid-level, and background) by minimizing the variance within each class. Lower bounds on threshold can be set at 0.0, as there is an object (Nucleus) in each image. Otherwise, an empirically determined lower threshold bound should be applied, as automatic methods of thresholding may mis-assign pixels in a blank image to the foreground class, potentially yielding false-positive results.
13.Select > ‘Shape’ for de-clumping of primary object which are touching or in close proximity and ‘Shape’ for drawing dividing lines between objects.
14.Select > ‘Yes’ to ‘Automatically calculate size of smoothing filter for de-clumping’.
15.Select > ‘Yes’ to ‘Automatically calculate minimum allowed distance between local maxima’.
16.Select > ‘No’ to ‘Retain outlines of the identified objects.
17.Fill in identified objects > ‘After both thresholding and de-clumping’.
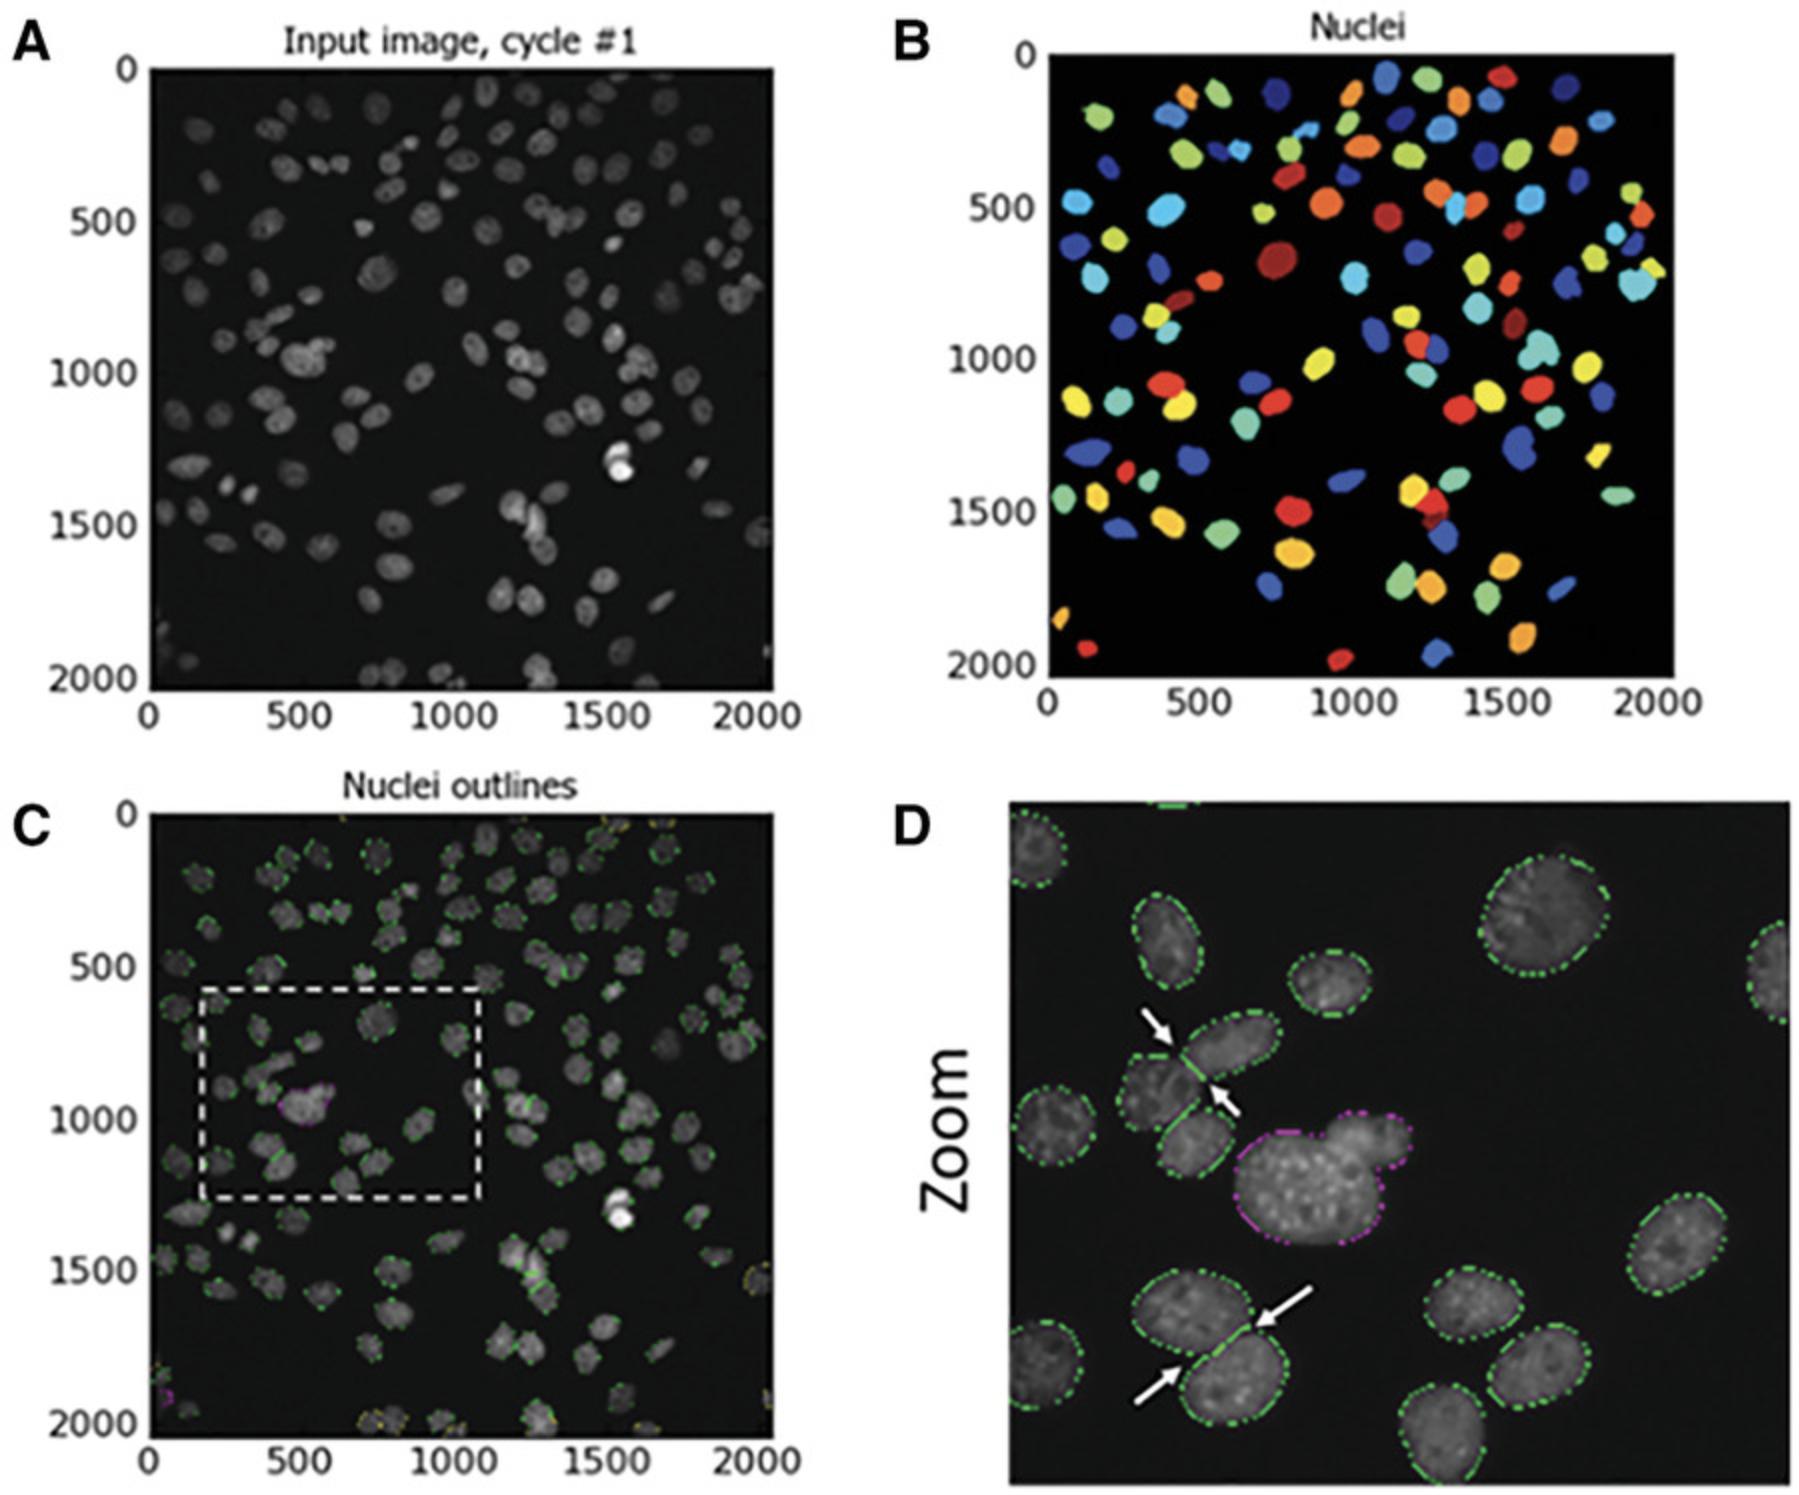
By selecting ‘shape’ in the CellProfiler pipeline as the de-clumping method, a line will be drawn between the areas of the two nuclei whose boundaries intercept. An intersecting line will be drawn between the two (or more) clumped nuclei, and these will then be identified as distinct nuclei. Examples of this are highlighted by white arrows in Figure 3D.
Identify secondary objects: ring-shaped cell body
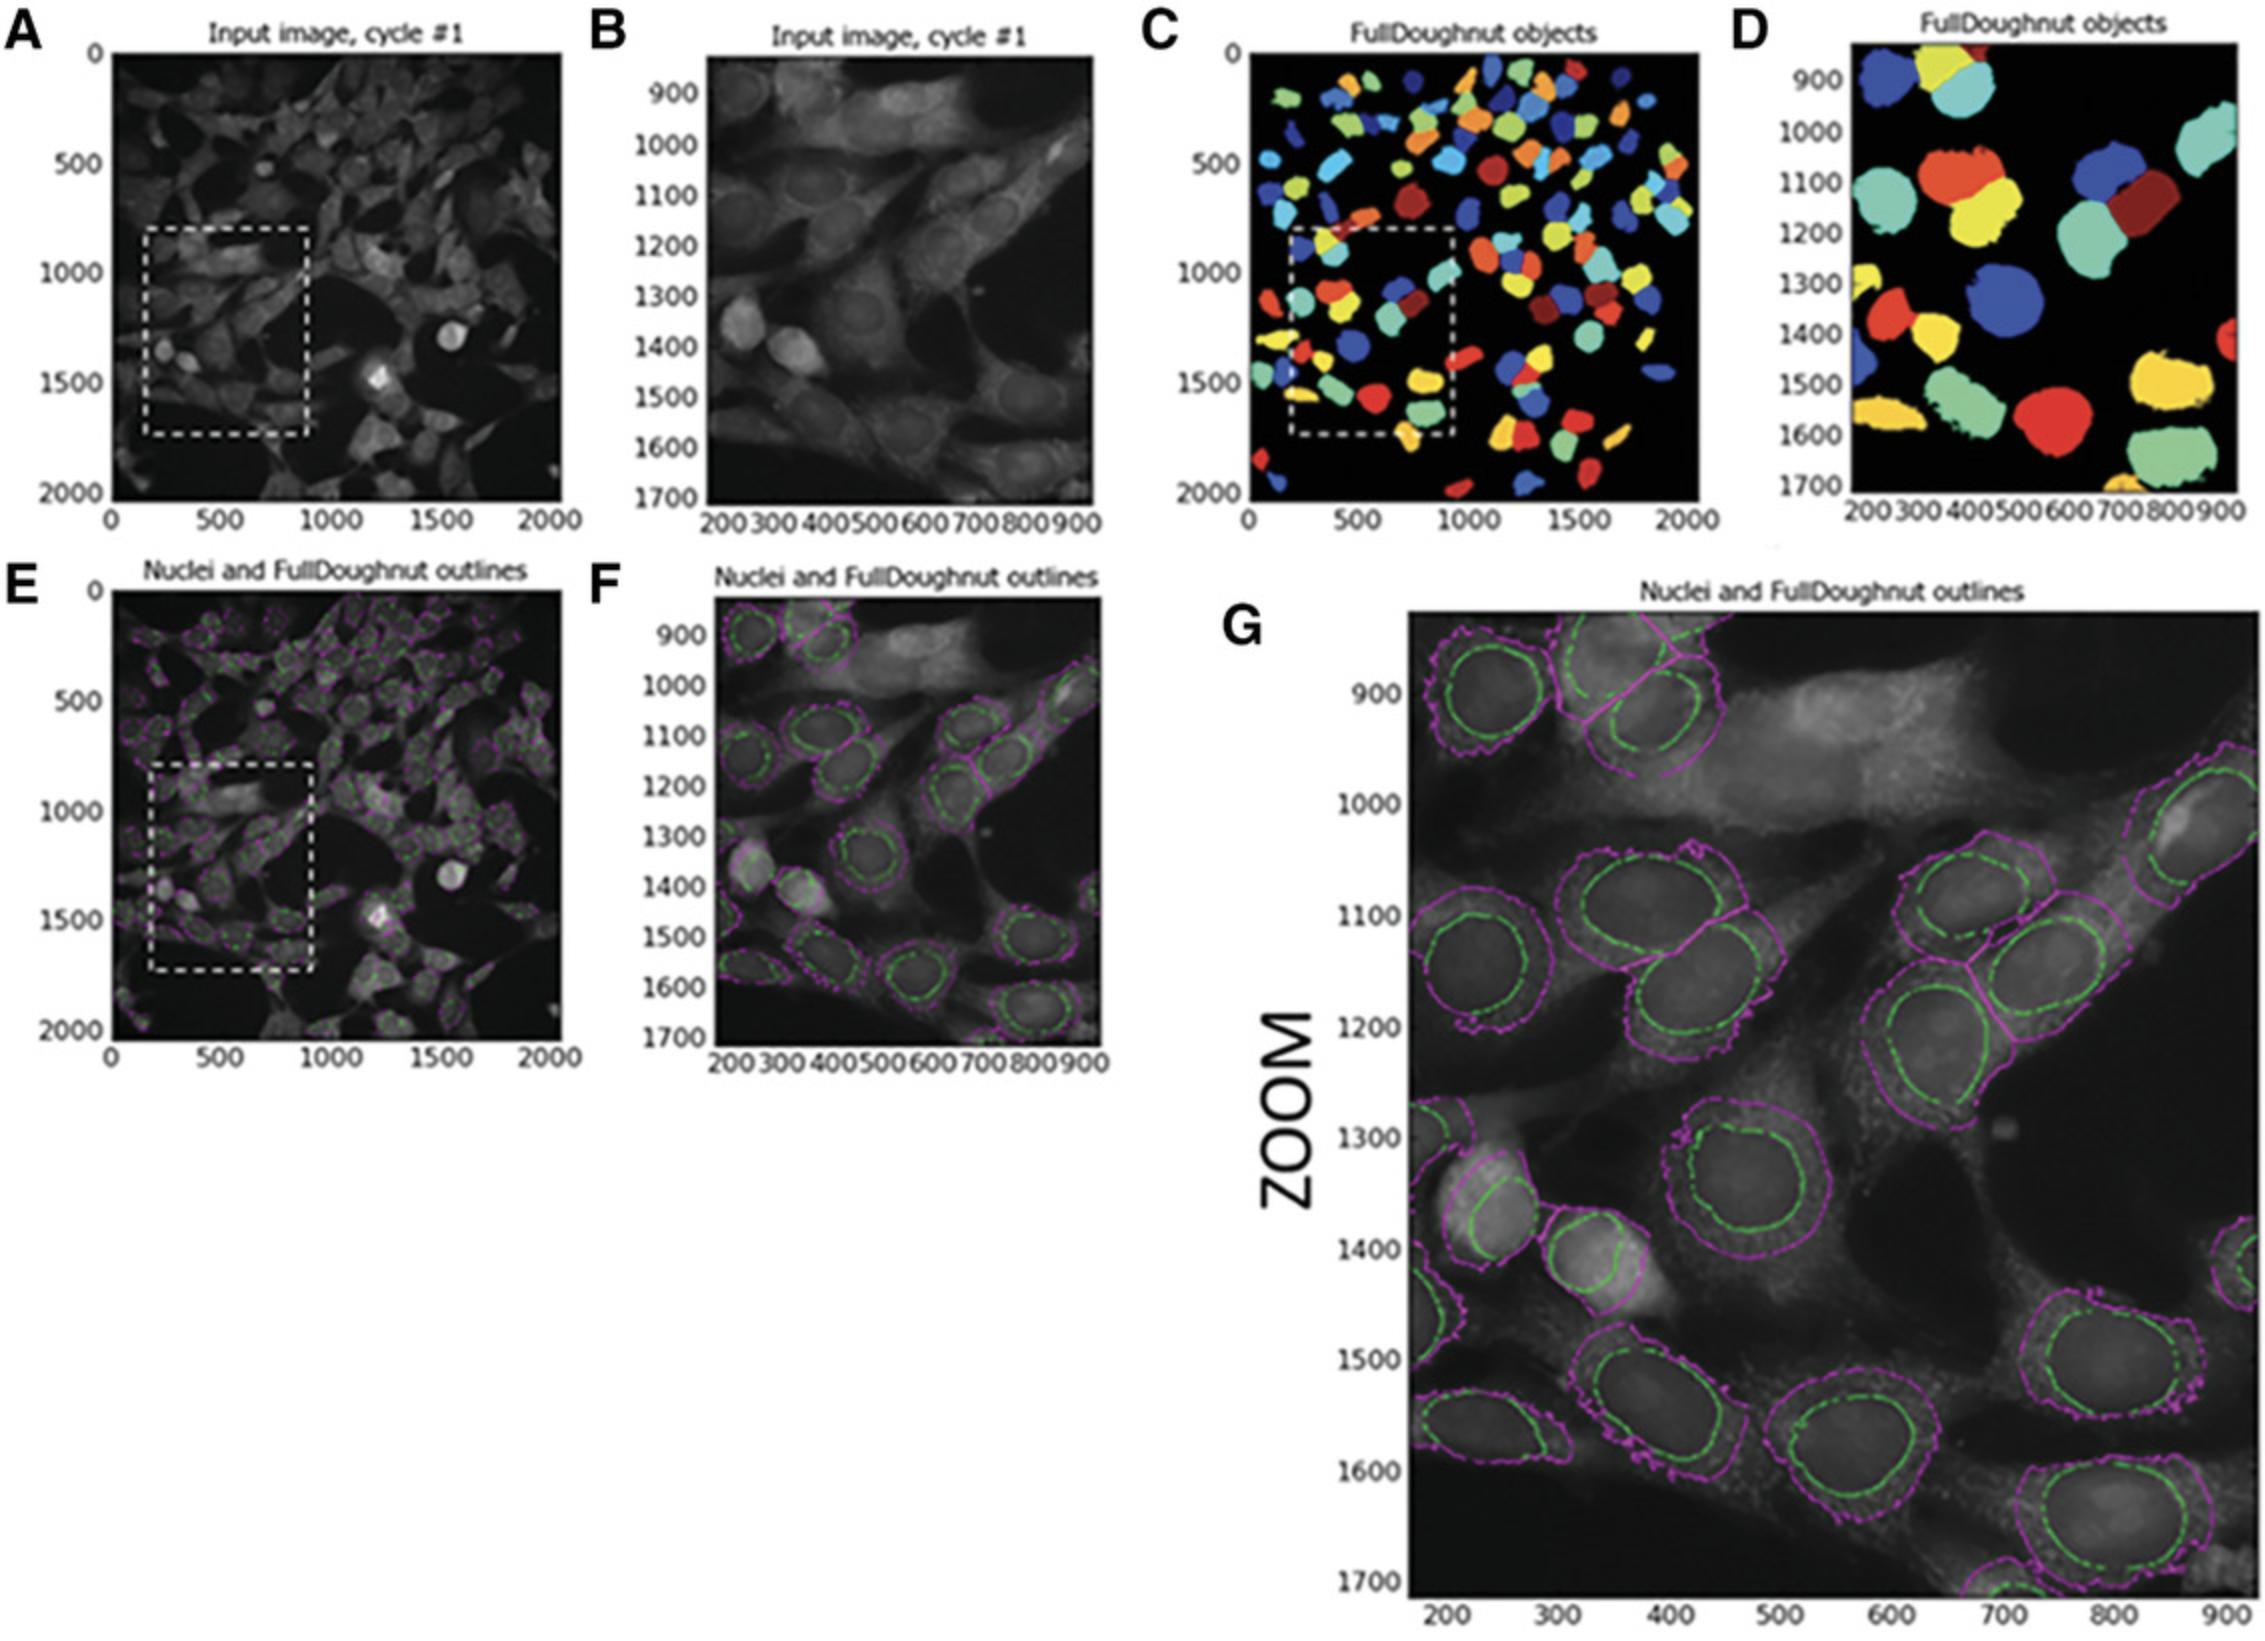
The next module in CellProfiler pipeline is Identify Secondary Objects. This module identifies objects by using the object identified by another module as a starting point. In this example, the primary objects (nuclei) identified in Identify Primary Objects will act as the basis for the identification of the SN4741 peri-nuclear area (doughnut-shaped ring around the nucleus) in the corresponding Cy3 images. This will be executed by dilation of the previously identified nuclei—this dilated nucleus area is named ‘Full Doughnut’ in Figure 4. A subsequent module in this pipeline will remove the nucleus, and a ring-like object will remain (a doughnut shaped-perinuclear region). This is referred to as ‘True Doughnut’ in Figure 5.Other modules will collect measurements such as area and intensity of peri-nuclear regions.
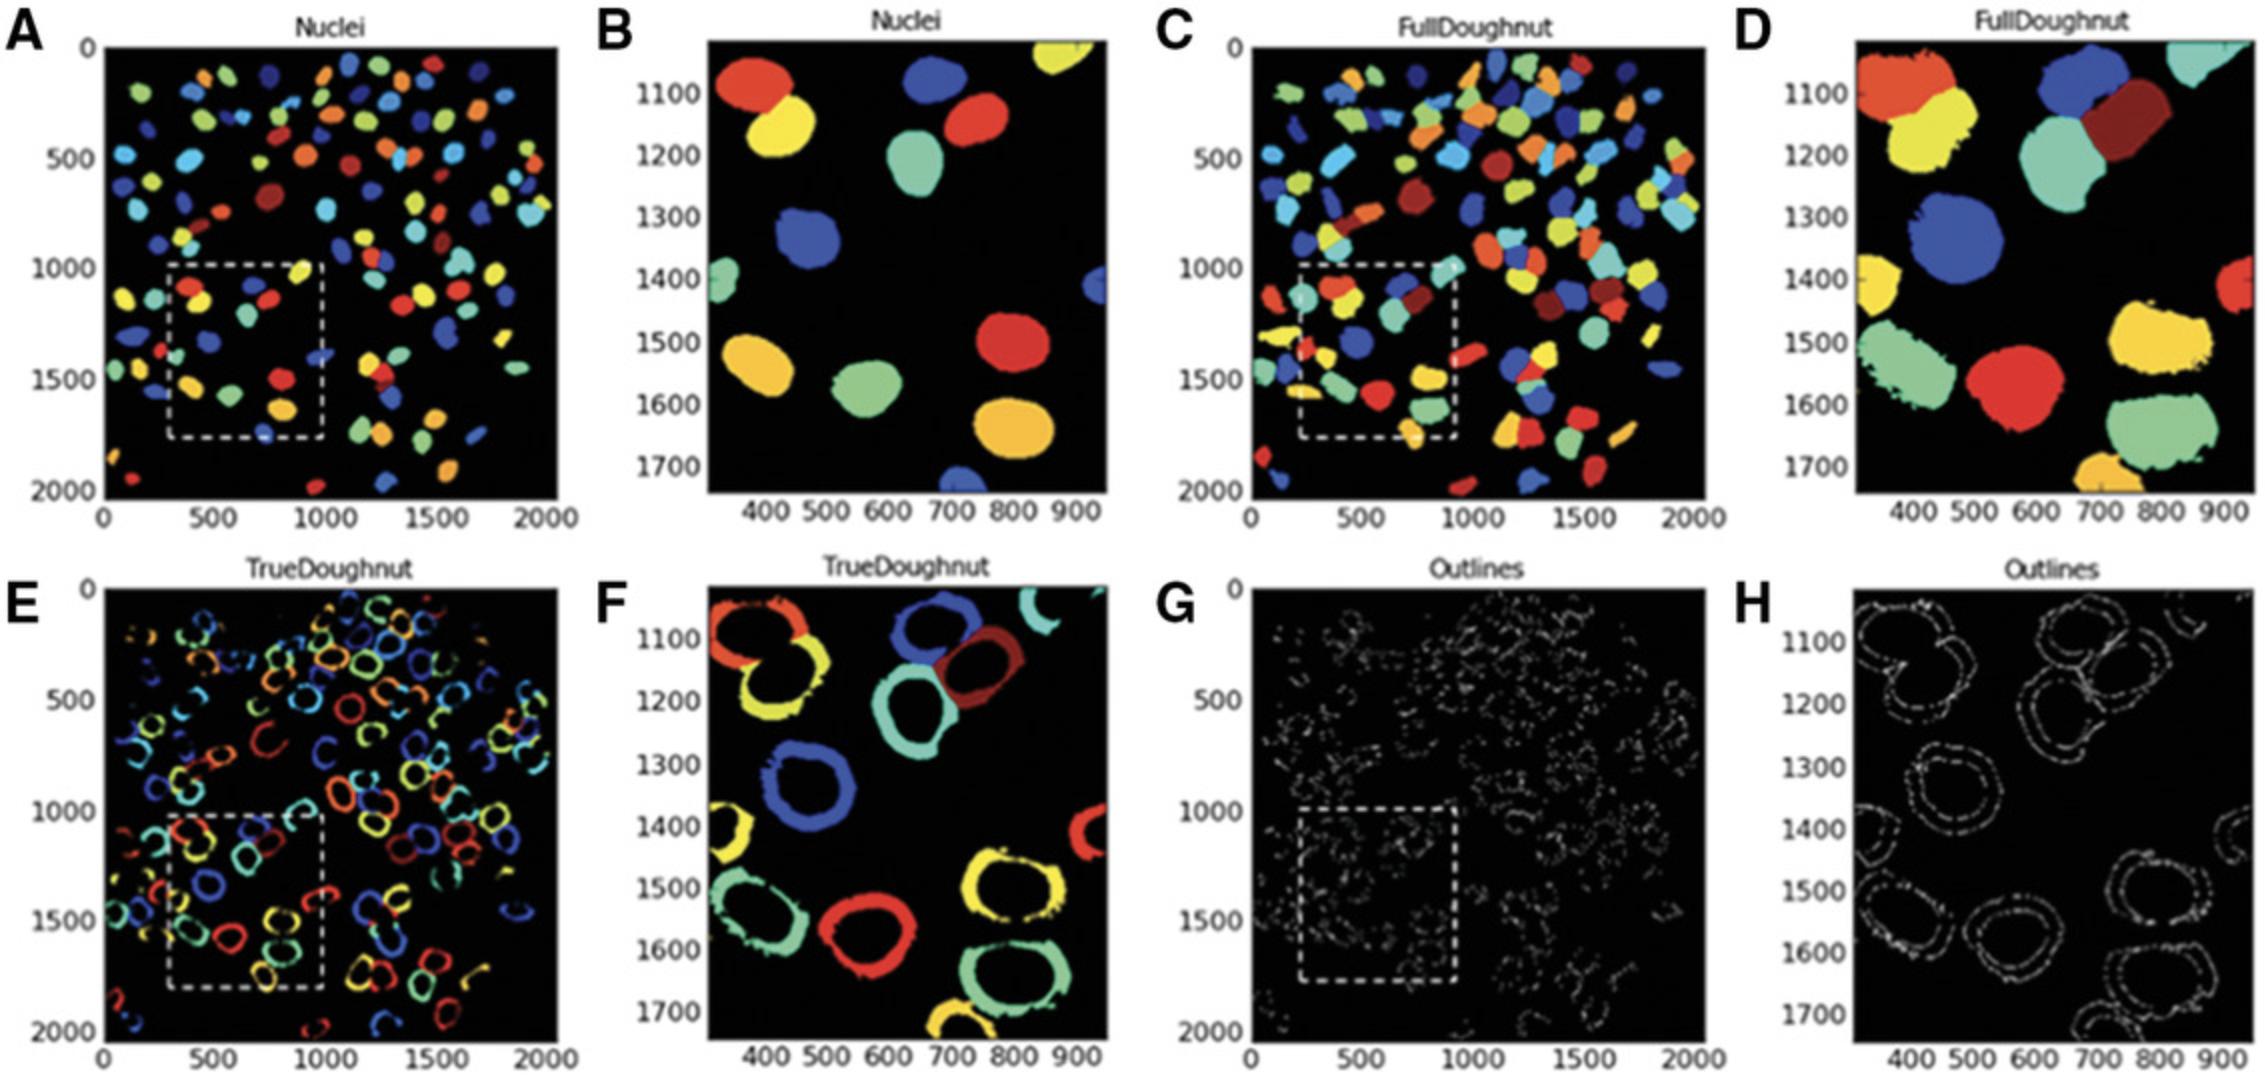
To expand nucleus and create ‘Full Doughnut’ shape:
18.Select > ‘Identify Secondary Object’ module.
19.Input > Illumination function corrected Cy3 image ‘’CorrCy3’.
20.Input (primary) objects > Select ‘Nuclei’. These were identified by Identify Primary Object module.
21.Insert the name of objects to be identified > ‘FullDoughnut’.
22.Select > ‘Distance- B’ as method to identify the secondary objects.
By selecting Distance as the method to identify the secondary objects (‘Full Doughnut’), the primary object (nucleus) is expanded to identify a ‘doughnut’ (or ‘annulus’)−shaped region in the cell, usually in the cytoplasm. CellProfiler provides two methods of identifying the secondary object. The first, ‘Distance-N’, does not utilize staining intensity in the image of the second stain, in this instance Cy3. This entails expanding the nucleus a set distance. However, this may include areas of image background as well as cell cytoplasm. Our protocol, on the other hand, utilizes the ‘Distance- B’ method. This second ‘Distance’ method expands the nucleus a set distance; however, this method uses the thresholding of the secondary staining image to eliminate background regions. Thus, the nucleus is only expanded into areas of foreground staining intensity to identify the ‘Full Doughnut’ secondary object without including background image regions.
23.Select > ‘Automatic’ threshold method.
24.Input > ‘25’ as number of pixels to expand the primary object (nucleus).
25.Fill holes > Select ‘Yes’.
26.Discard Objects touching the border of the image > Select ‘Yes’.
27.Retain outlines of the identified secondary objects > Select ‘No’.
The ‘Automatic’ thresholding method is the default setting in CellProfiler, and is robust. As this strategy is automatic, it does not allow users to select the threshold algorithm or to apply additional corrections to the threshold. The ‘Automatic’ strategy calculates the threshold using maximum correlation thresholding (MCT) for the whole image. The threshold is then applied to the image and smoothed using a Gaussian filter with a sigma of 1. The Gaussian filter method convolves the image with a Gaussian whose full width at half maximum is the artifact diameter entered. The effect of this is to blur features smaller than the entered artifact diameter and spread bright or dim features larger than the entered artifact diameter. The MCT method is described by Padmanabhan, Eddy, and Crowley (2010) as computationally efficient and accurate without relying on assumptions of the statistics of the image. This algorithm has been tried and tested on neuroscience images in the presence and absence of illumination correction to accurately aid in automated image analysis (Padmanabhan et al., 2010).
Identify tertiary objects: cell cytoplasm or true doughnut
Following the identification of the ‘Full Doughnuts’ (secondary objects), the Identify Tertiary Objects module is then used to remove the smaller objects (nuclei) from the larger secondary objects (Full Doughnuts) to leave a ring shape around the nucleus, referred to here as ‘True Doughnut’.
To identify tertiary objects (ring-shaped ‘True Doughnuts’):
28.Select > ‘Identify Tertiary Objects’ module.
29.Select > ‘FullDoughnut’ as larger identified objects (Output from Identify Secondary Object module).
30.Select > ‘Nuclei’ as smaller identified objects (Output from Identify Primary Object).
31.Select > ‘Yes’ to shrink smaller objects prior to subtraction.
Nuclei will now be subtracted from Full Doughnut area to produce a ring-shaped ‘True Doughnut’ in the peri-nuclear region of the identified SN4741 cells. By selecting ‘Yes’ to shrink the smaller object, the nucleus is shrunk by 1 pixel before subtracting the objects. This ensures that a tertiary object is produced. Measurements such as area and fluorescence intensity of the segmented area can be acquired subsequently.
Identify secondary objects: SN4741 cell body
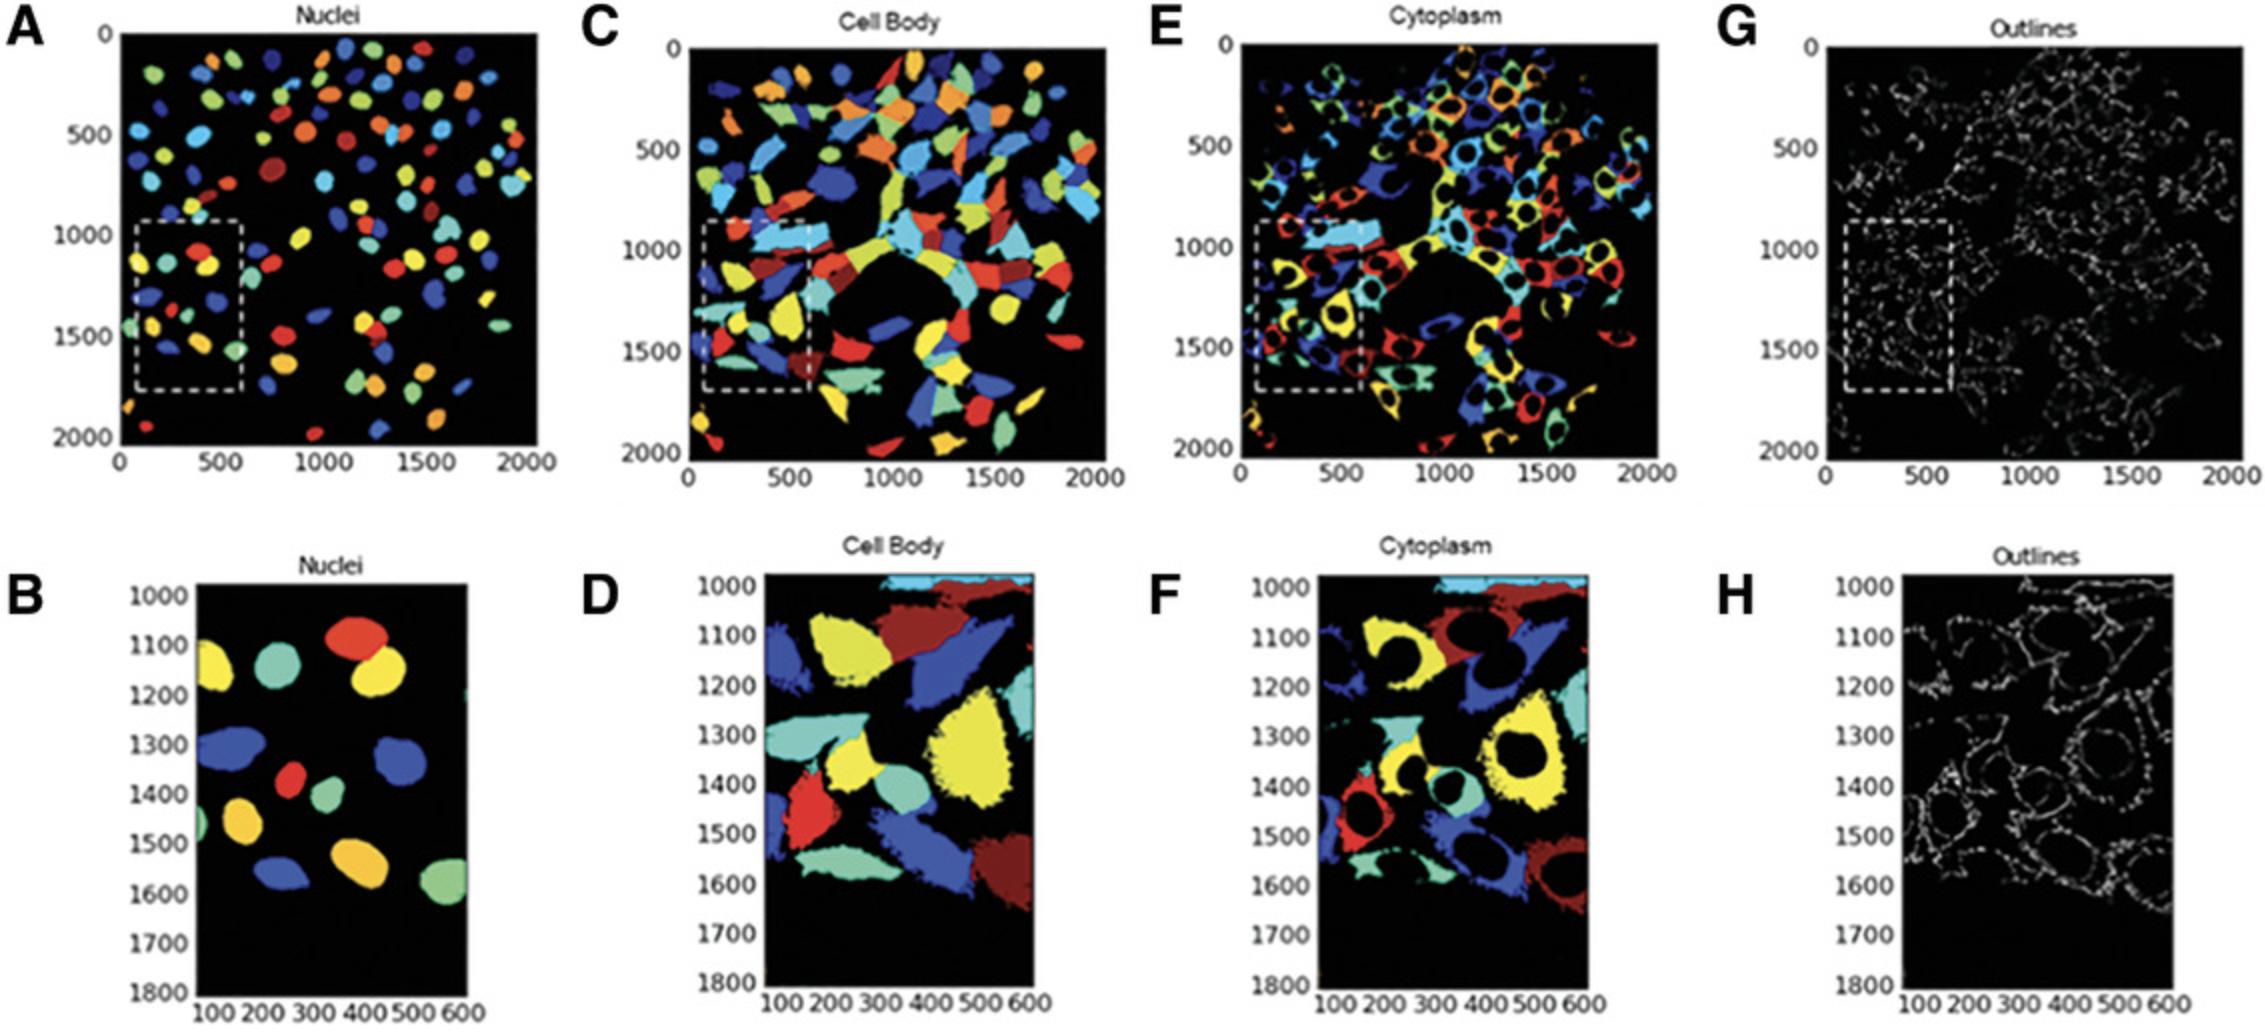
Following the identification of SN4741 nuclei using Identify Primary Object module, the Identify Secondary Object module is used again. However, this time the module and method must find the edge of SN4741 cell bodies as secondary objects using cell body−specific Cy3 staining intensity. Again, this module involves a thresholding step that assigns pixels in the input image to foreground and background. To identify cell body:
32.Select > ‘Identify Secondary Objects’ module.
33.Input Image > Selects ‘CorrCy3’.
34.Select > Input Objects ‘nuclei’ (identified in Identify Primary Object module).
35.Input > 'CellBody’ as name for identified objects.
36.Select > ‘Propagation’ as method to identify secondary objects.
37.Select > ‘Automatic’ as threshold method.
38.Input > ‘0.00’ as regularization factor.
39.Select > ‘No’ to fill holes in identified objects.
40.Select > ‘Yes’ to discard objects touching the image border.
41.Select > ‘Yes’ to discard associated primary objects.
42.Select > ‘No’ to retain the outlines of the identified secondary objects.
Identify tertiary objects: SN4741 cytoplasm
The Identify Tertiary Objects module subtracts the shape of the smaller object (nucleus) from that of the larger identified object (i.e., cell body). Once removed, the segmented area identified is the cell cytoplasm. See Figure 6.
To identify MitoHealth-stained SN4741 cytoplasm using CellProfiler modules:
43.Select > Identify Tertiary Objects module.
44.Select > ‘Cell Body’ as input for larger identified objects.
45.Select > ‘Nuclei’ as input for smaller identified objects.
46.Input > ‘Cytoplasm’ as name for tertiary objects to be identified.
47.Select > ‘Yes’ to shrink smaller object. This ensures that a cytoplasm is outlined around each nucleus.
48.Select > ‘No’ to retain outlines of tertiary objects, as these will not be utilized downstream.
See Figure 7.
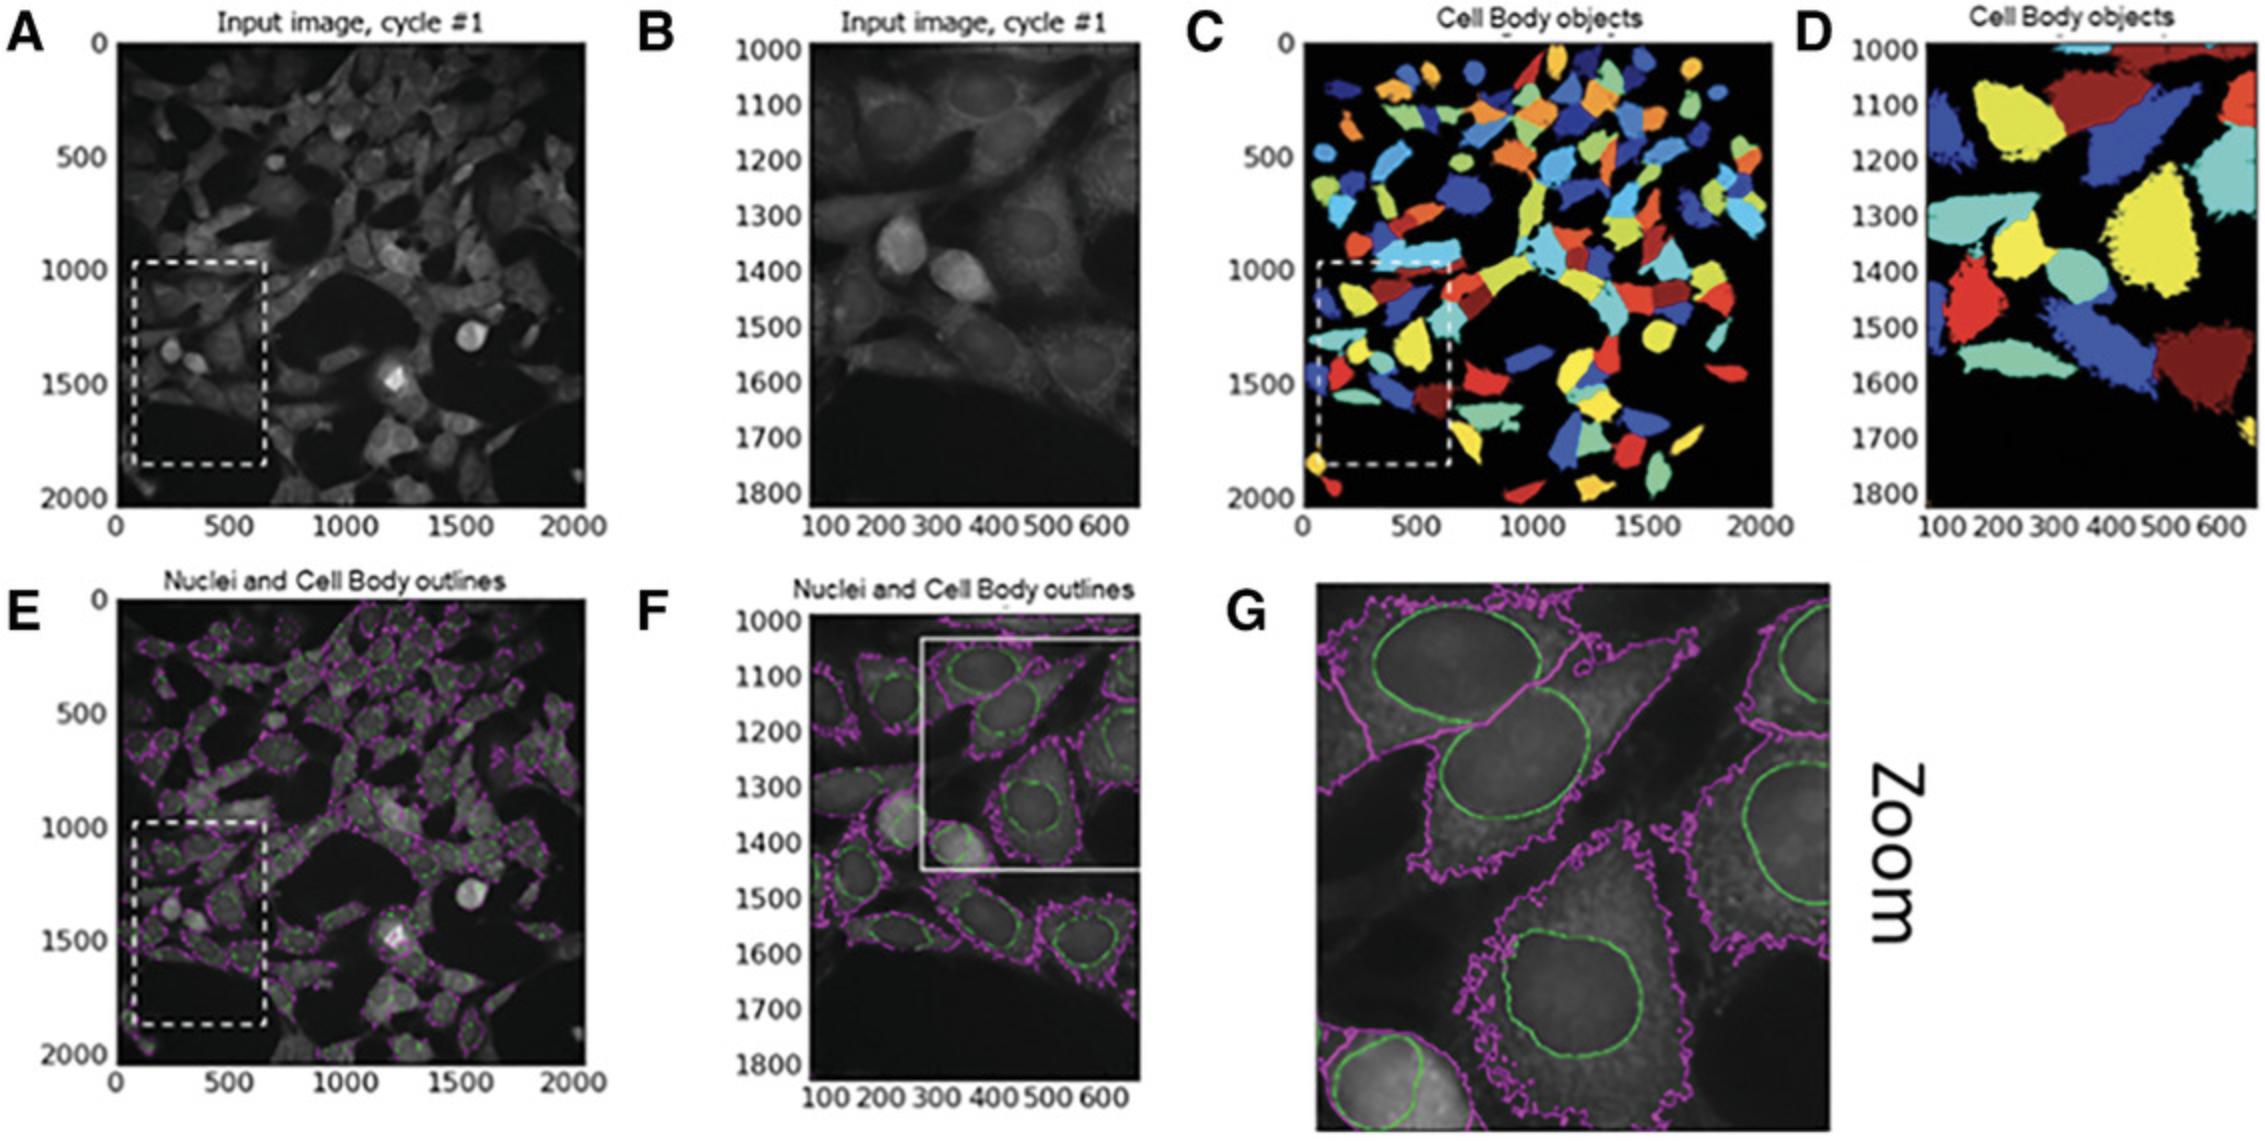
Enhance mitochondrial speckles
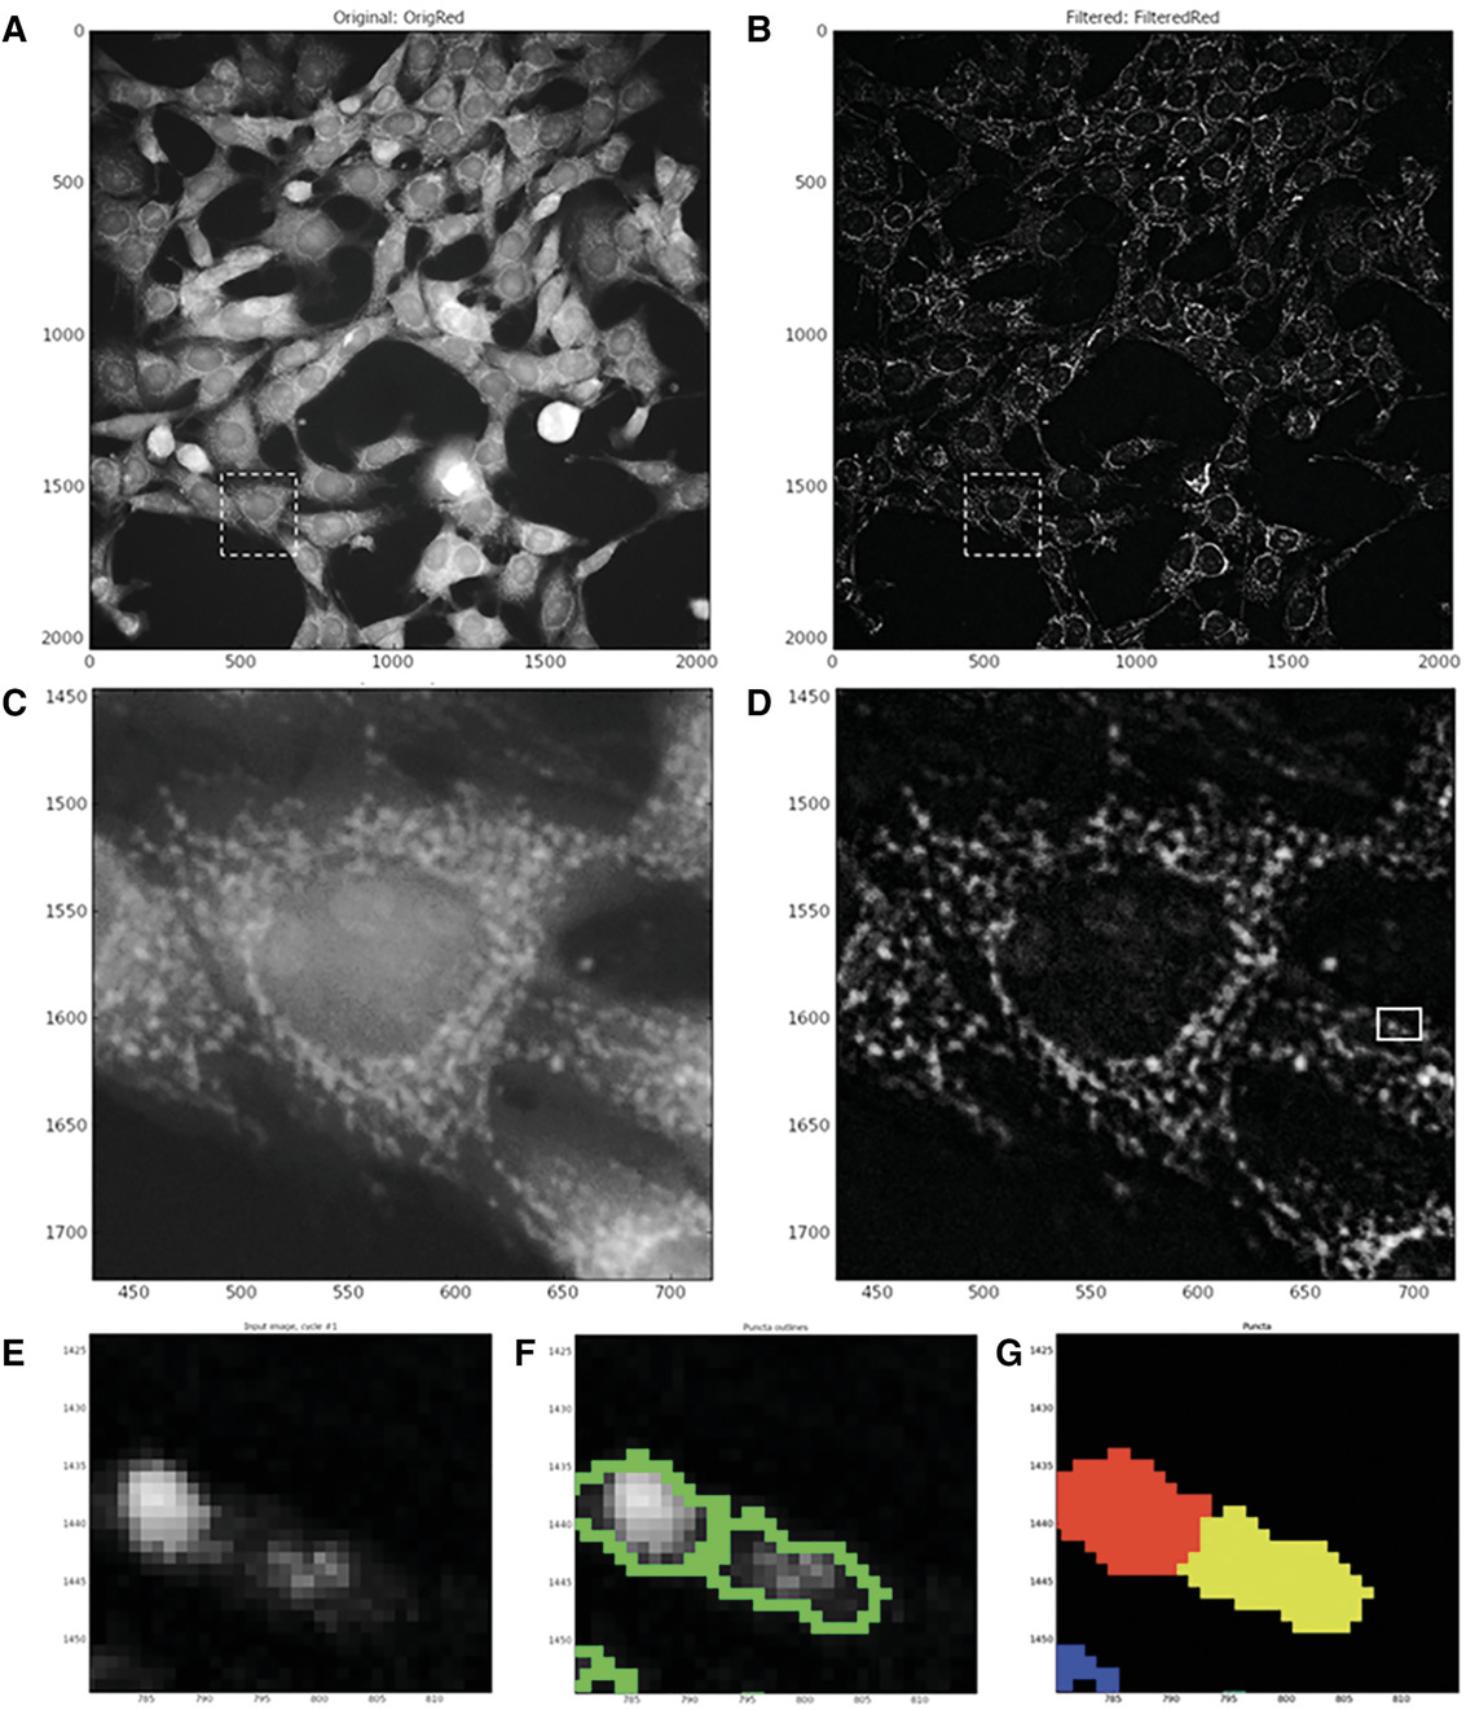
The Enhance or Suppress Feature module is a CellProfiler module that suppresses or enhances selected image features such as speckles, ring shapes, and neurites to improve the subsequent object identification by an ‘Identify’ module. In this case, it is used to enhance the punctate mitochondrial staining by applying image processing filters to the input image and giving a grayscale image output. Following the execution of this module, the ‘Identify Primary Object’ module is used again to identify mitochondrial puncta.
49.Select > ‘CorrCy3’ as input image (image is illumination function corrected).
50.Input > ‘FilteredRed’ (or other user-defined name) for output grayscale image.
51.Select > ‘Enhance’ as operation type.
52.Select > ‘Speckles’ as feature type to be ‘Enhanced’.
53.Input > ‘20’ as feature size.
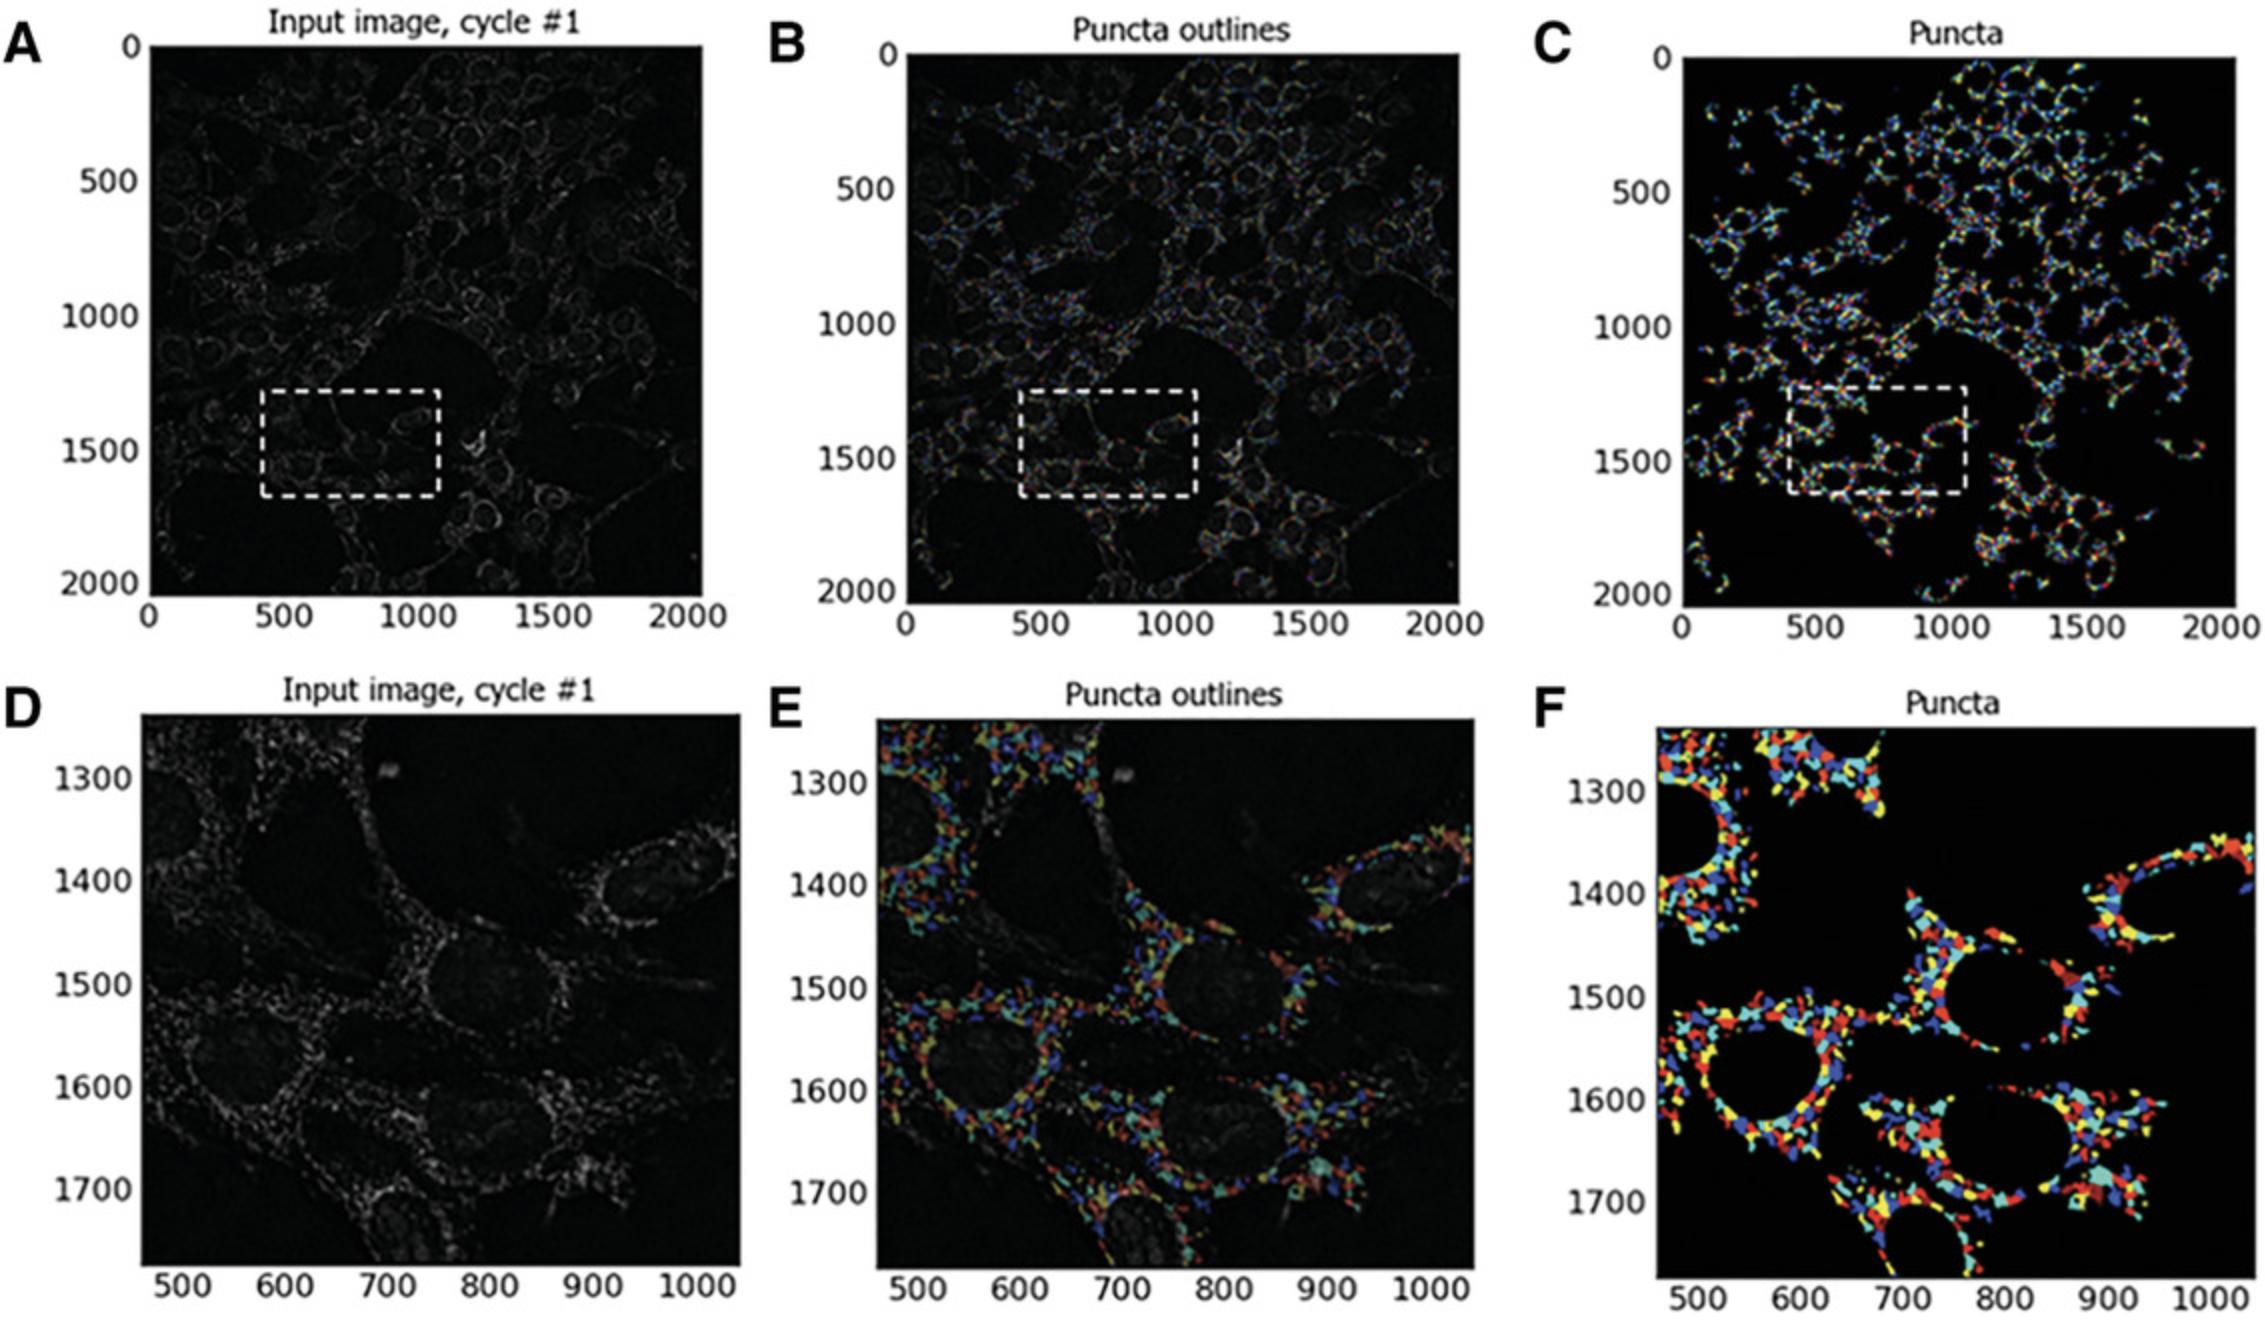
Identify primary objects: mitochondrial fragments (also see Fig. 8)
This step utilizes the Identify Primary Objects module to identify the mitochondrial puncta in the images enhanced in steps 49 to 53.To identify mitochondrial puncta in enhanced 40× objective Cy3-channel images of MitoHealth-stained SN4741 cells:
54.Select > Identify Primary Objects module.
55.Select > FilteredImage (output image from previous module) as input image.
56.Input > ‘Puncta’ (or other user-defined name) to assign to identified objects.
57.Select object diameter range > Min = 2; Max = 35.
58.Select > ‘Yes’ to discard objects outside the diameter range.
59.Select > ‘Yes’ to discard objects touching the border of the image.
60.Select > ‘Per Object’ as Thresholding strategy and ‘Otsu’ as thresholding method.
61.Select > ‘Cytoplasm’ (previously identified tertiary objects) as masking objects.
62.Select > ‘Three classes’ thresholding and minimize the ‘weight variance’.
63.Assign > Middle intensity pixels to ‘Foreground’.
64.Select > ‘Automatic’ smoothing method for thresholding.
65.Input > ‘1.0’ as Threshold correction factor with ‘0.001’ lower and ‘0.005’ as upper bounds on threshold.
66.Select > ‘No’ to automatically calculate size of smoothing filter for object de-clumping.
67.Input > ‘5’ as size of smoothing filter.
68.Select > ‘No’ to automatically calculate allowed distance between local intensity maxima.
69.Input > ‘5’ to suppress local maxima that are closer than this minimum allowed distance.
70.Select > ‘No’ to retain outlines of identified puncta.
71.Select > ‘Never’ to fill holes in identified objects.
72.Select > ‘Continue’ for handling of an excessive number of identified objects, as puncta are small, and therefore the number of puncta identified per image is usually high.
See Fig. 9.At this stage in the construction of the CellProfiler analysis pipeline, we have identified nuclei, cell body, mitochondrial fragments, cytoplasmic areas, and peri-nuclear regions. Now that these cellular compartments have been identified using this CellProfiler pipeline, we must select which measurements and data to extract from our digital images using a set of measurement modules.
Measure object size and shape
Although the Measure Object Size and Shape module can measure a vast array of shape and area features, we use this module to measure object size (area in pixels) of each cells’ mitochondrial puncta, cytoplasm, and true doughnut with respect to the CellProfiler pipeline.
To measure size and shape of object using Measure Object Size and Shape :
73.Select > Measure Object Size and Shape module.
74.Select > ‘Cytoplasm’, ‘Puncta’, or ‘True Doughnut’, or any combination of identified objects.
Specific shape or size measurements (e.g., area) to output into a spreadsheet are defined in a later module. This module simply selects which objects the measurements should be taken from.
Measure object intensity: true doughnut or cytoplasm
To measure the intensity of identified objects, we use the Measure Object Intensity CellProfiler module. To do so:
75.Select > ‘CorrCy3’ illumination corrected image as image to measure.
76.Select > ‘True Doughnut’ or ‘Cytoplasm’ (or other object) identified in previous modules to measure.
A CorrCy3 image, as opposed to a Raw Image, is selected to acquire intensity measurements, as this image previously undergoes illumination correction during the pre-processing stage. Specific object intensity measurements (e.g., mean, median, minimum, maximum intensity) to output into a spreadsheet are defined in a later module. This module simply selects which objects the measurements should be taken from.
Relate objects: assign mitochondrial fragments to cell cytoplasm
The Relate Objects CellProfiler module is used here to assign a relationship between ‘child’ objects (e.g., puncta) and ‘parent’ objects (e.g., cytoplasm). This module can be utilized in order to count the number of puncta per SN4741 cell cytoplasm and calculate a mean measurement value for all ‘child’ objects that are associated with each ‘parent’ object. Objects (e.g., mitochondrial puncta) are considered ‘children’ of a ‘parent’ object (e.g., a cell cytoplasm) if the ‘child’ object is found within or at the edge of a ‘parent’ object. To assign the relationship between mitochondrial puncta and a cell cytoplasm:
77.Select > ‘Puncta’ as input child objects (identified in second Identify Primary Objects module).
78.Select > ‘Cytoplasm’ as input parent objects (Identified in Identify Tertiary Objects module).
Mask objects to relate puncta to cytoplasm of origin
The Mask Objects module hides regions of the input that are not regions of interest. This aids in the assignment of puncta to a cell cytoplasm of interest and allows for cell-by-cell puncta counts. In this example, only SN4741 cell cytoplasm is selected as a region of interest, and subsequently aids in exporting the Parent-Child (Cytoplasm- Puncta) data in the Export to Spreadsheet module that follows. To create a mask from previously identified objects (i.e., cytoplasm):
79.Select > ‘Filtered Red’ (the output of Enhance or Suppress Features module) as input image.
80.Input > ‘Mask Red’ as (user defined) name for output image.
81.Select > ‘Objects’ and ‘Cytoplasm’ to select object (cytoplasm) for mask.
82.Select > ‘No’ to invert mask to ensure mask is produced from the foreground area within the masking objects (cytoplasm).
Export to spreadsheet: output data into MS Excel spreadsheet
The final module in these CellProfiler protocols is the Export to Spreadsheet. Here, we assign a folder/file destination and name for the output data.
83.Select > ‘Elsewhere’ and then ‘browse’ for desired output file location.
84.Select > ‘Yes’ to add prefix to file output file name.
85.Input > ‘Name’ (user-defined) prefix for output filename (e.g., MitoMMP or MitoPuncta).
86.Select > ‘No’ to overwrite without warning (does not affect protocol—decided by end user).
87.Select > ‘No’ to add metadata columns to object data file (does not affect protocol).
88.Select > ‘Yes’ to limit output to a size that allowed in Excel. If ‘No’ is selected, then upon exceeding the limit on the Excel spreadsheet, the pipeline will be terminated without data outputted.
89.Select > ‘NaN’ to represent data points that are numerical values as ‘infinite’ or ‘undefined’ in the output spreadsheet.
90.Select > ‘Yes’ to select the measurements to export. The user can define which data are outputted to spreadsheet. By selecting ‘No’, all data types will be outputted.
91.Select the following data outputs from the ‘select measurement to export’ drop-down box.
92.To export number of nuclei (cell count) and puncta per image :
- Image > Count > Nuclei
- Image > Count > puncta.
93.To export area of the objects true doughnut and cytoplasm :
- True Doughnut > Area Shape > Area
- Cytoplasm > Area Shape > Area.
94.To export intensity of MitoHealth staining intensity in SN4741 peri-nuclear area :
- True Doughnut > Intensity > Mean Intensity.
95.To export cell-by-cell puncta counts :
- Cytoplasm > Children > Puncta > Count.
- Select > ‘Yes’ to calculate the per-image mean values for object measurement. CellProfiler will calculate mean intensity, mean area, mean number of puncta per cell, etc., for each image, which will then be exported into the spreadsheet. Median and standard deviation measurements per image can also be calculated if desired.
- File > Save Project As > input user defined project name. This saves the CellProfiler image-analysis pipeline for future use.
The CellProfiler protocol can now be opened and used on image set.
96.To allow modules to run in sequence in an automated fashion, select:
File > Analyze Images. A spreadsheet will be populated and saved as an output upon termination of all executable algorithms/modules in the CellProfiler pipeline. This pipeline can be applied to experimental repeats.
Once these CellProfiler pipelines (CellProfiler Pipeline: Measuring Mitochondrial Membrane Potential; and CellProfiler Pipeline: Measure SN4741 Mitochondrial Fragmentation) have been constructed, it is then possible to automate image analysis for hundreds or thousands of image
Table 2 contains the names and functions of the CellProfiler algorithm modules used in the above protocol(s).
| CellProfiler module | Function |
|---|---|
| Correct illumination calculate | Calculates an illumination function that is used to correct uneven illumination/lighting/shading, or to reduce uneven background in images |
| Correct illumination apply | Applies an illumination function, usually created by Correct Illumination Calculate, to an image to correct for uneven illumination (uneven shading) |
| Identify primary objects | Identifies biological components of interest in grayscale images containing bright objects on a dark background (e.g., nuclei or speckles) |
| Identify secondary objects | Identifies objects (e.g., cell body) using objects identified by another module (e.g., nuclei) as a starting point, or seed |
| Identify tertiary objects | Identifies tertiary objects (e.g., cytoplasm) by removing smaller primary objects (e.g., nuclei) from larger secondary objects (e.g., cell body), leaving a ring shape |
| Enhance or suppress features | Enhances or suppresses certain image features (e.g., speckles, ring shapes, and neurites), which can improve subsequent identification of objects (such as mitochondrial fragments) |
| Measure object size and shape | Measures several area and shape features of identified objects |
| Measure object intensity | Measures several intensity features for identified objects |
| Relate objects | Assigns relationships; all objects (e.g., speckles) within a parent object (e.g., nucleus) become its children |
| Export to spreadsheet | Exports measurements into one or more files that can be opened in Excel or other spreadsheet programs |
REAGENTS AND SOLUTIONS
SN4741 cell culture medium
- 425 ml Dulbecco's Modified Eagle Medium (DMEM; high-glucose (4.5 g/L), without sodium pyruvate (Invitrogen, cat. no. 41965-039), supplemented with:
- 50 ml (10% final) heat-inactivated fetal bovine serum (FBS; Invitrogen, cat. no. 10106169)
- 5 ml 100× (1× final) penicillin/streptomycin (pen/strep; Gibco, cat. no. 15140122)
- 5 ml 100× (1× final) l-glutamine (Gibco, cat. no. 25030081)
- 15 ml 20% glucose (BioUltra for molecular biology; Sigma, cat. no. 49163-100 ml)
- Filter sterilize using a 0.22-µm filter
- Store up to 3-4 weeks at 4°C
COMMENTARY
Background Information
The in vitro rotenone assay described here is a 2D model with 2D image acquisition. We recognize that that 3D culture of neuronal spheroids and organoids may be more physiologically relevant for studying neurodegenerative disease and modeling cellular interactions within the human brain (Chlebanowska, Tejchman, Sułkowski, Skrzypek, & Majka, 2020). In our laboratory, we sought to develop an easily reproducible and resource-efficient method to screen multiple compounds for their potential neuroprotective effects in models of PD using readily available equipment, skills, and resources. We also recognize the importance of the use of live-cell imaging techniques and approaches to answer key questions regarding the mechanisms or potential treatments of neurodegenerative diseases (Bakota & Brandt, 2009). In our procedure, described in this article, we utilize paraformaldehyde fixation to immortalize the phenotype/morphology under investigation. To this end, we use fluorescence probes that are compatible with the PFA fixation process. Fixation of our sample also allows for the option of multiplexing with antibody immunocytochemistry. In Basic Protocols 1 and 2, we present a simple, easily replicable step-by-step guide to executing the procedure. Additional considerations and troubleshooting notes are presented in the sections below.
Critical Parameters
Basic Protocol 1
Selection of an appropriate exposure time
Prior to image acquisition, ensure that an effort is made to select the optimal exposure time, as this will avoid saturation and a lack of dynamic range in the image acquired. To minimize the potential for image saturation: (i) maintain image acquisition conditions such as exposure times, lamp, and filters used, etc., throughout the image-acquisition process; (ii) allow sufficient time for the light source (lamp) to warm-up before running samples, to avoid overexposure as lamp warms; an LED provides more consistency, so use this as light source if possible; (iii) aim to quantitatively compare signals across the set of images to ensure that image pixel intensities do not become saturated due to increased fluorescence signal that may result from particular treatment regimens—for example positive experimental controls. To mitigate this, aim to set the exposure time such that the resulting images use as much of the dynamic range of the camera as possible, but without saturating any images. For example, setting the image maximum to be ∼50%-75% of the dynamic range is a good precaution, and will allow for some images in the set being brighter than average without becoming saturated (Brown, 2007).
Basic Protocol 2
Uploading image set, image sorting, image pre-processing, and illumination correction
A limitation of many high-content screening (HCS) platforms, such as the InCell Analyzer 2000, is that a flat-field correction (FFC) function cannot easily be implemented in the imaging process. There is the option to modify the images taken during a post-processing stage; however, this leaves the quality control of the FFC to the imaging software, without any further input or quality control from the end user. Without an FFC application, we can see that the intensity of an image varies widely from the center to its edges (illustrated in Fig. 3). This spread of illumination intensity within an image will degrade the accuracy of downstream image analysis. For example, regions of a cell body may appear shaded, and therefore segmentation of the image into biologically relevant compartments (i.e., identification of cell body boundary) may be prevented.
The illumination pattern will change if different staining reagent(s) are used for a batch of samples or if there is a change in microscope components or setting of the optical path. For example, the illumination pattern may change throughout the same day or analysis as the lamp changes temperature. Therefore, in this protocol, illumination is measured and correction applied for each image channel, i.e., Hoechst and Cy3. This illumination pattern must be corrected to ensure accurate and comparable measurements in intra- and inter-image analysis. CellProfiler software has built-in modules to deal with these issues. The Correct Illumination Calculate module is used to measure the intensity pattern of a single or set of images, and produces an intensity function which is to be applied across the entire image set. The Correct Illumination Apply module then applies the calculated intensity function to the images prior to analysis. Correction of intensities can be important for segmentation and intensity measurement functions. In this method of illumination correction, we create and save an illumination function and apply this correction to images before segmentation. This can be performed using a separate CellProfiler pipeline to create an ‘average’ illumination function for a specific fluorescence channel in a data set. Alternatively, as it is performed in this instance, the pre-processing (illumination correction) can be implemented at the start of an image analysis pipeline. This illumination function is saved as an image and is applied to the entire data set. The drawback of implementing illumination correction as part of a working pipeline, especially when dealing with large quantities of image files, is that calculation of the illumination function can add a considerable amount of time to the automated analysis process (Lindblad & Bengtsson, 2001).
Identification of nuclei
See ‘In vitro rotenone assay: cell density’ in Troubleshooting for considerations.
Identifying secondary objects: SN4741 cell body
Abnormal fragmentation of mitochondria is a trait observed in cells derived from patients afflicted with neurodegenerative diseases such as PD (Pieczenik & Neustadt, 2007). Pesticides such as rotenone are commonly used to generate PD models. In in vivo rat models, systemic exposure to rotenone induces neurochemical, behavioral, and neuropathological features of PD (Betarbet et al., 2000). These PD-like features include nigrostriatal dopaminergic degeneration, which is associated with the behavioral traits of hypokinesia and rigidity. The systemic exposure to rotenone in this rat model also results in other PD-associated neurochemical hallmarks such as the accumulation of ubiquitin- and α-synuclein-containing cytoplasmic inclusions (Betarbet et al., 2000). Moreover, evidence shows that cells exposed to rotenone, a mitochondrial electron transport chain (ETC) complex-I inhibitor, display a fragmented mitochondrial morphology in vitro. This effect appears to be dependent on the metabolic energy sensor AMPK (Toyama et al., 2016).
Here, we describe a protocol that allows for identification of whole mitochondria in the SN4741 cell body and subsequent quantification of mitochondrial fragments and measurement of fragment size. This CellProfiler pipeline utilizes aspects of the CellProfiler ‘Speckle Counting’ example pipeline, with alterations to complement the analysis of SN4741 cells for mitochondrial fragments. The basic pipeline is similar to that described above; however, there are adjustments at (i) step 42, as CellProfiler software is tweaked to identify SN4741 cell body; and (ii) step 48, as the edges of the entire SN4741 cell cytoplasm are identified as opposed to only the ring-shaped ‘True Doughnut’ in the peri-nuclear region of the cell. Alterations are described in a step-by-step method below. During step 36, note that this module uses ‘propagation’ as the method to identify dividing lines between clumped cell bodies (secondary objects) where there is a local change in staining intensity (i.e., cell bodies have different staining intensities, and foreground and background have different staining intensities). This algorithm varies from the watershed method (used in the ImageJ macro), as the dividing lines between objects (cell bodies) are determined by both the changes in local image intensity (intensity gradient) and distance to the nearest primary object (nucleus). Dividing lines are placed where the image local intensity changes perpendicularly to the boundary (Jones, Carpenter, & Golland, 2005). Therefore, this method is considered an improved method of object segmentation. Since ‘propagation’ is selected, a user-defined regularization factor (given the symbol λ) must be input to inform the execution of the propagation algorithm. Propagation takes (1) the distance to nearest primary object and (2) intensity of the secondary object image into account when defining the dividing lines between objects. The regularization factor is used to decide the balance and weight placed on each factor during propagation, and can be anywhere in the range from 0 to infinity. If a regularization value >1 is selected, the image intensity is almost completely ignored, while selecting a regularization value of 0 means that the distance to the nearest primary object is ignored and propagation relies on image intensity. The larger the regularization value, the more image intensity is ignored, and dividing lines drawn become more reliant on distance to the nearest primary object.
Enhancing mitochondrial speckles
During this step, the enhance operation is used to create an output image which predominantly contains user-defined features. In this pipeline, the module produces a grayscale image largely composed of mitochondrial puncta. Feature size is determined by measurement of mitochondrial puncta using the Tools > Measure length CellProfiler function. CellProfiler suggests that when enhancing (or subtracting), the largest feature size in the image should be selected. In these MitoHealth images, the largest mitochondrial puncta measured were approximately 20 pixels in diameter. Speckle feature type was selected to enhance mitochondrial puncta in each image. CellProfiler defines a speckle as an area of enhanced pixel intensity relative to its immediate neighborhood using a “tophat” filter. This filter uses grayscale image erosion within a set radius (approximate object diameter = 20 pixels; therefore, radius = 10 pixels), and then dilation. The speckles are enhanced by this module, making them easier to identify with the Identify Primary Object module. See Figure 9E-G for an example of identified puncta.
Identifying mitochondrial fragments as primary objects
In identifying mitochondrial fragments in step 60, we use a “Per object” thresholding strategy, which relies on the identification of a cellular compartment in a previous CellProfiler module. In this example, SN4741 cell ‘Cytoplasm’ is identified by the Identify Tertiary Object module. Using this strategy means each individual cell cytoplasm has its own applied threshold. Pixels outside of the object are considered background. CellProfiler suggests this as a useful method for identifying particles in cellular sub-compartments if staining varies between objects/cell-to-cell. The Otsu method of thresholding (named after Nobuyuki Otsu) calculates image threshold by minimizing the variance within the pixels that are considered to be classed and assigned to foreground or background (Otsu, 1979; Sankur, 2004). CellProfiler's application of Otsu thresholding method can be applied to assign pixels to either two classes (foreground and background), or three classes (foreground, mid-ground, and background). In our pipeline, two class' is selected for Otsu thresholding. The reason for this is that the foreground pixels (regions of interest, i.e., puncta) and background pixels are easily distinguishable following execution of the Enhance or Suppress Feature' module as described in `Enhance mitochondrial speckles' in Basic Protocol 2.
Troubleshooting
In vitro rotenone assay: cell density
Basic Protocol 1 describes the seeding of 3000 cells in each treatment well. SN4741 cells under the described culture conditions have a cell doubling time of approximately 23 hr. The timeline from cell seeding to experimental endpoint is 72 hr. Seeding 3000 cells per well results in a cell density at the experimental endpoint of approximately 80%, thus, avoiding over-confluent cell density. Over-confluent cells at the experimental endpoint mean that downstream image analysis will be difficult and can result in inaccuracies in image segmentation—specifically nuclear segmentation, where the goal is to identify discrete nuclei to build and execute subsequent image-analysis steps. Misidentification of nuclei may result in repercussions for the subsequent image-analysis steps and inaccuracies in data measurement. See `Identification of nuclei' in Basic Protocol 2 for nuclei segmentation.
In vitro rotenone assay: rotenone efficacy
On occasion, we have observed a loss of efficacy of rotenone, resulting in non-significant loss of SN4741 neurons following 24-hr challenge. In order to avoid this, the reconstituted rotenone (in DMSO) is stored at −4°C protected from light and air using parafilm or tape to seal aliquots. We recommend aliquotting small volumes (10 µl) of rotenone for storage, and subjecting aliquots to a maximum of 2-3 freeze-thaw cycles. There is also a possibility that rotenone will fall out of aqueous solution containing DMSO during the freeze-thaw cycle. In light of this, we highly recommend through mixing of rotenone aliquots by vortexing prior to use.
Sample storage considerations
Due to unforeseen circumstances, it might not be possible to acquire images of samples immediately following the staining procedure, as recommended by manufacturers. Should this problem arise, place samples in a cold room (4°C) overnight and protect from light; should the sample need to be kept longer, Prolong GoldTM (Invitrogen, cat no. P36930) should be used according to the manufacturer's instructions to retain sample fluorescence integrity. The samples should be protected from light and stored at 4°C. Ensure that the sample plate is left to acclimatize to room temperature prior to imaging, to avoid condensation.
Data storage considerations
Images (.tiff, 16-bit) acquired using the automated fluorescence microscopy system are saved to an external hard drive. Each .tiff image acquired in the protocol requires approximately 8 MB of storage. The main consideration here is ensuring that the storage device has sufficient storage capacity for experimental setup.
PPE and COSHH considerations
Rotenone and PFA pose a hazard to human health and will need to be disposed of appropriately. Relevant good laboratory practice as well as PPE and COSHH guidelines must be adhered to when handling these chemicals and compounds. In light of this, appropriate risk assessments should be performed and approved by the organization's Health & Safety committee.
Additional applications for image: analysis pipeline
The simplicity of this protocol means that it is easily adapted to the identification and quantification of other sub-cellular organelles. An example of such applications includes identification of fluorescently labeled lysosomes and autophagosomes from 2D images acquired through HCI in the analysis of autophagy. The laboratory has found use for this pipeline in a myriad of cell types, including HT-22 Mouse Hippocampal Neuronal Cell Line (Sigma-Aldrich cat. no. SCC129) and ReNcell® VM Human Neural Progenitor Cell Line (Sigma-Aldrich, SCC008), SN4741, and differentiated and undifferentiated human ReN cells, with slight modification of parameters such as ‘typical nucleus diameter’ in the identify primary objects module.
Statistical Analysis
Software for statistical analysis
The terminating step in the CellProfiler pipeline is exporting measurements and data. In this protocol, data are exported as comma-separated value (.csv) files, which can be opened in MS Excel. Graphing and biostatistics can be performed in MS Excel or other commercially available software such as GraphPad Prism or MATLAB. Statistical analysis of mean puncta number per cell, mean fluorescence intensity per cell, and cell number has been performed by one-way ANOVA with Dunnett's post-hoc analysis, with P < 0.05 (), P < 0.01 (), P < 0.001 () considered significant when compared to control (0 nM Rotenone).
Understanding Results
Below is example of the data resulting from the application of this step-by-step protocol and subsequent analysis using GraphPad Prism software. This includes representative images of Control, 10 nM rotenone, and DMSO-challenged SN4741 cells as described in Basic Protocol 1. We illustrate data from n = 3 study replicates of this experimental procedure, with treatments conducted in triplicate wells for each experimental study that is run. In addition, we include cytotoxicity and cell viability data in Figure 10B and 10D, respectively, to illustrate the effects of rotenone concentration on SN4741. Results are described in more detail in the legend of Figure 10 (panels A-G). Following 24-hr rotenone challenge, we see a decreased SN4741 cell number as well as decreased cell viability and MitoHealth staining intensity; additionally, increased mitochondrial fragmentation and cell cytotoxicity versus control (0 nM rotenone) treatment are observed
Time Considerations
An outline of experimental procedure and associated timelines for Basic Protocols 1 and 2 can be seen in Figure 11. Figure 12 illustrates the experimental timeline of the in vitro rotenone PD model.
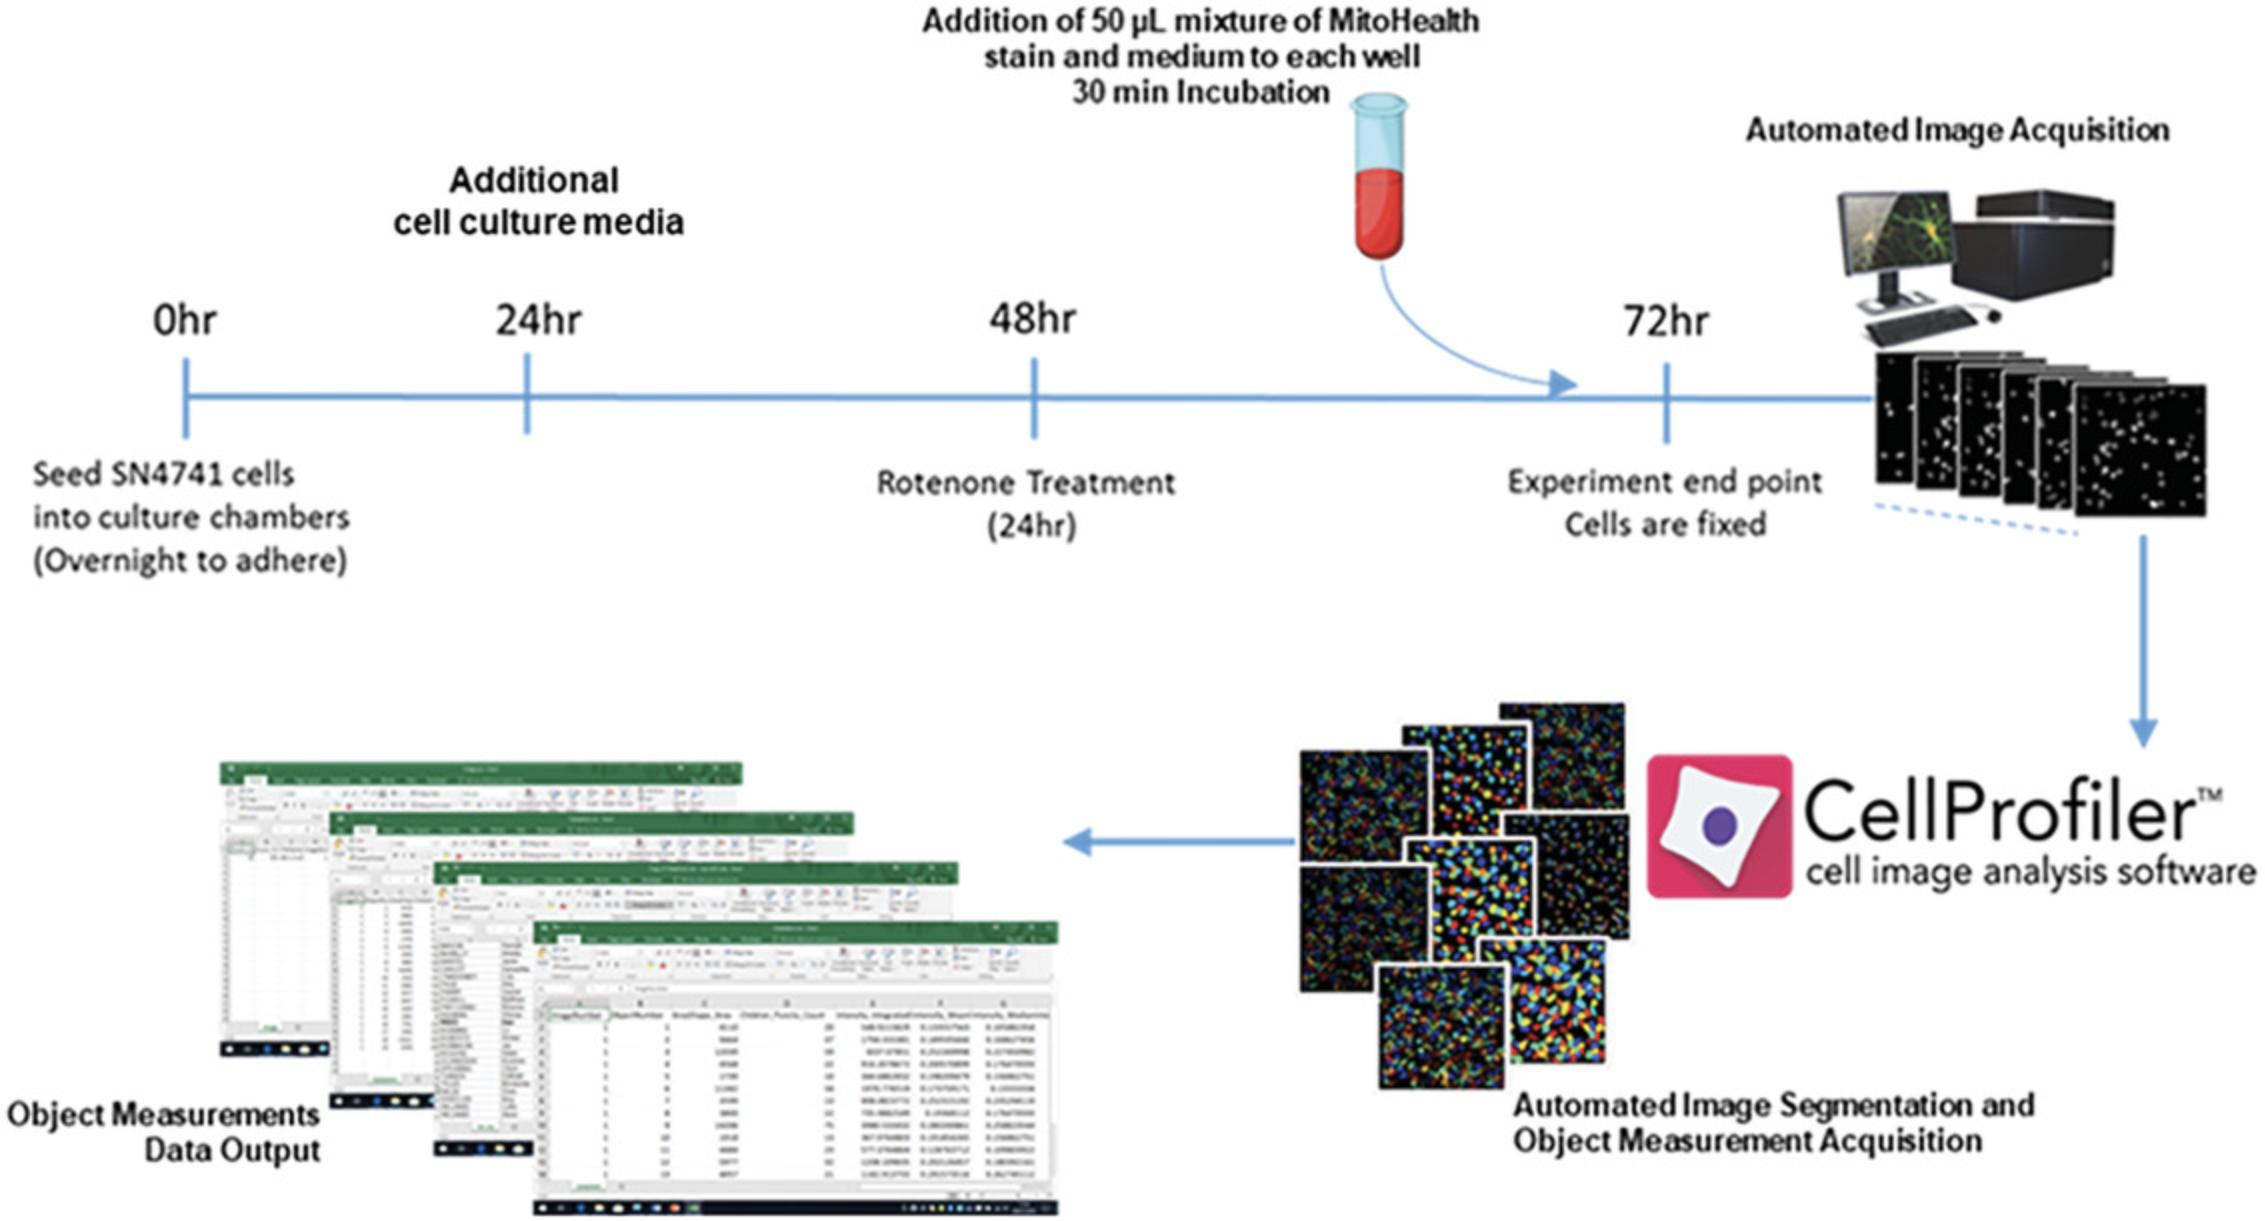

Another consideration is estimated run time on each image set (1 DAPI image and 1 Cy3 Image). This CellProfiler pipeline typically takes 1-1.5 min. Run time for 10 image sets (10 DAPI and 10 Cy3 images) is approximately 14 min with step-by-step display in CellProfiler software enabled, and 9.5 min with display disabled. Run time for 52 images is approximately 1 hr, 5 min, with display, and 48 min without display. Display can be toggled on/off for each module on the CellProfiler software pipeline panel. Run times represent those achieved using a Toshiba TECRA A50-C-218 with Inter(R) CoreTM i7-6500U CPU @2.5 GHz to run this image analysis protocol. Run time will be quicker on laptops or desktop computers with additional RAM and CPU.
Acknowledgments
This work was funded by grants from the Medical Research Council (Grant no. G0902250), Parkinson's UK, St David's Medical Foundation, Coleg Cymraeg Cenedlaethol PhD Studentship, and a BRACE PhD Studentship.
Author Contributions
Daniel J. Rees : Conceptualization; data curation; formal analysis; methodology; supervision; writing-original draft; writing-review & editing. Luke Roberts : Conceptualization; investigation; writing-review & editing. M. Carla Carisi : Conceptualization; writing-review & editing. Alwena H. Morgan : Writing-review & editing. M. Rowan Brown : Conceptualization; investigation; methodology; supervision; writing-review & editing. Jeffrey S. Davies : Conceptualization; formal analysis; investigation; resources; supervision; writing-review & editing.
Literature Cited
- Bakota, L., & Brandt, R. (2009). Live-cell imaging in the study of neurodegeneration. International Review of Cell and Molecular Biology , 276, 49−103. doi: 10.1016/S1937-6448(09)76002-2.
- Betarbet, R., Sherer, T. B., MacKenzie, G., Garcia-Osuna, M., Panov, A. V., & Greenamyre, J. T. (2000). Chronic systemic pesticide exposure reproduces features of Parkinson's disease. Nature Neuroscience , 3(12), 1301–1306. doi: 10.1038/81834.
- Brown, C. M. (2007). Fluorescence microscopy—avoiding the pitfalls. Journal of Cell Science , 120(10), 1703–1705. doi: 10.1242/jcs.03433.
- Chlebanowska, P., Tejchman, A., Sułkowski, M., Skrzypek, K., & Majka, M. (2020). Use of 3D organoids as a model to study idiopathic form of Parkinson's disease. International Journal of Molecular Sciences , 21(3), 694. doi: 10.3390/ijms21030694.
- Elmore, S. P., Nishimura, Y., Qian, T., Herman, B., & Lemasters, J. J. (2004). Discrimination of depolarized from polarized mitochondria by confocal fluorescence resonance energy transfer. Archives of Biochemistry and Biophysics , 422(2), 145–152. doi: 10.1016/j.abb.2003.12.031.
- Fishman-Jacob, T., Reznichenko, L., Youdim, M. B. H., & Mandel, S. A. (2009). A sporadic parkinson disease model via silencing of the ubiquitin-proteasome/E3 ligase component SKP1A. Journal of Biological Chemistry , 284(47), 32835–32845. doi: 10.1074/jbc.M109.034223.
- Franco, R., Li, S., Rodriguez-Rocha, H., Burns, M., & Panayiotidis, M. I. (2010). Molecular mechanisms of pesticide-induced neurotoxicity: Relevance to Parkinson's disease. Chemico-Biological Interactions , 188(2), 289–300. doi: 10.1016/j.cbi.2010.06.003.
- Haque, M. E., Thomas, K. J., D'Souza, C., Callaghan, S., Kitada, T., Slack, R. S., … Park, D. S. (2008). Cytoplasmic Pink1 activity protects neurons from dopaminergic neurotoxin MPTP. Proceedings of the National Academy of Sciences , 105(5), 1716–1721. doi: 10.1073/pnas.0705363105.
- Hoglinger, G. U., Lannuzel, A., Khondiker, M. E., Michel, P. P., Duyckaerts, C., Feger, J., … Hirsch, E. C. (2005). The mitochondrial complex I inhibitor rotenone triggers a cerebral tauopathy. Journal of Neurochemistry , 95(4), 930–939. doi: 10.1111/j.1471-4159.2005.03493.x.
- Jayaraj, R. L., Tamilselvam, K., Manivasagam, T., & Elangovan, N. (2013). Neuroprotective effect of CNB-001, a novel pyrazole derivative of curcumin on biochemical and apoptotic markers against rotenone-induced SK-N-SH cellular model of Parkinson's disease. Journal of Molecular Neuroscience , 51(3), 863–870. doi: 10.1007/s12031-013-0075-8.
- Jones, T. R., Carpenter, A., & Golland, P. (2005). Voronoi-based segmentation of cells on image manifolds. pp. 535–543. In Proceedings of the First International Workshop on Computer Vision for Biomedical Image Applications (CVBIA). doi: 10.1007/11569541_54.
- Kamentsky, L., Jones, T. R., Fraser, A., Bray, M.-A., Logan, D. J., Madden, K. L., … Carpenter, A. E. (2011). Improved structure, function and compatibility for CellProfiler: Modular high-throughput image analysis software. Bioinformatics , 27(8), 1179–1180. doi: 10.1093/bioinformatics/btr095.
- Kholmukhamedov, A., Schwartz, J. M., & Lemasters, J. J. (2013). Mitotracker probes and mitochondrial membrane potential. Shock , 39(6), 543. doi: 10.1097/SHK.0b013e318292300d.
- Lindblad, J., & Bengtsson, E. (2001). A comparison of methods for estimation of intensity nonuniformities in 2D and 3D microscope images of fluorescence stained cells. Proceedings of the 12th Scandinavian Conference on Image Analysis (SCIA) , 264–271.
- McQuin, C., Goodman, A., Chernyshev, V., Kamentsky, L., Cimini, B. A., Karhohs, K. W., … Carpenter, A. E. (2018). CellProfiler 3.0: Next-generation image processing for biology. PloS Biology , 16(7), e2005970. doi: 10.1371/journal.pbio.2005970.
- Mehta, S. L., & Li, P. A. (2009). Neuroprotective role of mitochondrial uncoupling protein 2 in cerebral stroke. Journal of Cerebral Blood Flow & Metabolism, 29(6), 1069–1078. doi: 10.1038/jcbfm.2009.4.
- Otsu, N. (1979). A threshold selection method from gray-level histograms. IEEE Transactions on Systems, Management, and Cybernetics , 9(1), 62–66.
- Padmanabhan, K., Eddy, W. F., & Crowley, J. C. (2010). A novel algorithm for optimal image thresholding of biological data. Journal of Neuroscience Methods , 193(2), 380–384. doi: 10.1016/j.jneumeth.2010.08.031.
- Perry, S. W., Norman, J. P., Barbieri, J., Brown, E. B., & Gelbard, H. A. (2011). Mitochondrial membrane potential probes and the proton gradient: A practical usage guide. BioTechniques , 50(2), 98–115. doi: 10.2144/000113610.
- Phelan, M. C. (2001). Techniques for mammalian cell culture. Current Protocols in Neuroscience , 2, A.3B.1-A.3B.13. doi: 10.1002/0471142301.nsa03bs02.
- Pieczenik, S. R., & Neustadt, J. (2007). Mitochondrial dysfunction and molecular pathways of disease. Experimental and Molecular Pathology , 83(1), 84–92. doi: 10.1016/j.yexmp.2006.09.008.
- Poot, M., Zhang, Y. Z., Krämer, J. A., Wells, K. S., Jones, L. J., Hanzel, D. K., … Haugland, R. P. (1996). Analysis of mitochondrial morphology and function with novel fixable fluorescent stains. Journal of Histochemistry & Cytochemistry, 44(12), 1363–1372. doi: 10.1177/44.12.8985128.
- Pozo Devoto, V. M., & Falzone, T. L. (2017). Mitochondrial dynamics in Parkinson's disease: A role for α-synuclein? Disease Models & Mechanisms, 10(9), 1075–1087. doi: 10.1242/dmm.026294.
- Reddy, P. H. (2009). Role of mitochondria in neurodegenerative diseases: Mitochondria as a therapeutic target in Alzheimer's disease. CNS Spectrums , 14(S7), 8–13. doi: 10.1017/S1092852900024901.
- Rodriguez-Losada, N., Romero, P., Estivill-Torrús, G., Guzmán de Villoria, R., & Aguirre, J. A. (2017). Cell survival and differentiation with nanocrystalline glass-like carbon using substantia nigra dopaminergic cells derived from transgenic mouse embryos. PloS One , 12(3), e0173978. doi: 10.1371/journal.pone.0173978.
- Sandhu, L. C., Warters, R. L., & Dethlefsen, L. A. (1985). Fluorescence studies of Hoechst 33342 with supercoiled and relaxed plasmid pBR322 DNA. Cytometry , 6(3), 191–194. doi: 10.1002/cyto.990060304.
- Sankur, B. (2004). Survey over image thresholding techniques and quantitative performance evaluation. Journal of Electronic Imaging , 13(1), 146. doi: 10.1117/1.1631315.
- Scorrano, L., Petronilli, V., Colonna, R., Di Lisa, F., & Bernardi, P. (1999). Chloromethyltetramethylrosamine (Mitotracker Orange TM) induces the mitochondrial permeability transition and inhibits respiratory complex I. Journal of Biological Chemistry , 274(35), 24657–24663. doi: 10.1074/jbc.274.35.24657.
- Scott, I., & Youle, R. J. (2010). Mitochondrial fission and fusion. Essays in Biochemistry , 47, 85–98. doi: 10.1042/bse0470085.
- Sherer, T. B., Betarbet, R., Stout, A. K., Lund, S., Baptista, M., Panov, A. V., … Greenamyre, J. T. (2002). An in vitro model of Parkinson's disease: Linking mitochondrial impairment to altered α-synuclein metabolism and oxidative damage. The Journal of Neuroscience , 22(16), 7006–7015. doi: 10.1523/JNEUROSCI.22-16-07006.2002.
- Son, J. H., Chun, H. S., Joh, T. H., Cho, S., Conti, B., & Lee, J. W. (1999). Neuroprotection and neuronal differentiation studies using substantia nigra dopaminergic cells derived from transgenic mouse embryos. The Journal of Neuroscience , 19(1), 10–20. doi: 10.1523/JNEUROSCI.19-01-00010.1999.
- Toyama, E. Q., Herzig, S., Courchet, J., Lewis, T. L., Loson, O. C., Hellberg, K., … Shaw, R. J. (2016). AMP-activated protein kinase mediates mitochondrial fission in response to energy stress. Science , 351(6270), 275–281. doi: 10.1126/science.aab4138.
- Wang, J., Gu, J., Wu, H., Zhu, G., Feng, D., Li, Y., … Gao, L. (2017). Pentazocine protects SN4741 cells against MPP+-induced cell damage via up-regulation of the canonical Wnt/β-catenin signaling pathway. Frontiers in Aging Neuroscience , 9, 196. doi: 10.3389/fnagi.2017.00196.
Citing Literature
Number of times cited according to CrossRef: 3
- Christopher R. Gonzales, Eric N. Moca, Partha K. Chandra, David W. Busija, Ibolya Rutkai, Three-dimensional object geometry of mitochondria-associated signal: 3-D analysis pipeline for two-photon image stacks of cerebrovascular endothelial mitochondria, American Journal of Physiology-Heart and Circulatory Physiology, 10.1152/ajpheart.00101.2024, 326 , 5, (H1291-H1303), (2024).
- Ching-Hsiang Chu, Wen-Wei Tseng, Chan-Min Hsu, An-Chi Wei, Image Analysis of the Mitochondrial Network Morphology With Applications in Cancer Research, Frontiers in Physics, 10.3389/fphy.2022.855775, 10 , (2022).
- Achilleas Floudas, Conor M Smith, Orla Tynan, Nuno Neto, Vinod Krishna, Sarah M Wade, Megan Hanlon, Clare Cunningham, Viviana Marzaioli, Mary Canavan, Jean M Fletcher, Ronan H Mullan, Suzanne Cole, Ling-Yang Hao, Michael G Monaghan, Sunil Nagpal, Douglas J Veale, Ursula Fearon, Distinct stromal and immune cell interactions shape the pathogenesis of rheumatoid and psoriatic arthritis, Annals of the Rheumatic Diseases, 10.1136/annrheumdis-2021-221761, 81 , 9, (1224-1242), (2022).

