iBEAT V2.0: a multisite-applicable, deep learning-based pipeline for infant cerebral cortical surface reconstruction
Weili Lin, Li Wang, Zhengwang Wu, Liangjun Chen, Yue Sun, Gang Li
deep learning
infant brain MRI
cortical surface reconstruction
multisite-applicable pipeline
neuroimaging processing
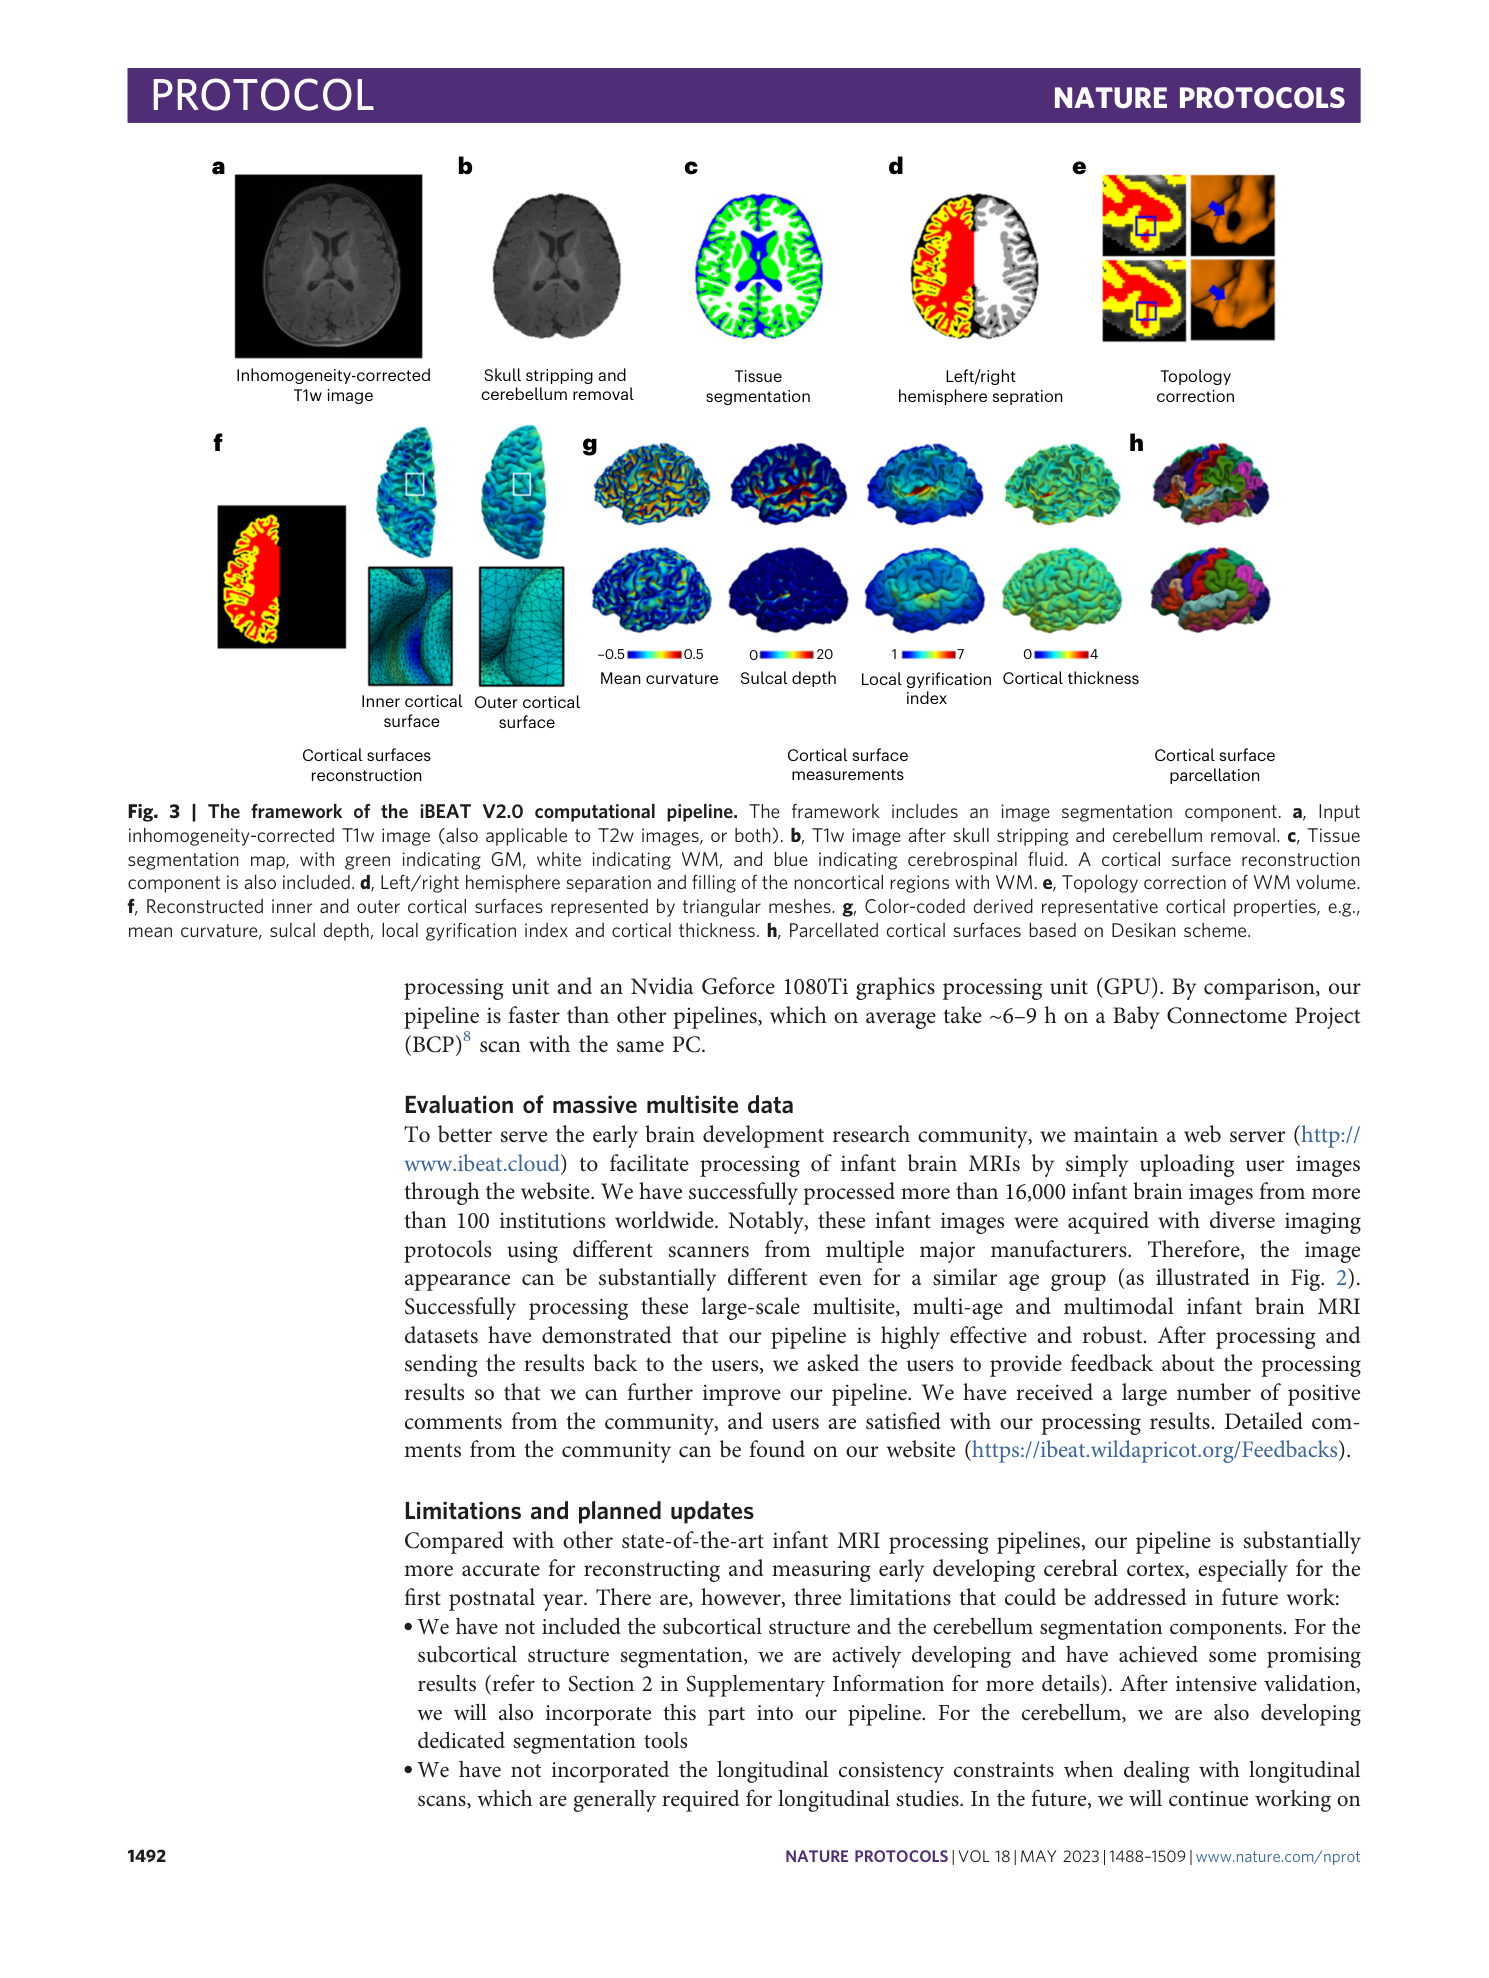
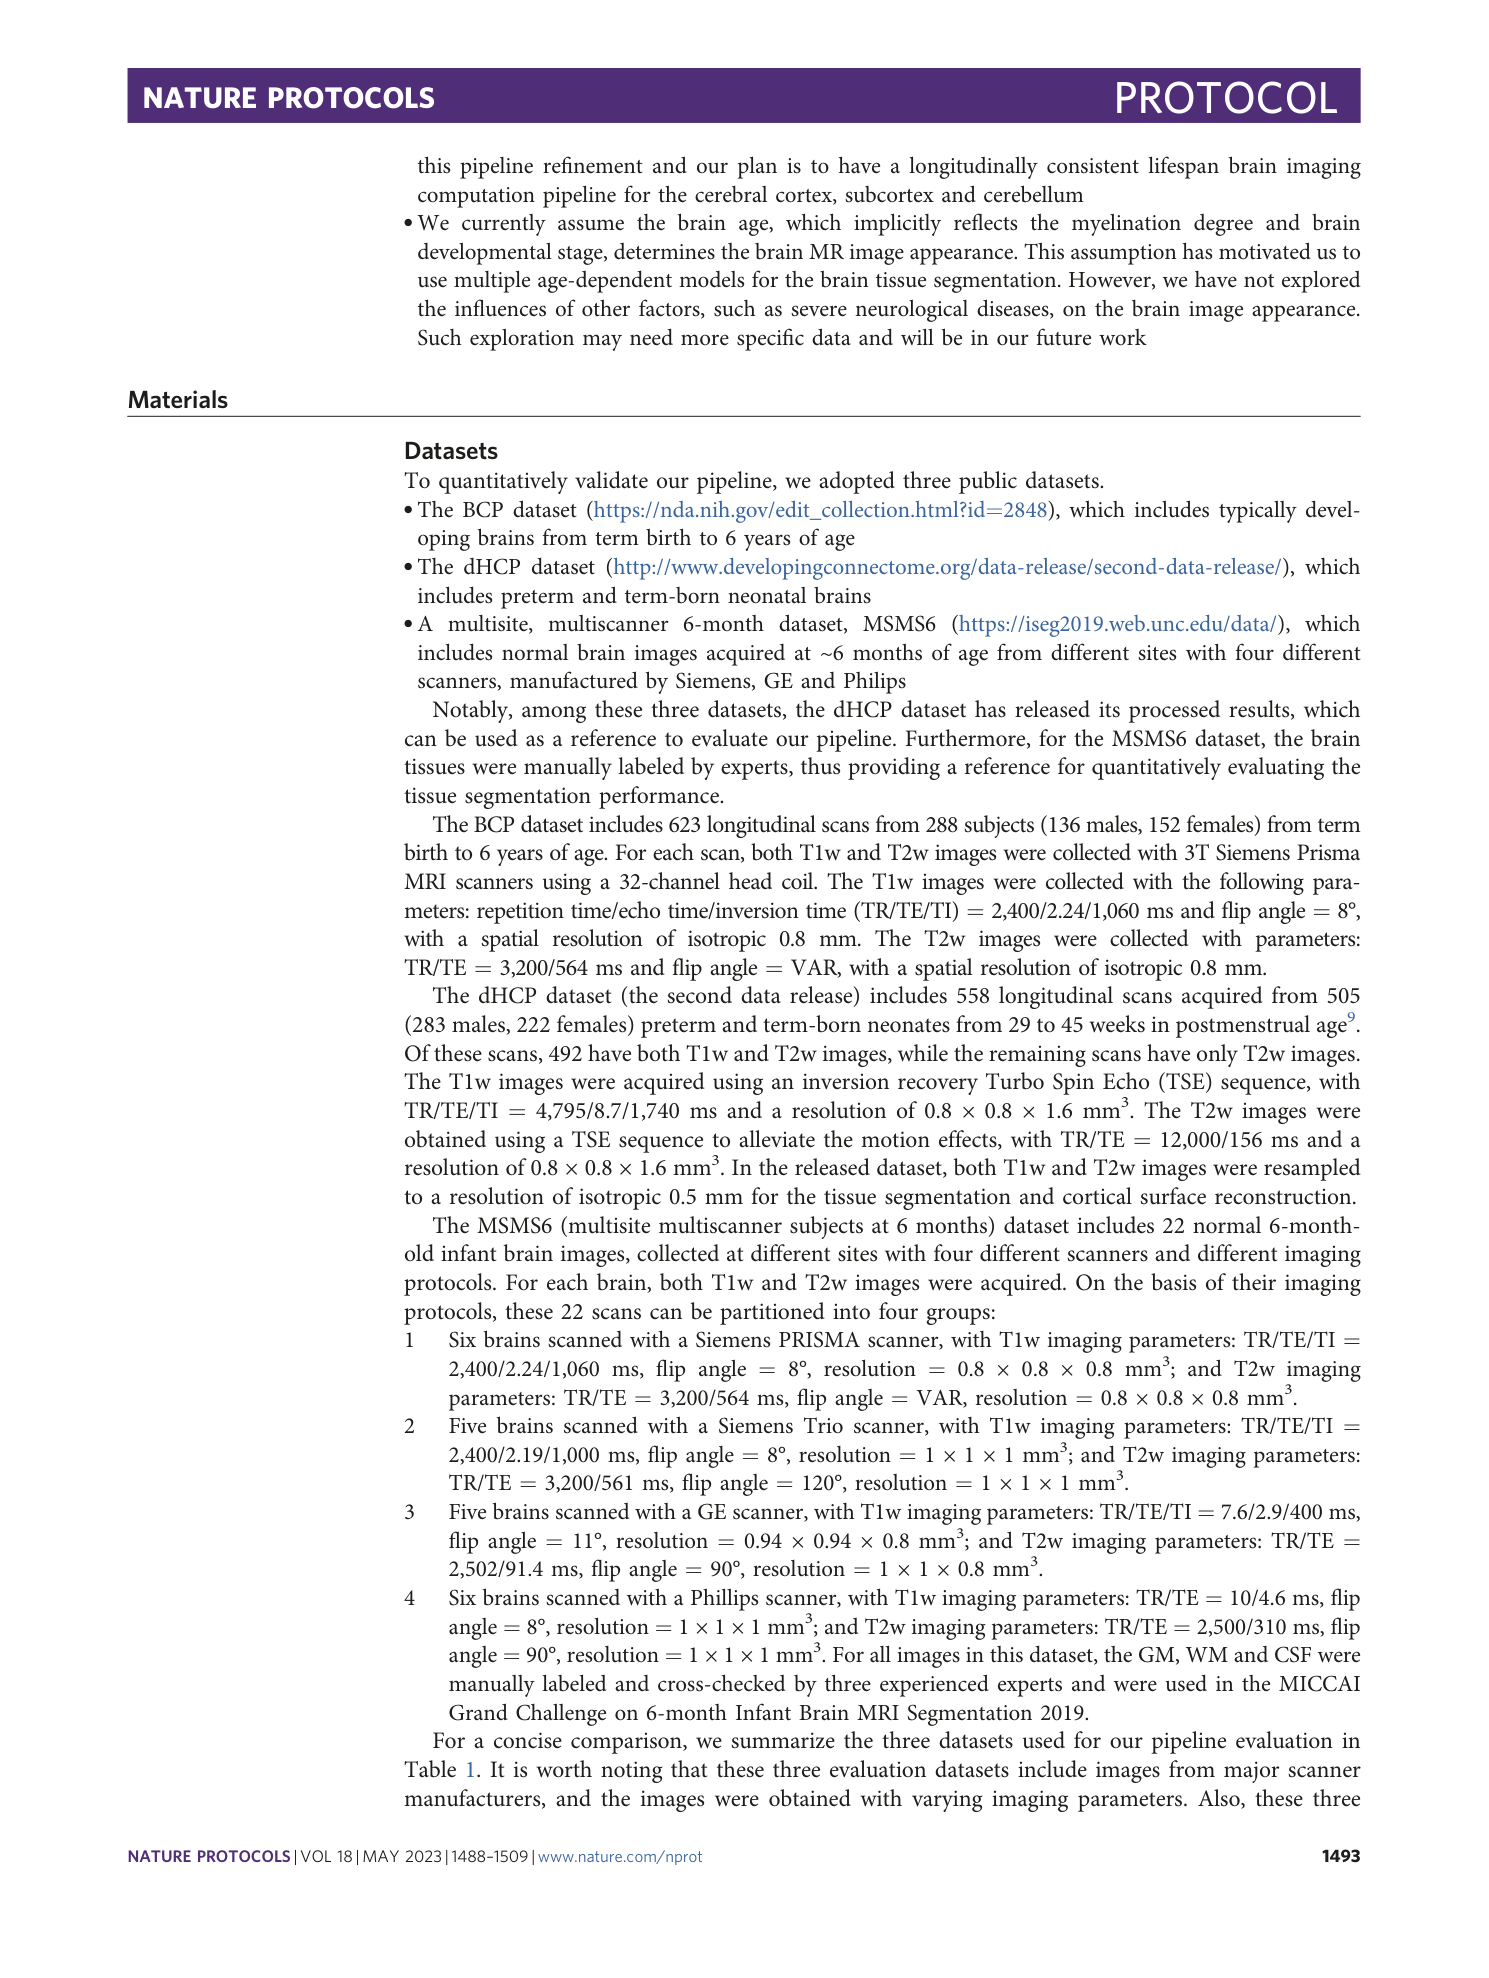
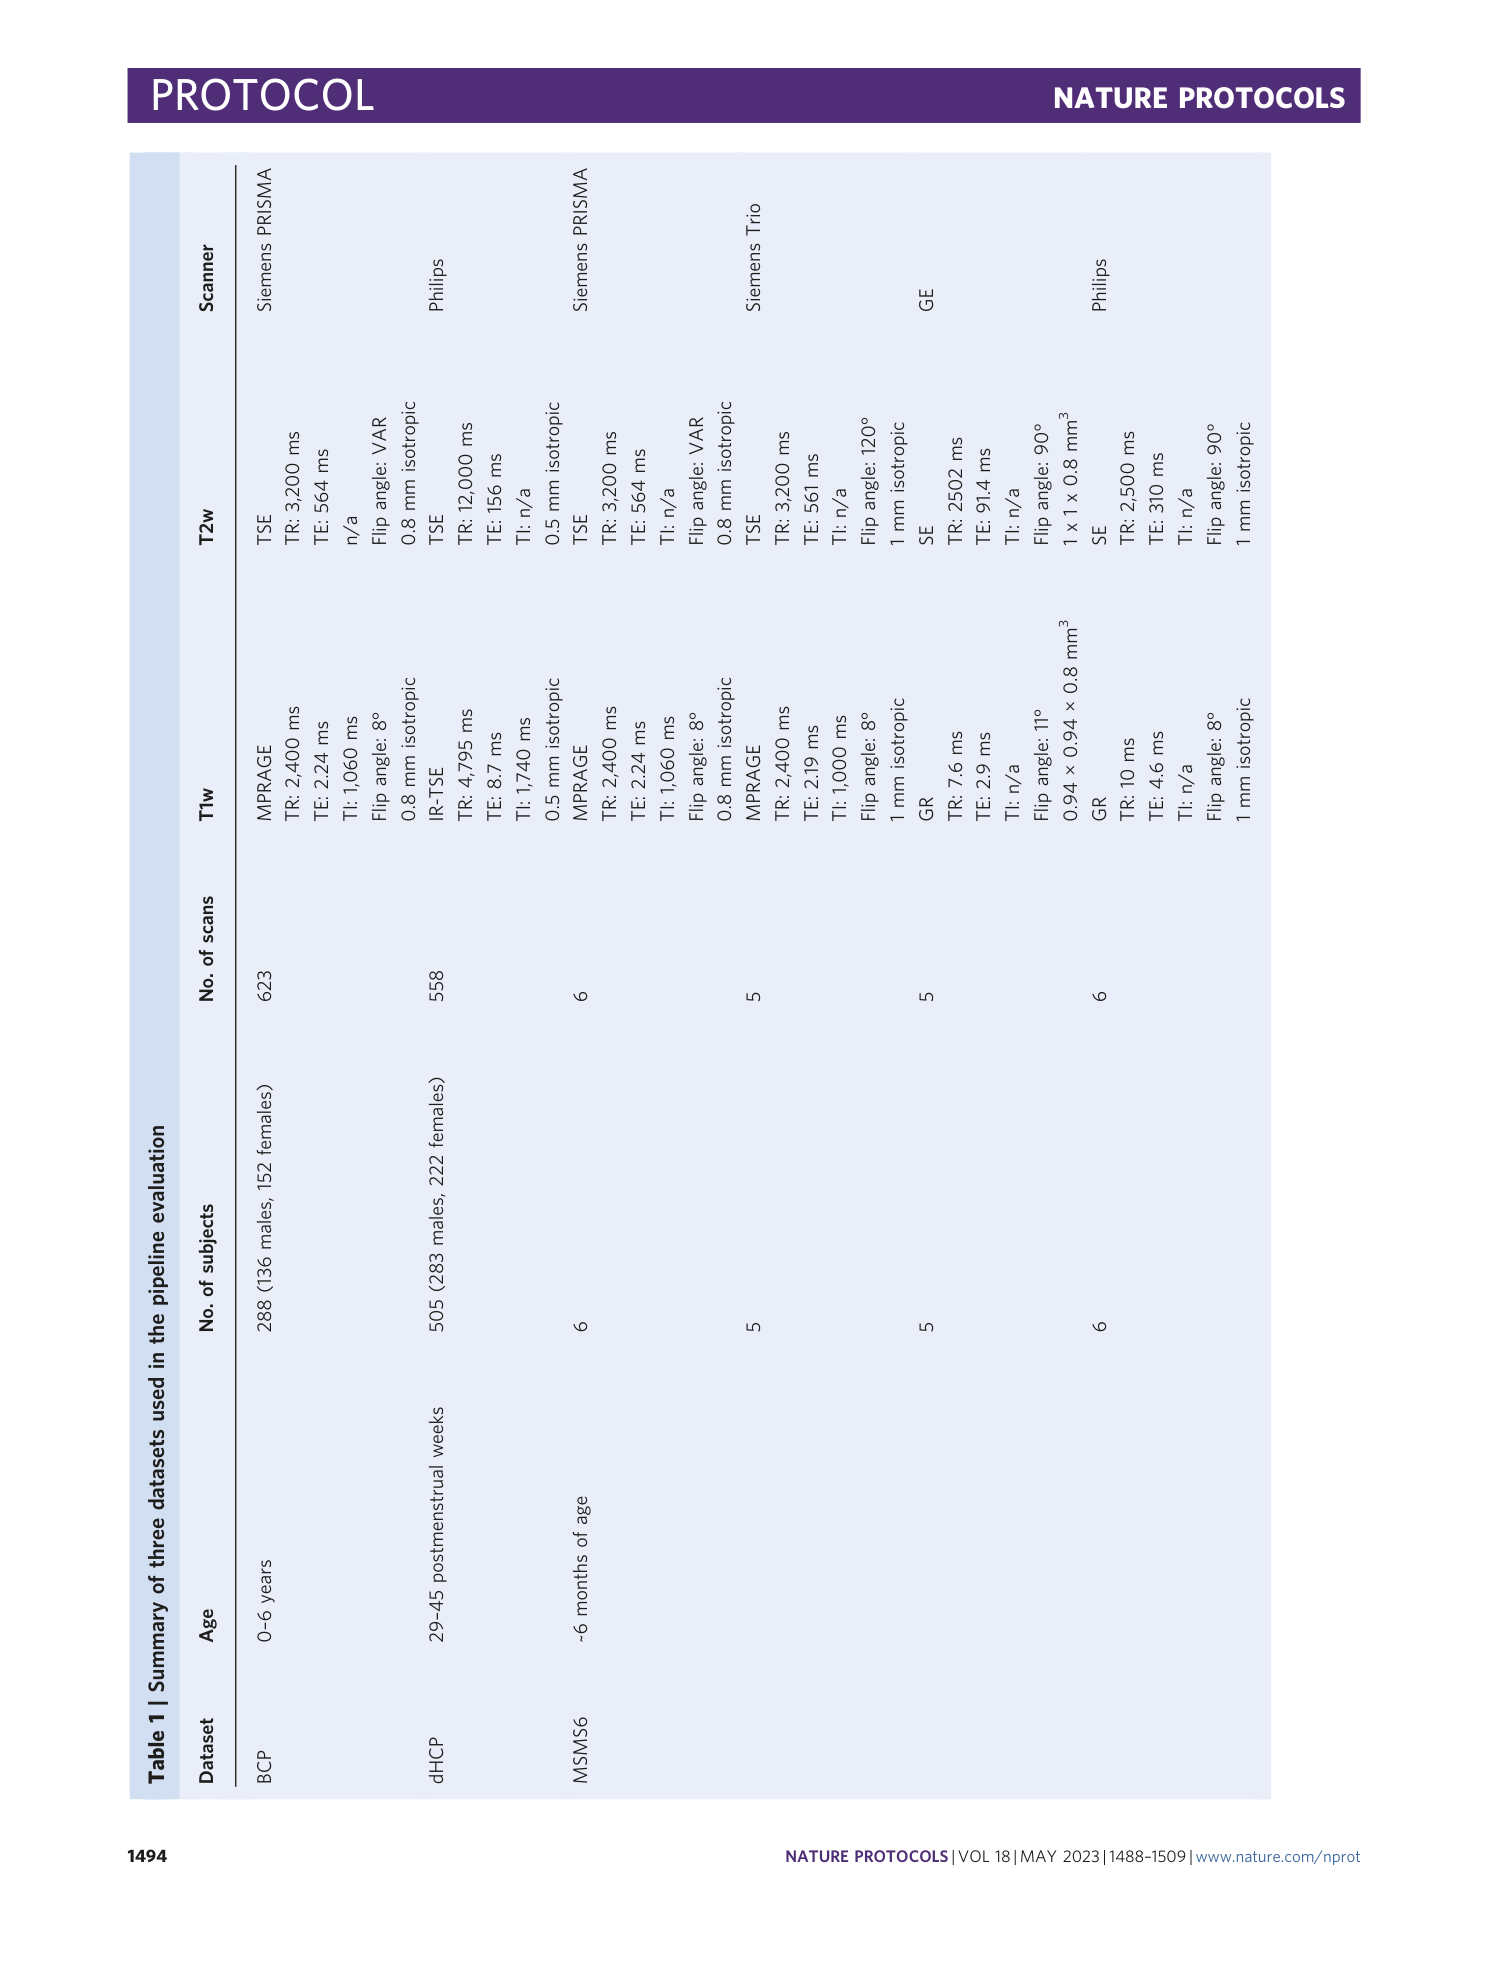
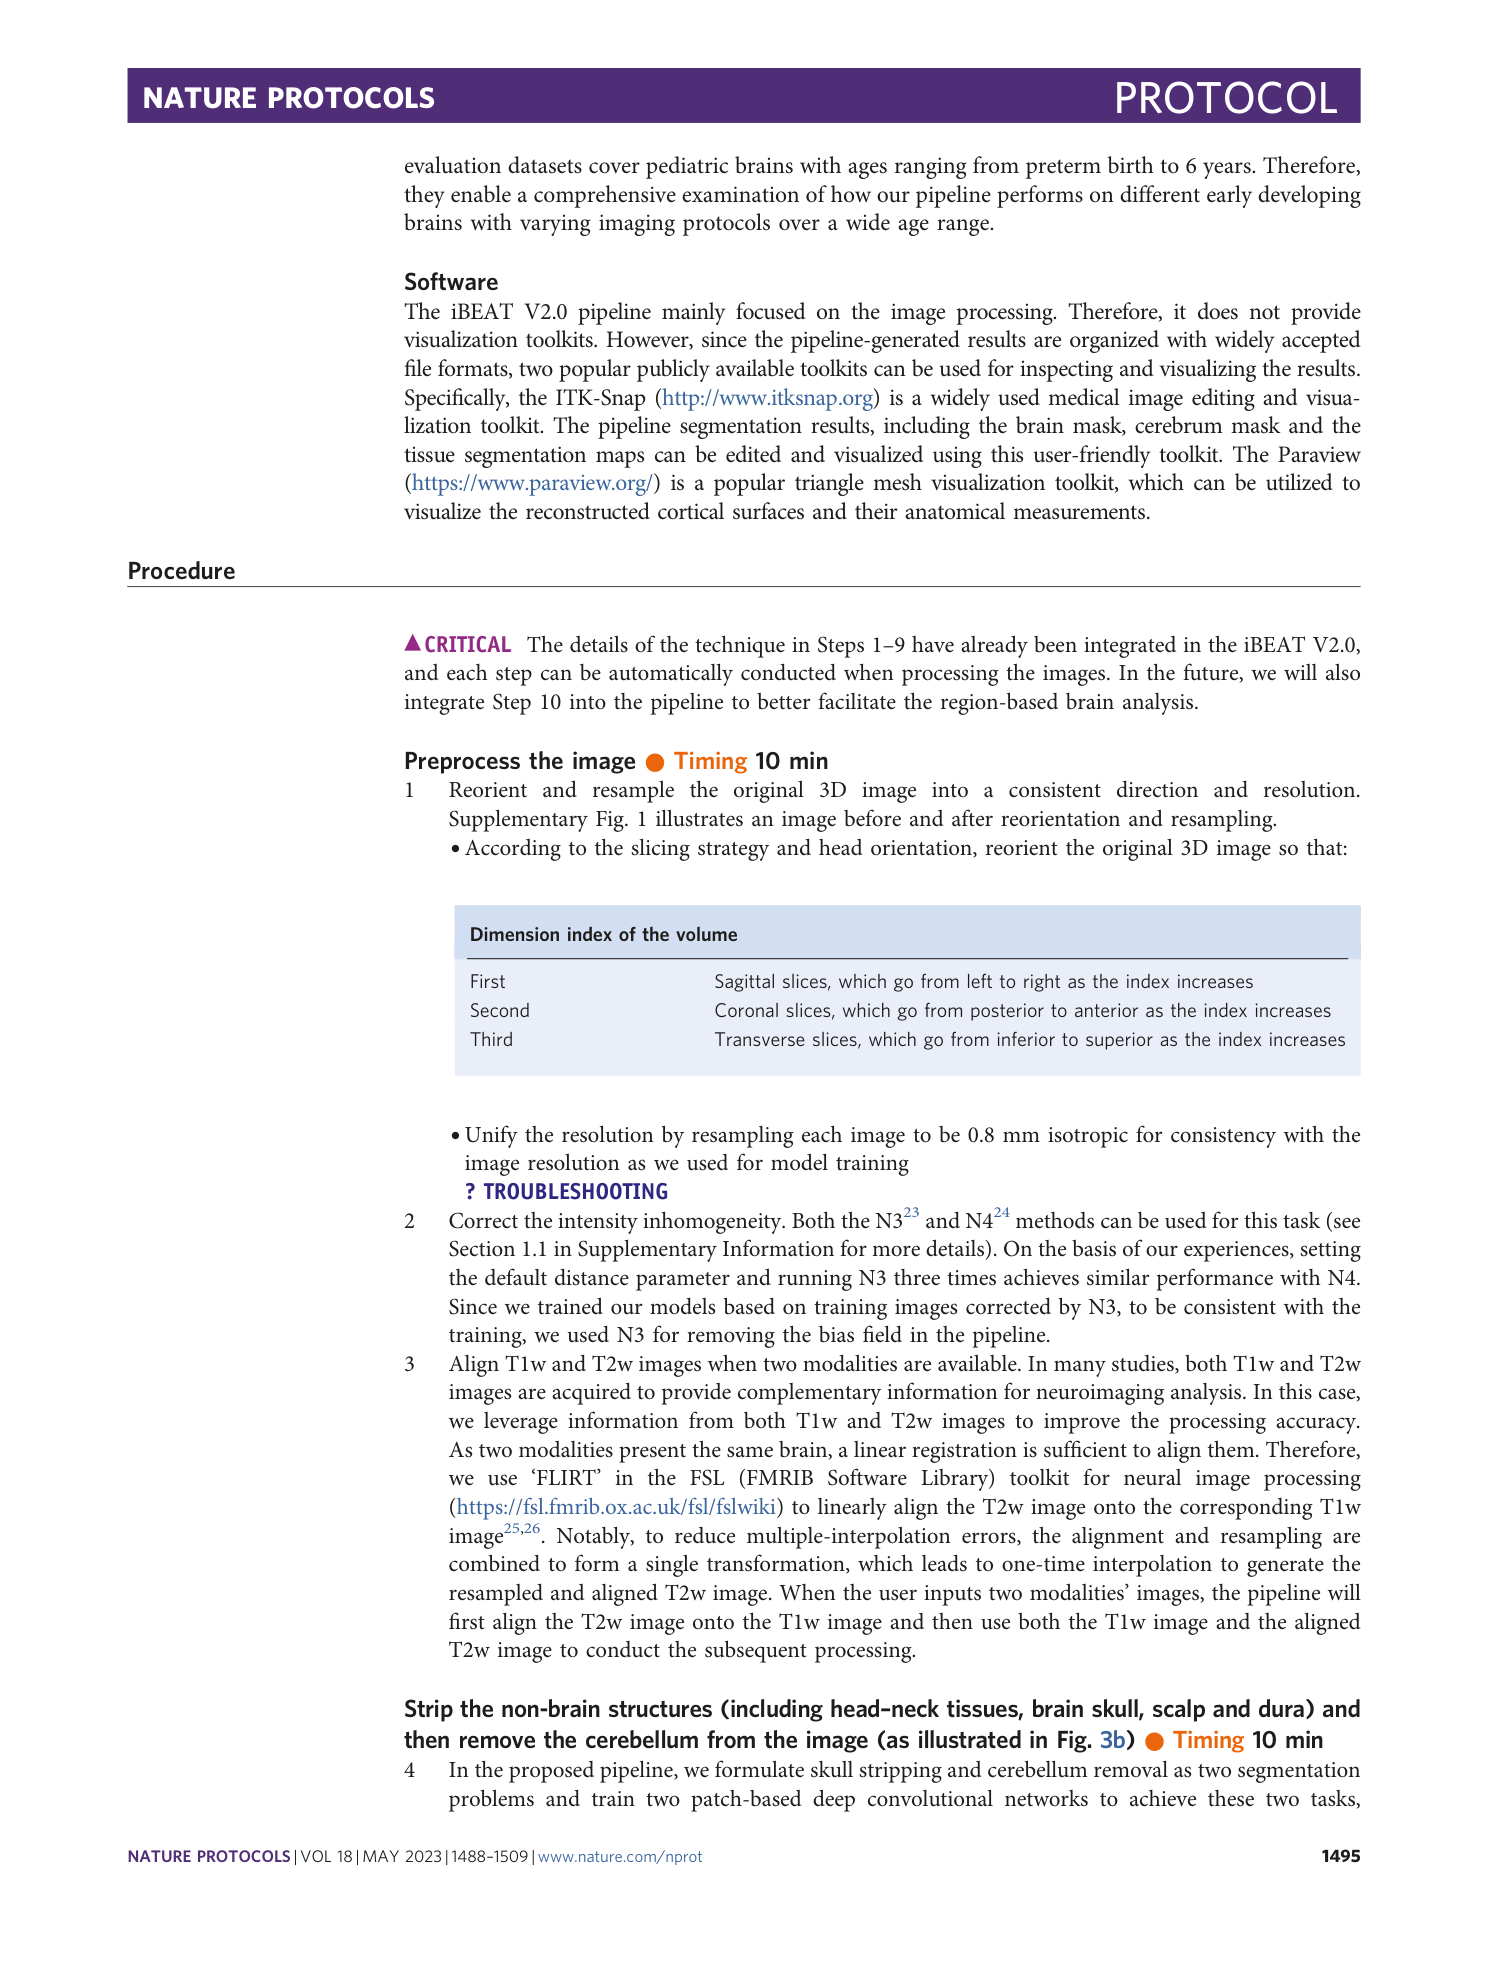
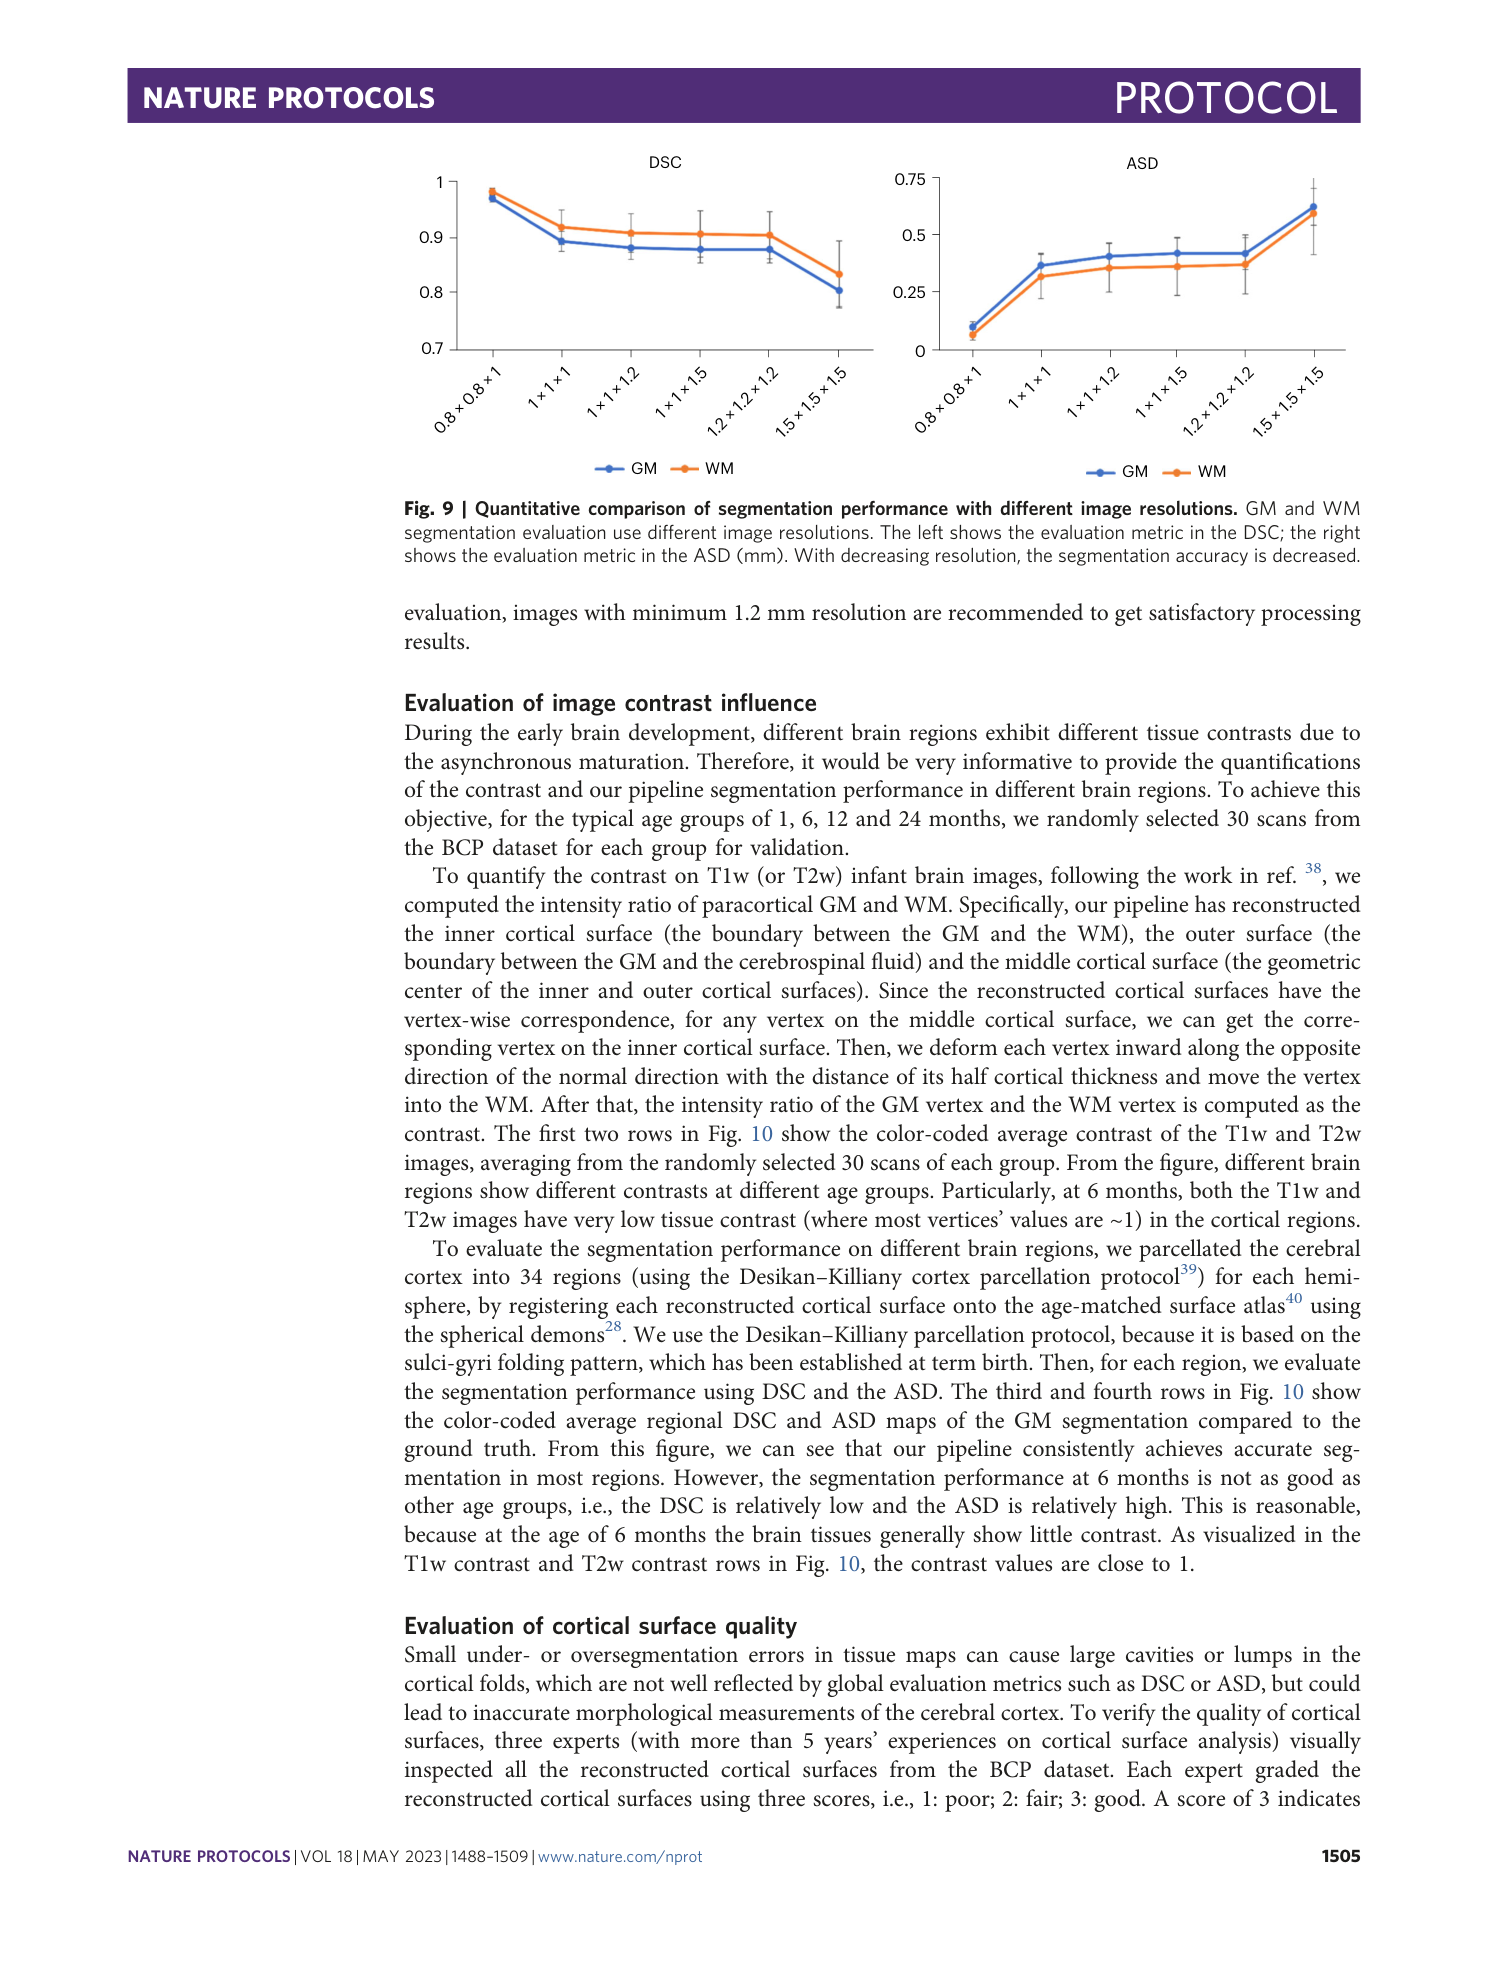


Extended
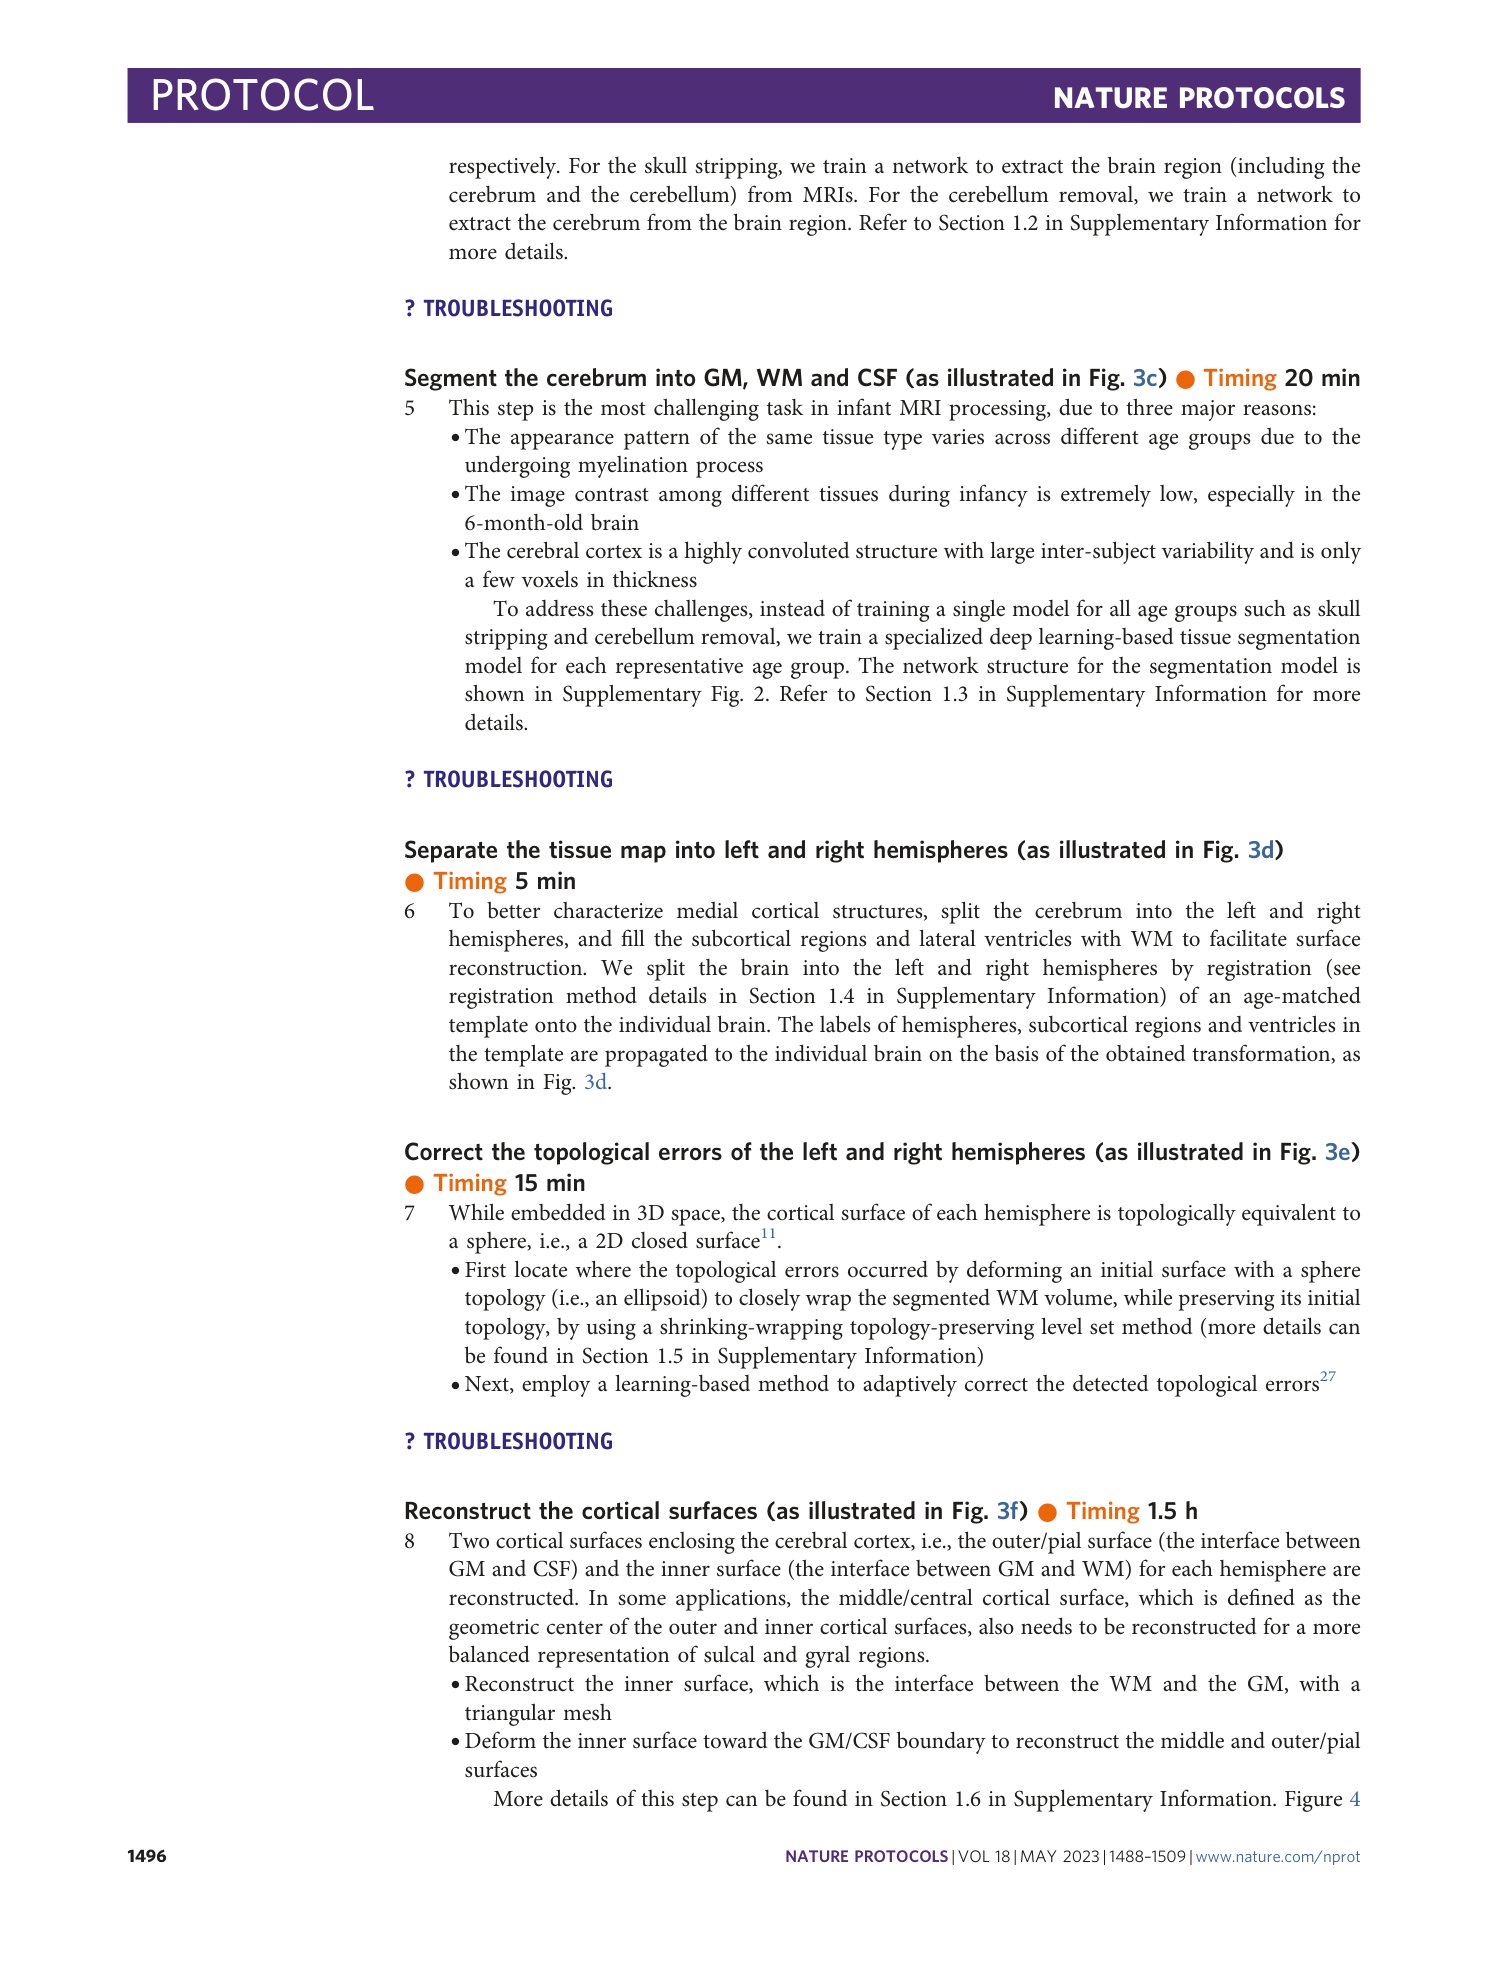
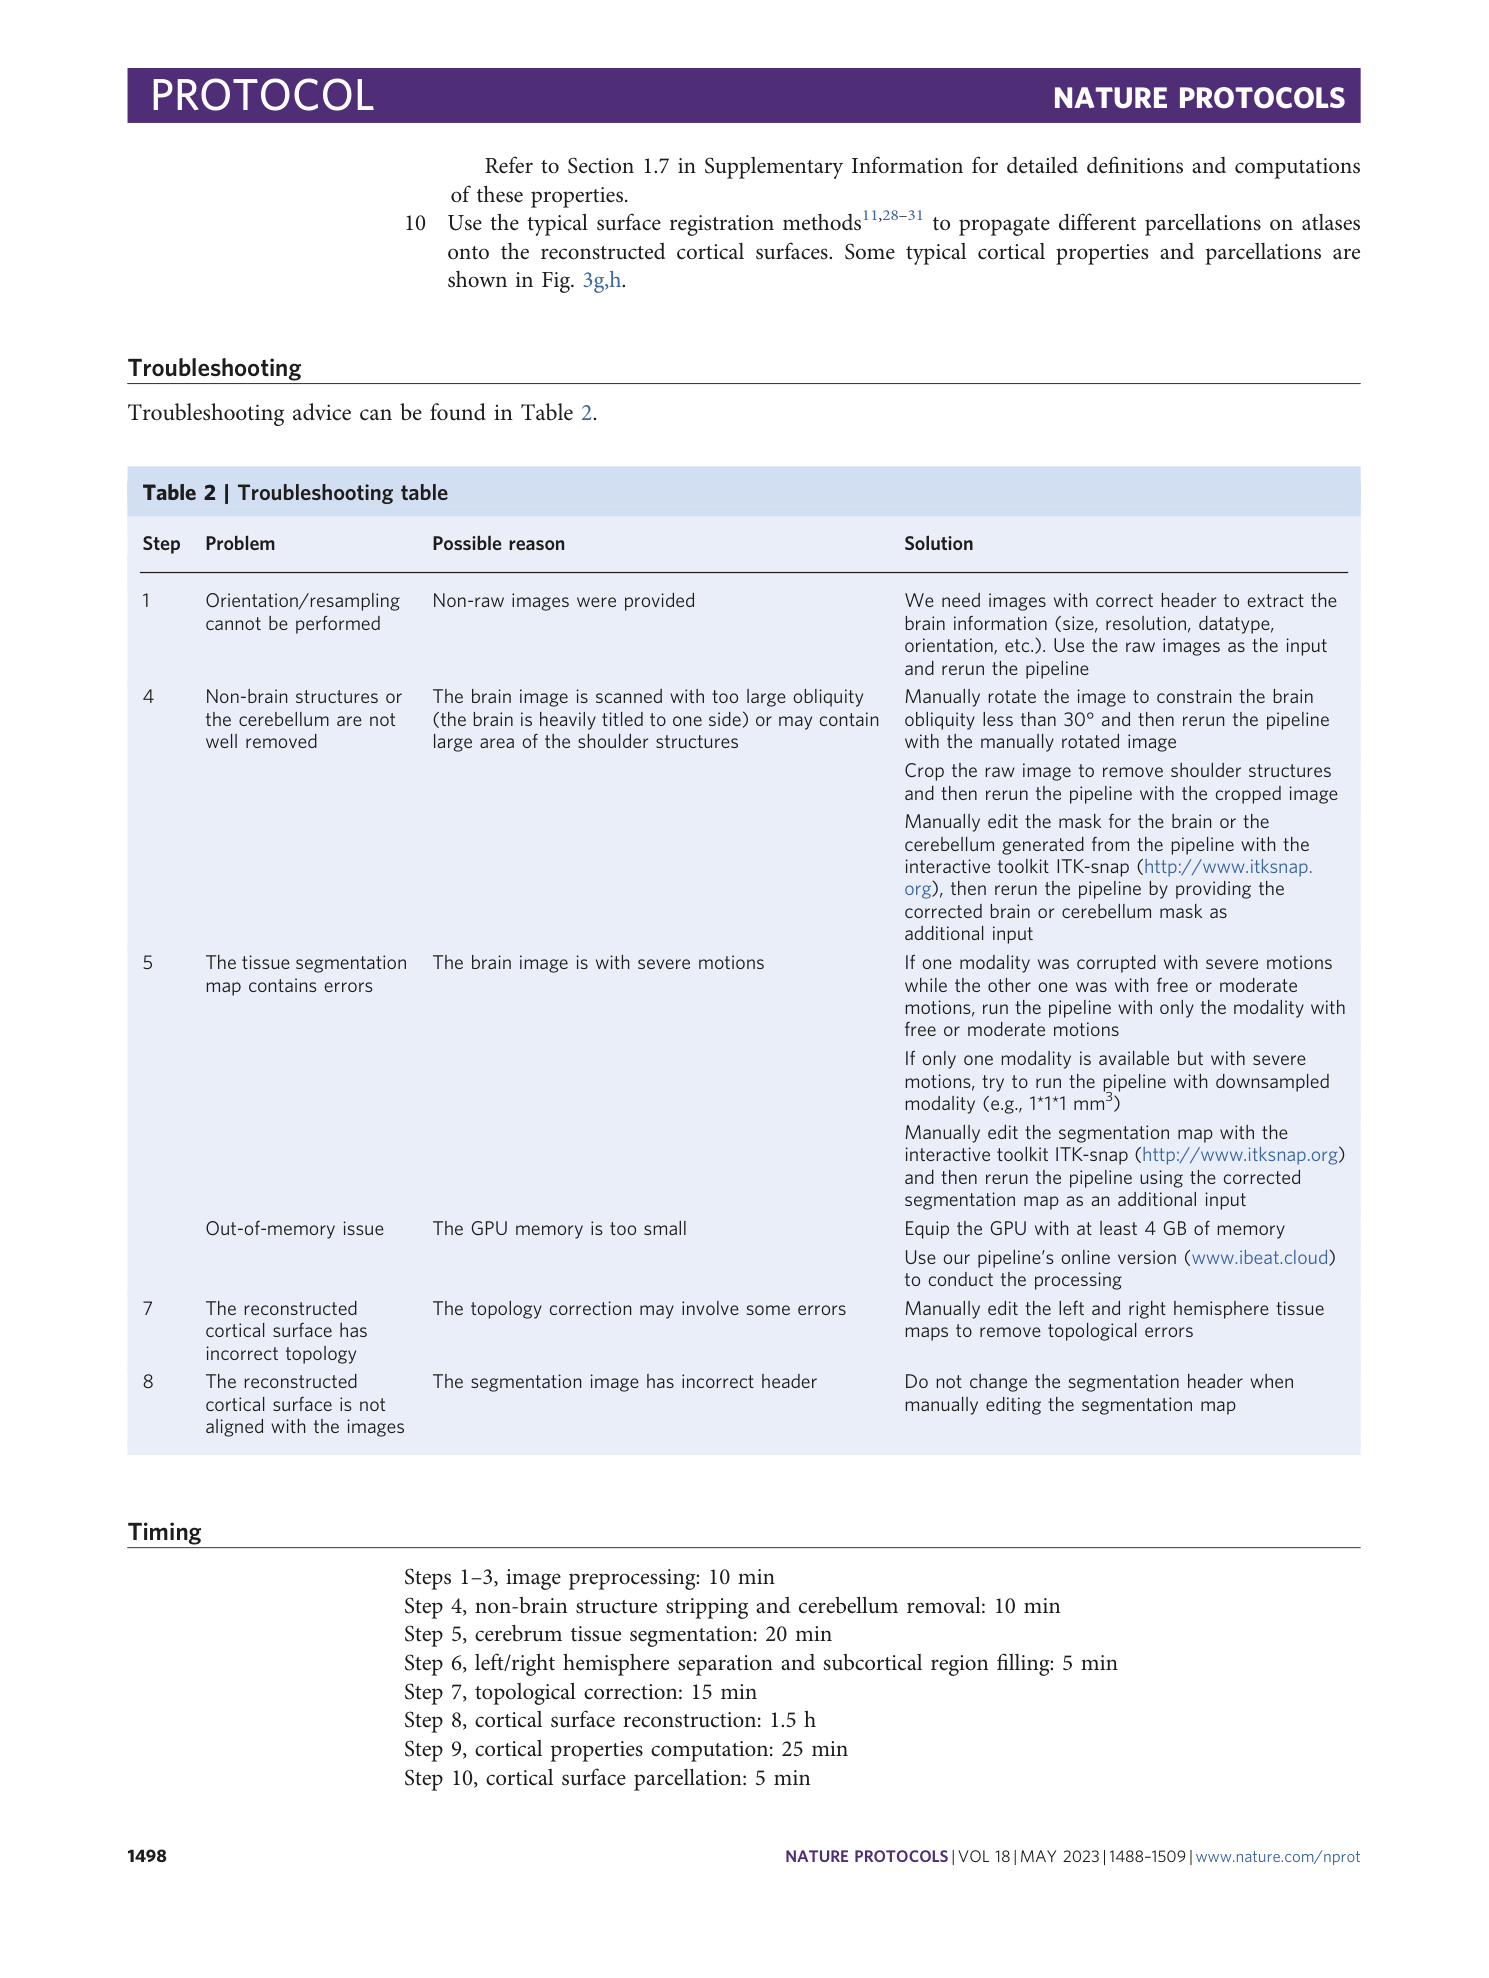
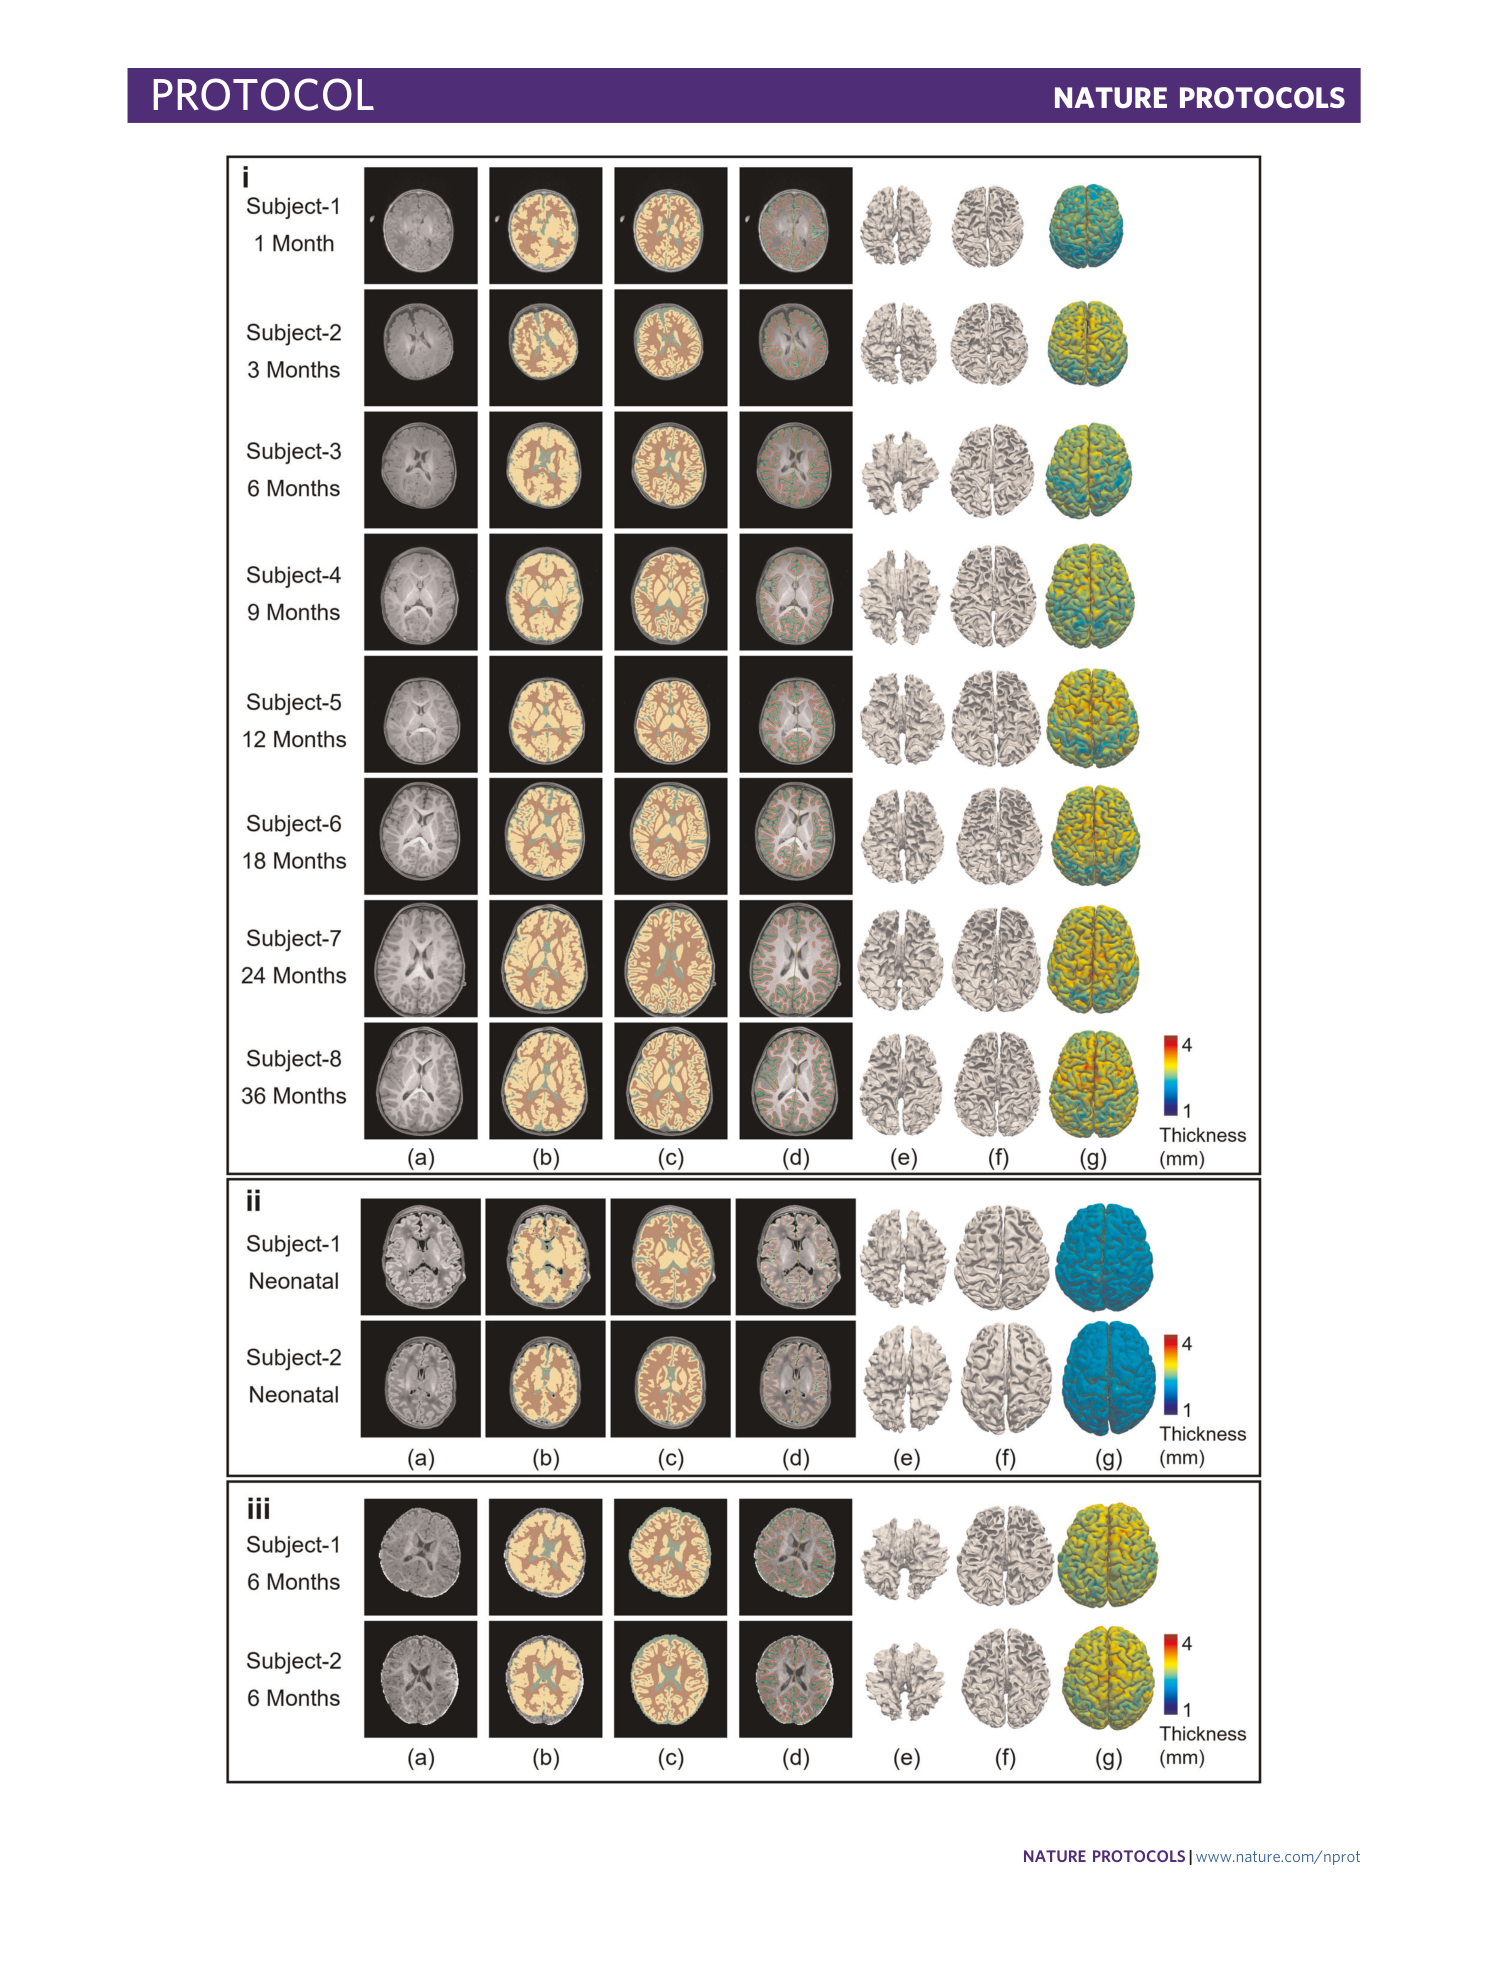
Extended Data Fig. 1 Comparison of processing results between Infant FreeSurfer and iBEAT V2.0 on different datasets.
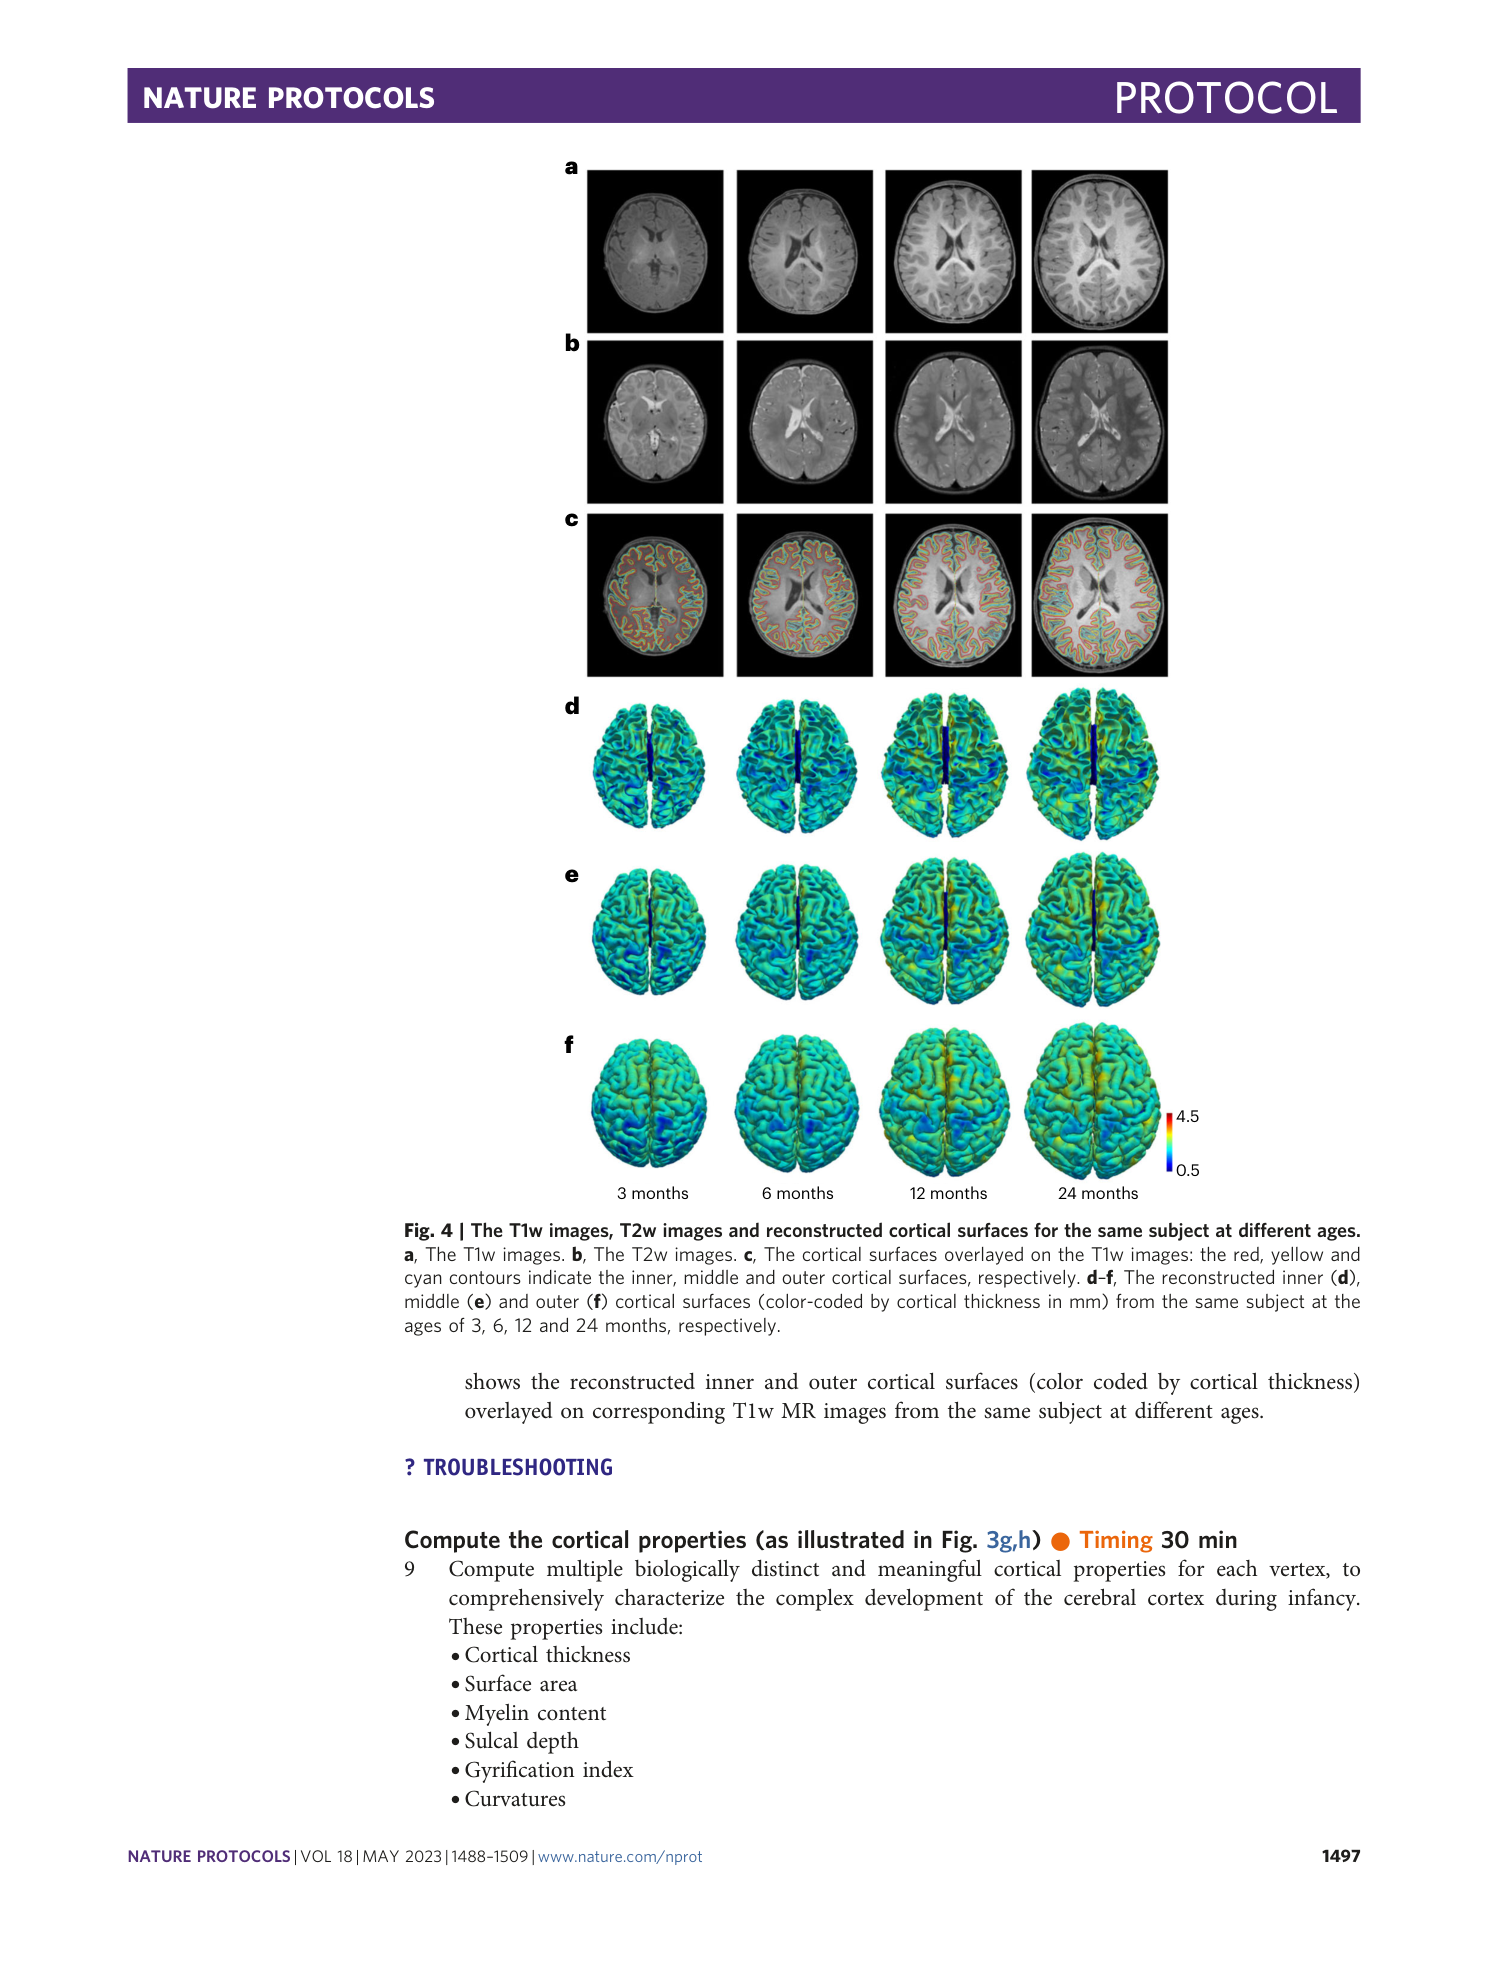
i. Comparison on the BCP dataset. ii. Comparison on the dHCP dataset. iii. Comparison on the MSMS dataset. ( a ) T1w images. ( b ) Tissue segmentation by Infant FreeSurfer. ( c ) Tissue segmentation by iBEAT V2.0. ( d ) iBEAT V2.0 reconstructed cortical surfaces overlayed on intensity images, with red contours indicating inner surfaces and green contours indicating outer surfaces. ( e ) Reconstructed inner cortical surface using Infant FreeSurfer. ( f ) Reconstructed inner cortical surfaces using iBEAT V2.0. ( g ) Reconstructed outer cortical surfaces (color-coded by cortical thickness) using iBEAT V2.0.
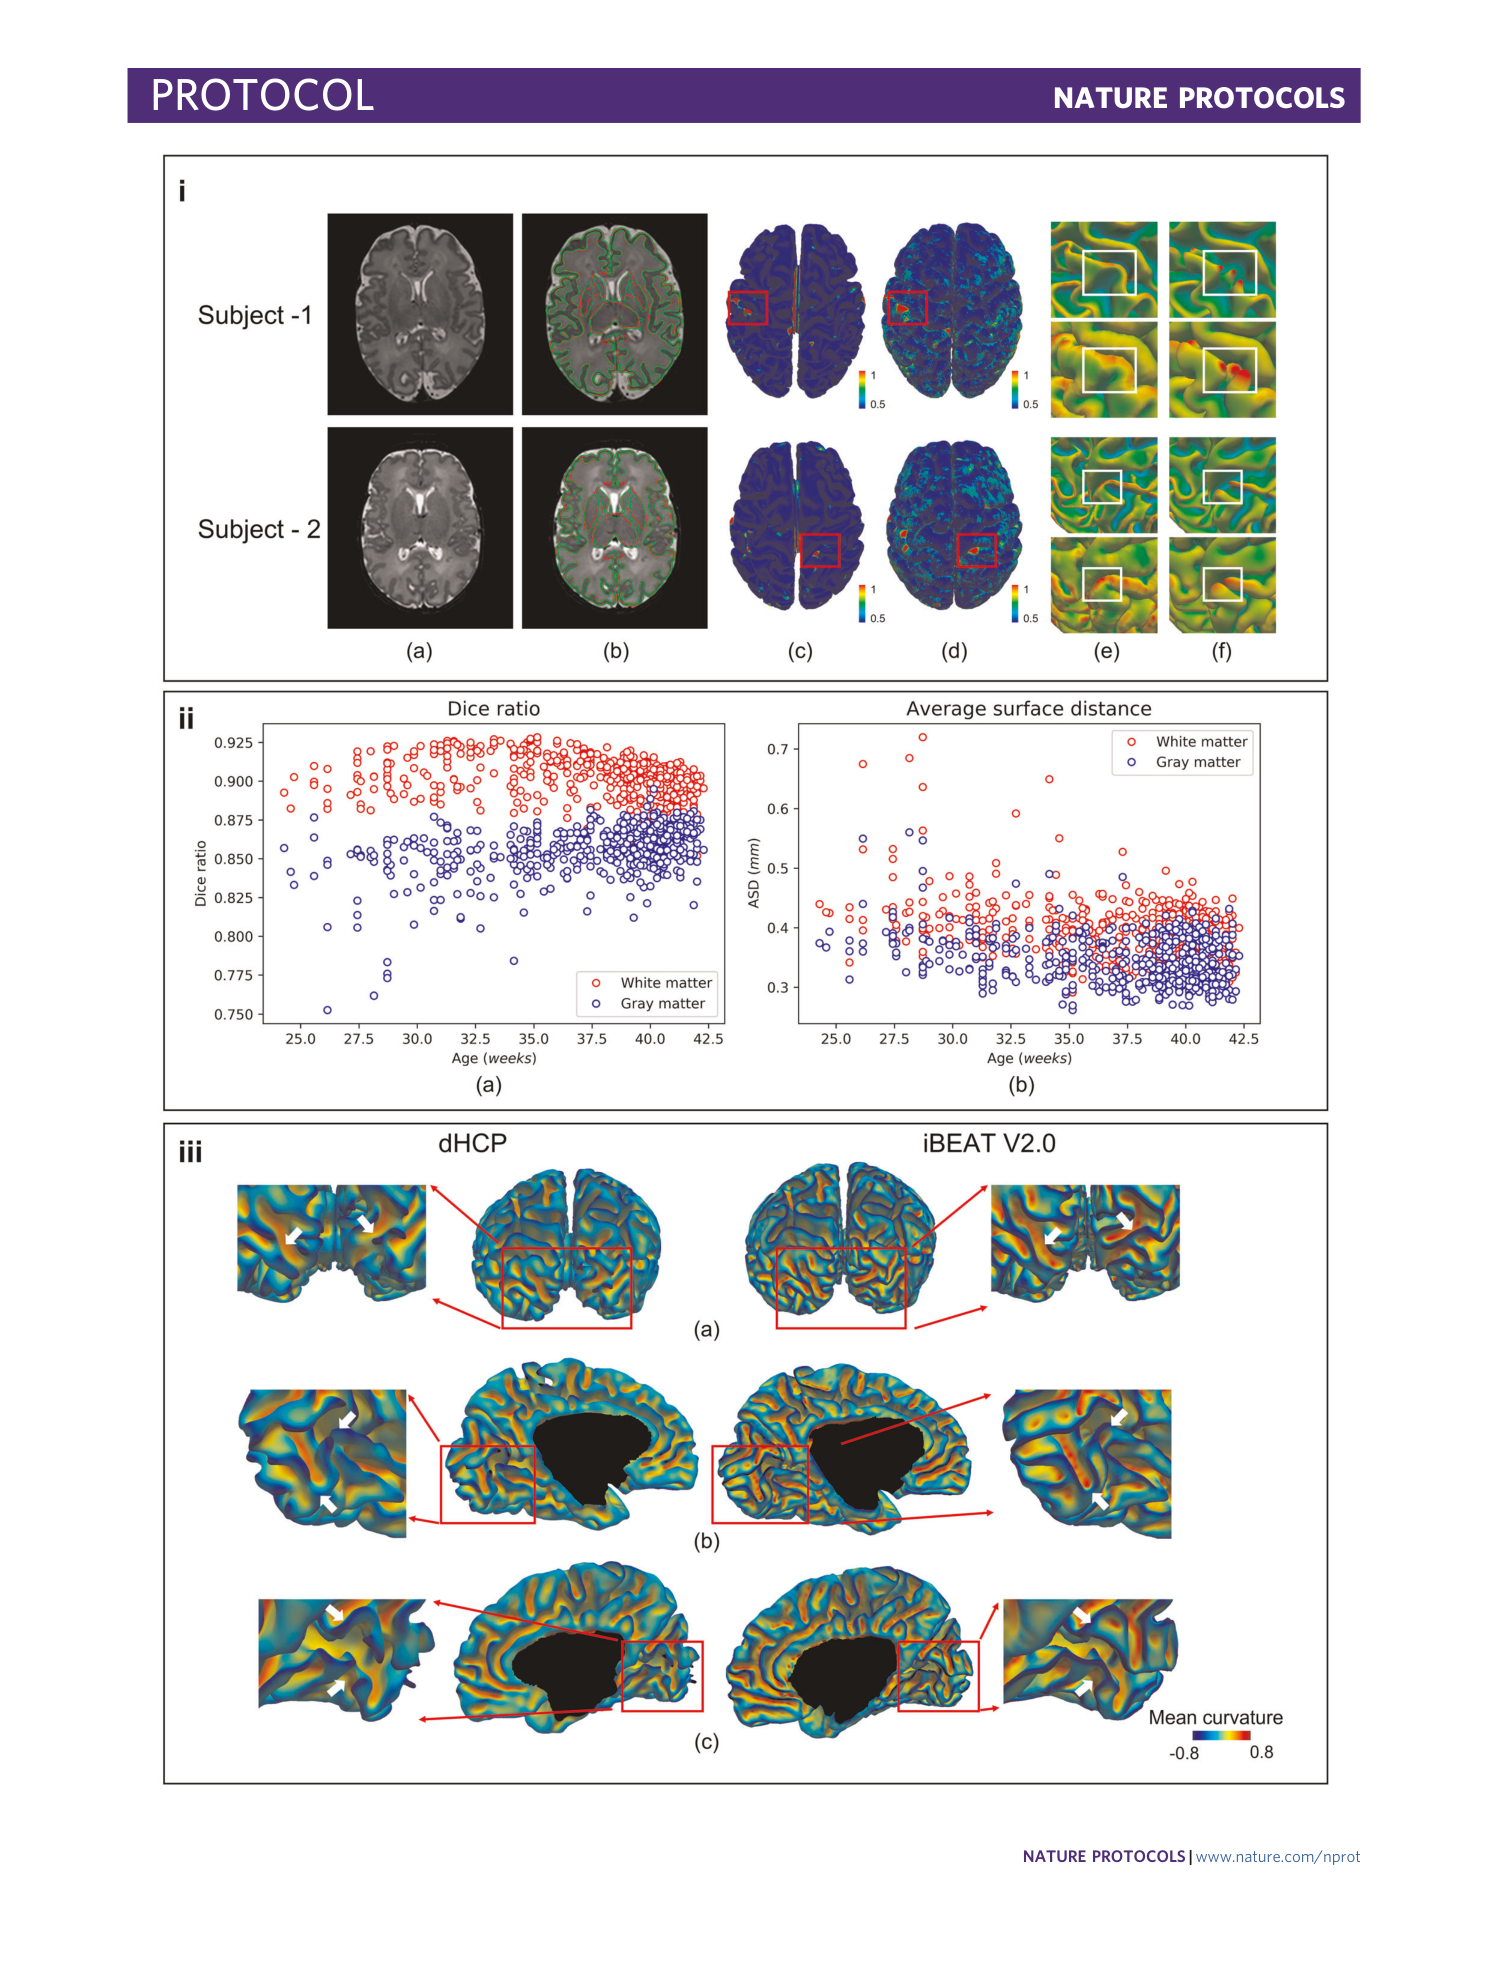
Extended Data Fig. 2 Comparison between dHCP released results and iBEAT V2.0 processed results.
i. Comparison between the dHCP released results and the iBEAT V2.0 processed results on two randomly selected subjects in the dHCP dataset. i.( a ) T2w images; i.( b ) Gray matter and white matter tissue boundaries from iBEAT V2.0 segmentation (green) and the dHCP released segmentation (red); i.( c ) Color-coded vertex-wise surface distance maps between iBEAT V2.0 reconstructed inner surfaces and dHCP inner surfaces; i.( d ) Color-coded vertex-wise surface distance maps between our reconstructed outer surfaces and dHCP outer surfaces; i.( e ) Close-up views of our reconstructed inner and outer surfaces in i.(c) and i.(d); i.( f ) Close-up views of the dHCP released inner and outer surfaces in i.(c) and i.(d). ii. Quantitative comparison between iBEAT V2.0 results and the dHCP released results. ii.(a) The Dice ratio of the gray matter and white matter; ii.(b) The average surface distance (ASD, mm) of the gray matter and white matter. iii. Comparison of the reconstructed cortical surfaces (colored-coded by mean curvature) in the occipital lobe of a typical subject using the dHCP pipeline and iBEAT V2.0 pipeline. iii.(a) The posterior view. iii.(b) The medial view of the left hemisphere. iii. (c) The medial view of the right hemisphere.
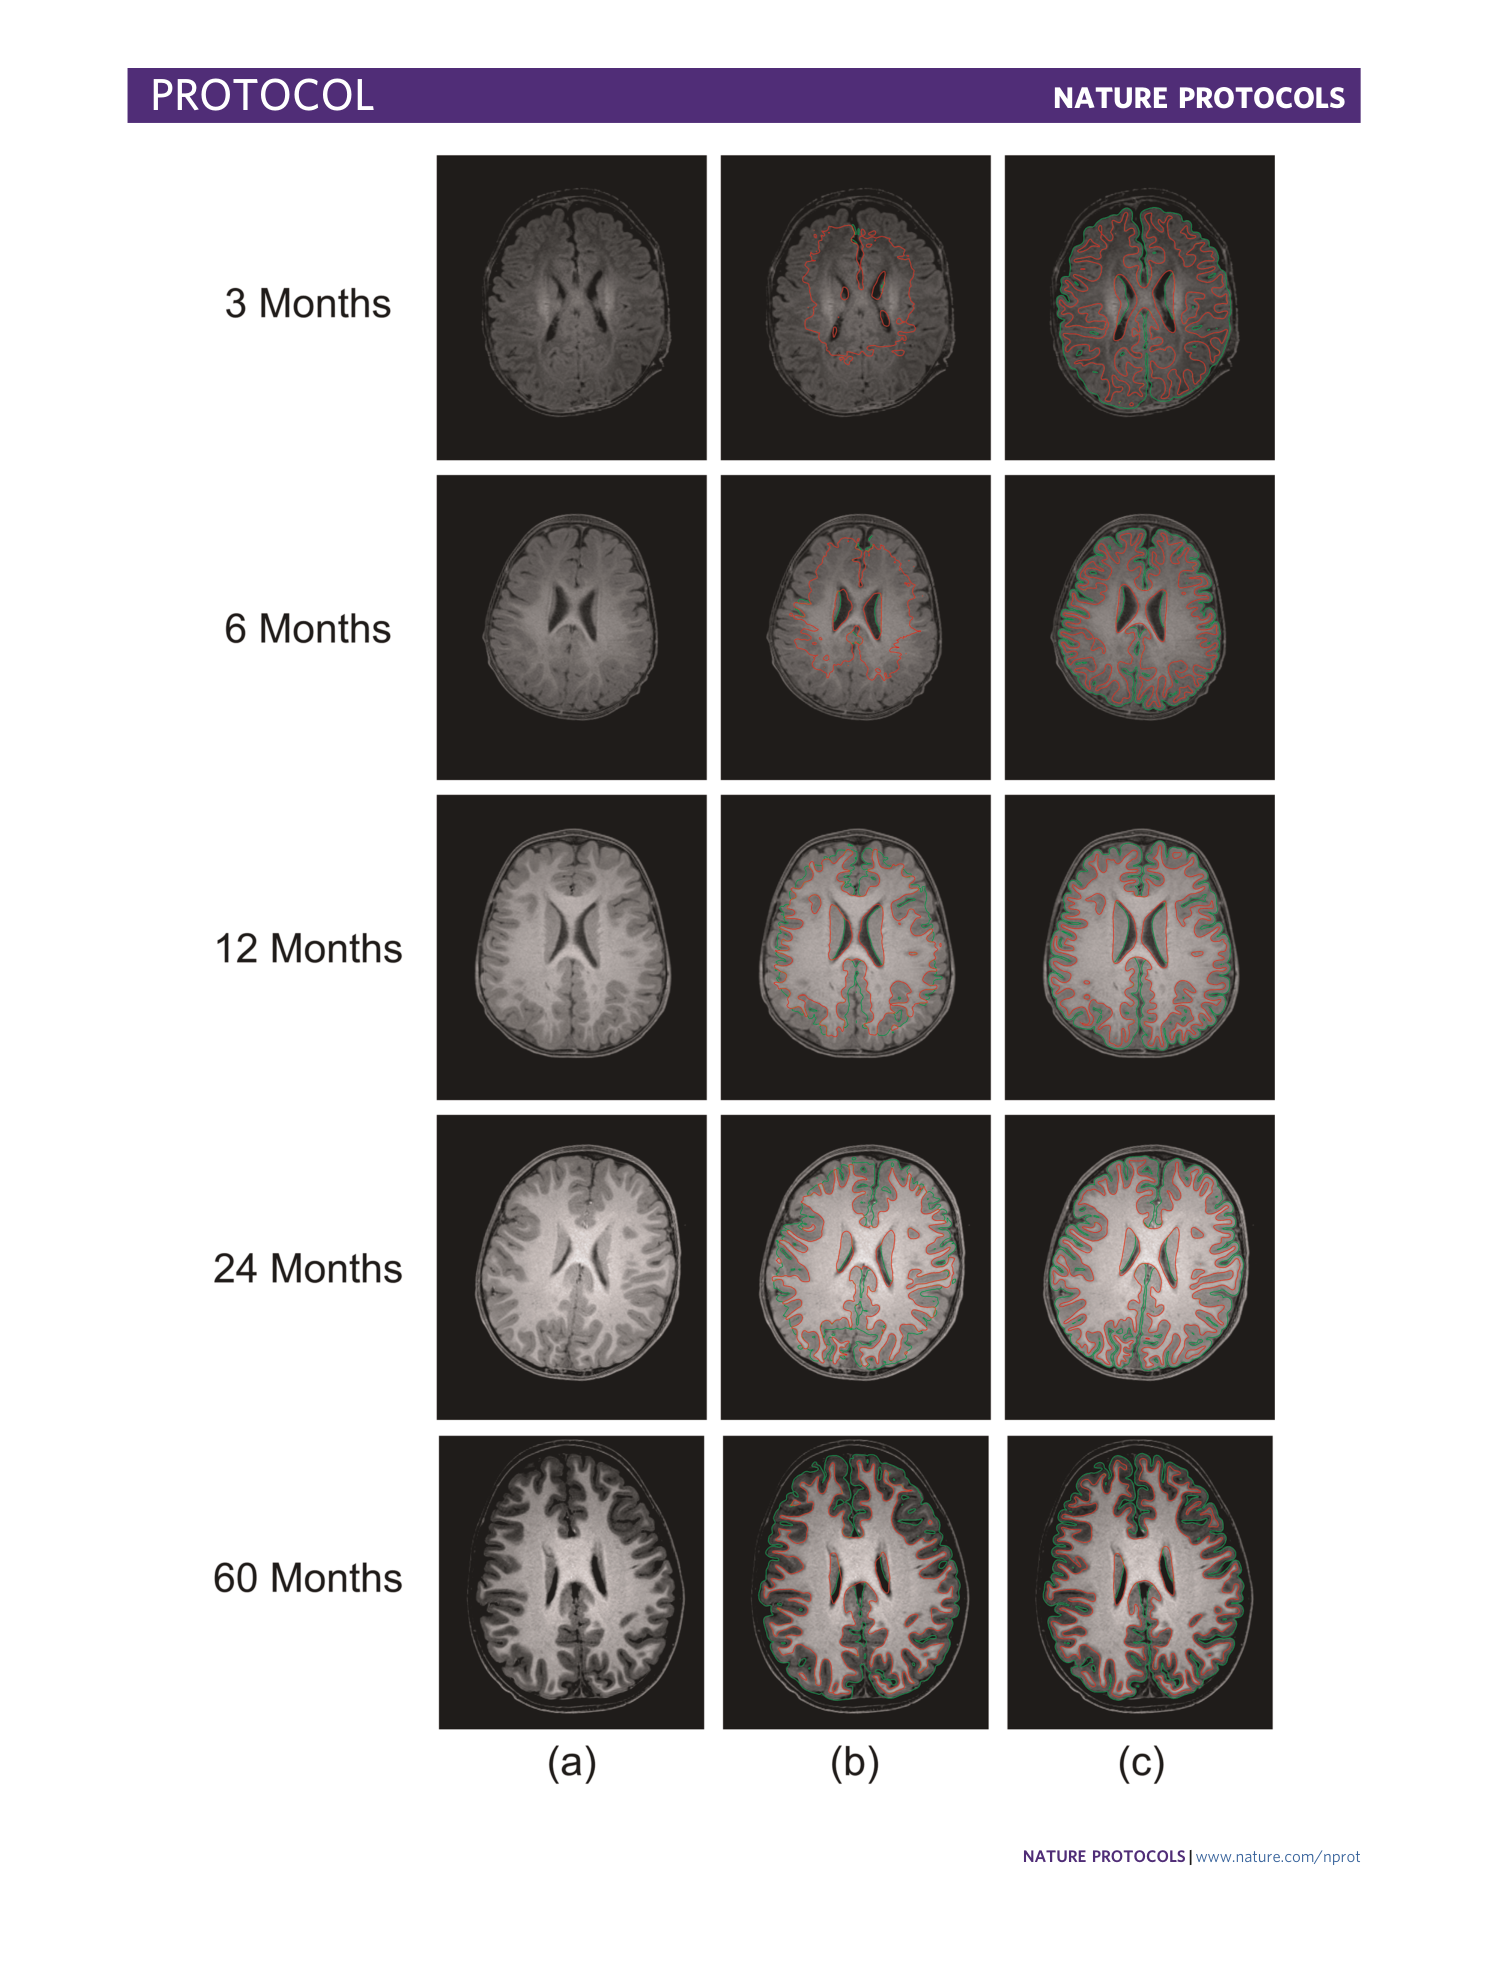
Extended Data Fig. 3 Comparison of the processed results using the FastSurfer pipeline and iBEAT V2.0 pipeline on different subjects (of different ages) from the BCP dataset.
( a ). T1w images. ( b ) FastSurfer processed results. ( c ) iBEAT V2.0 processed results. The green contours in the figure indicate gray matter boundaries, and the red contours indicate white matter boundaries. Since FastSurfer is mainly developed for adult brains, two comparison pipelines achieved comparable results for the 60-month-old subject.
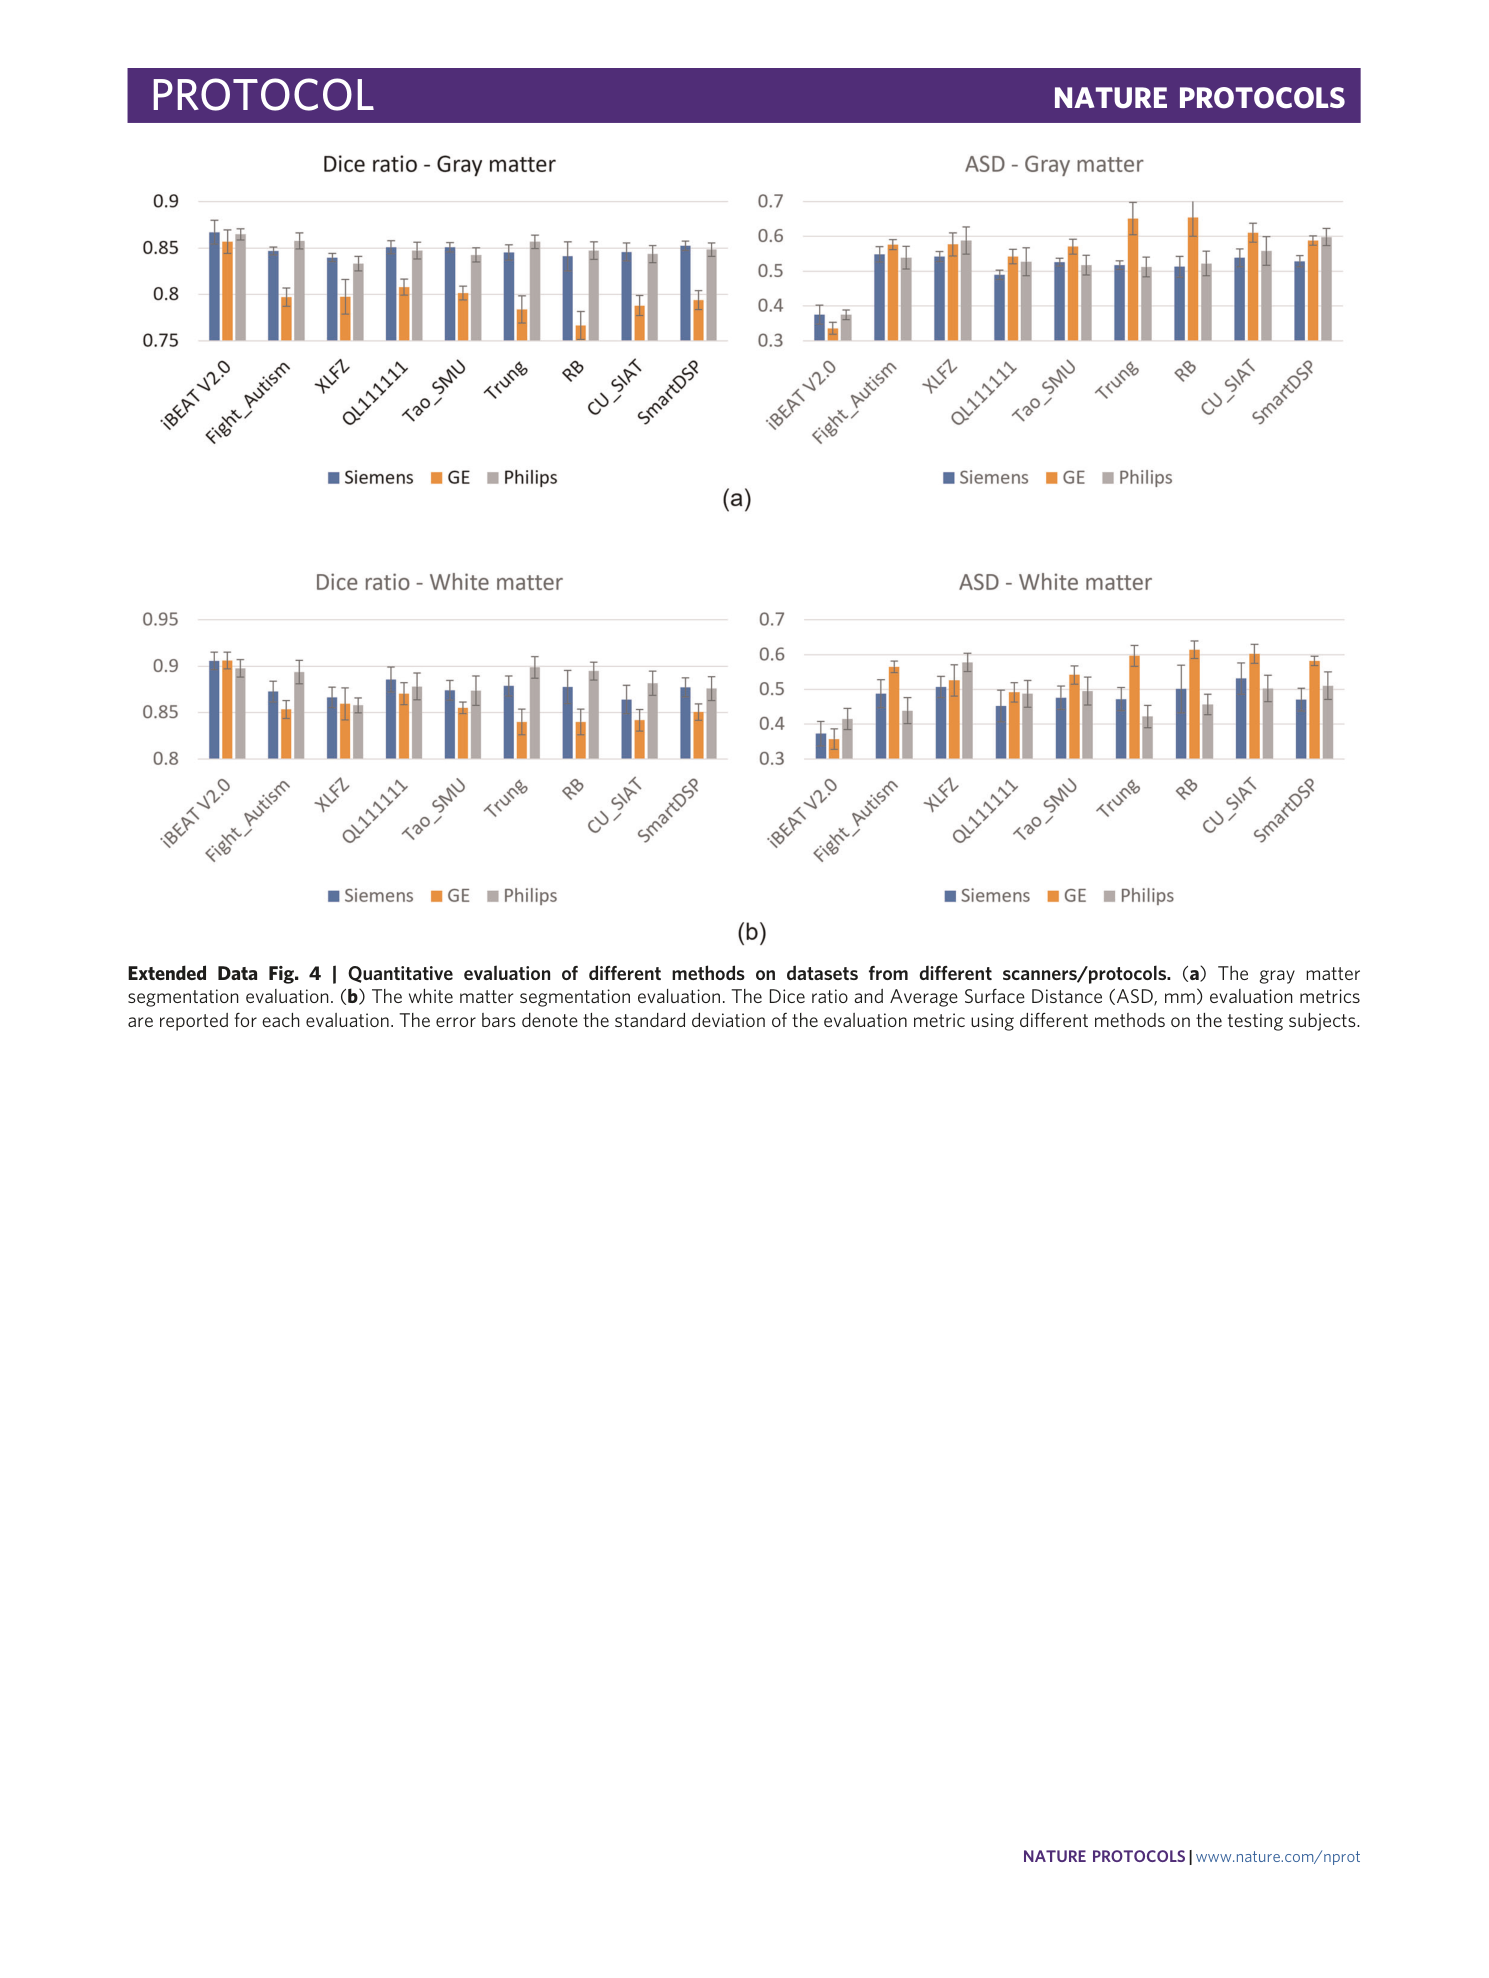
Extended Data Fig. 4 Quantitative evaluation of different methods on datasets from different scanners/protocols.
( a ) The gray matter segmentation evaluation. ( b ) The white matter segmentation evaluation. The Dice ratio and Average Surface Distance (ASD, mm) evaluation metrics are reported for each evaluation. The error bars denote the standard deviation of the evaluation metric using different methods on the testing subjects.
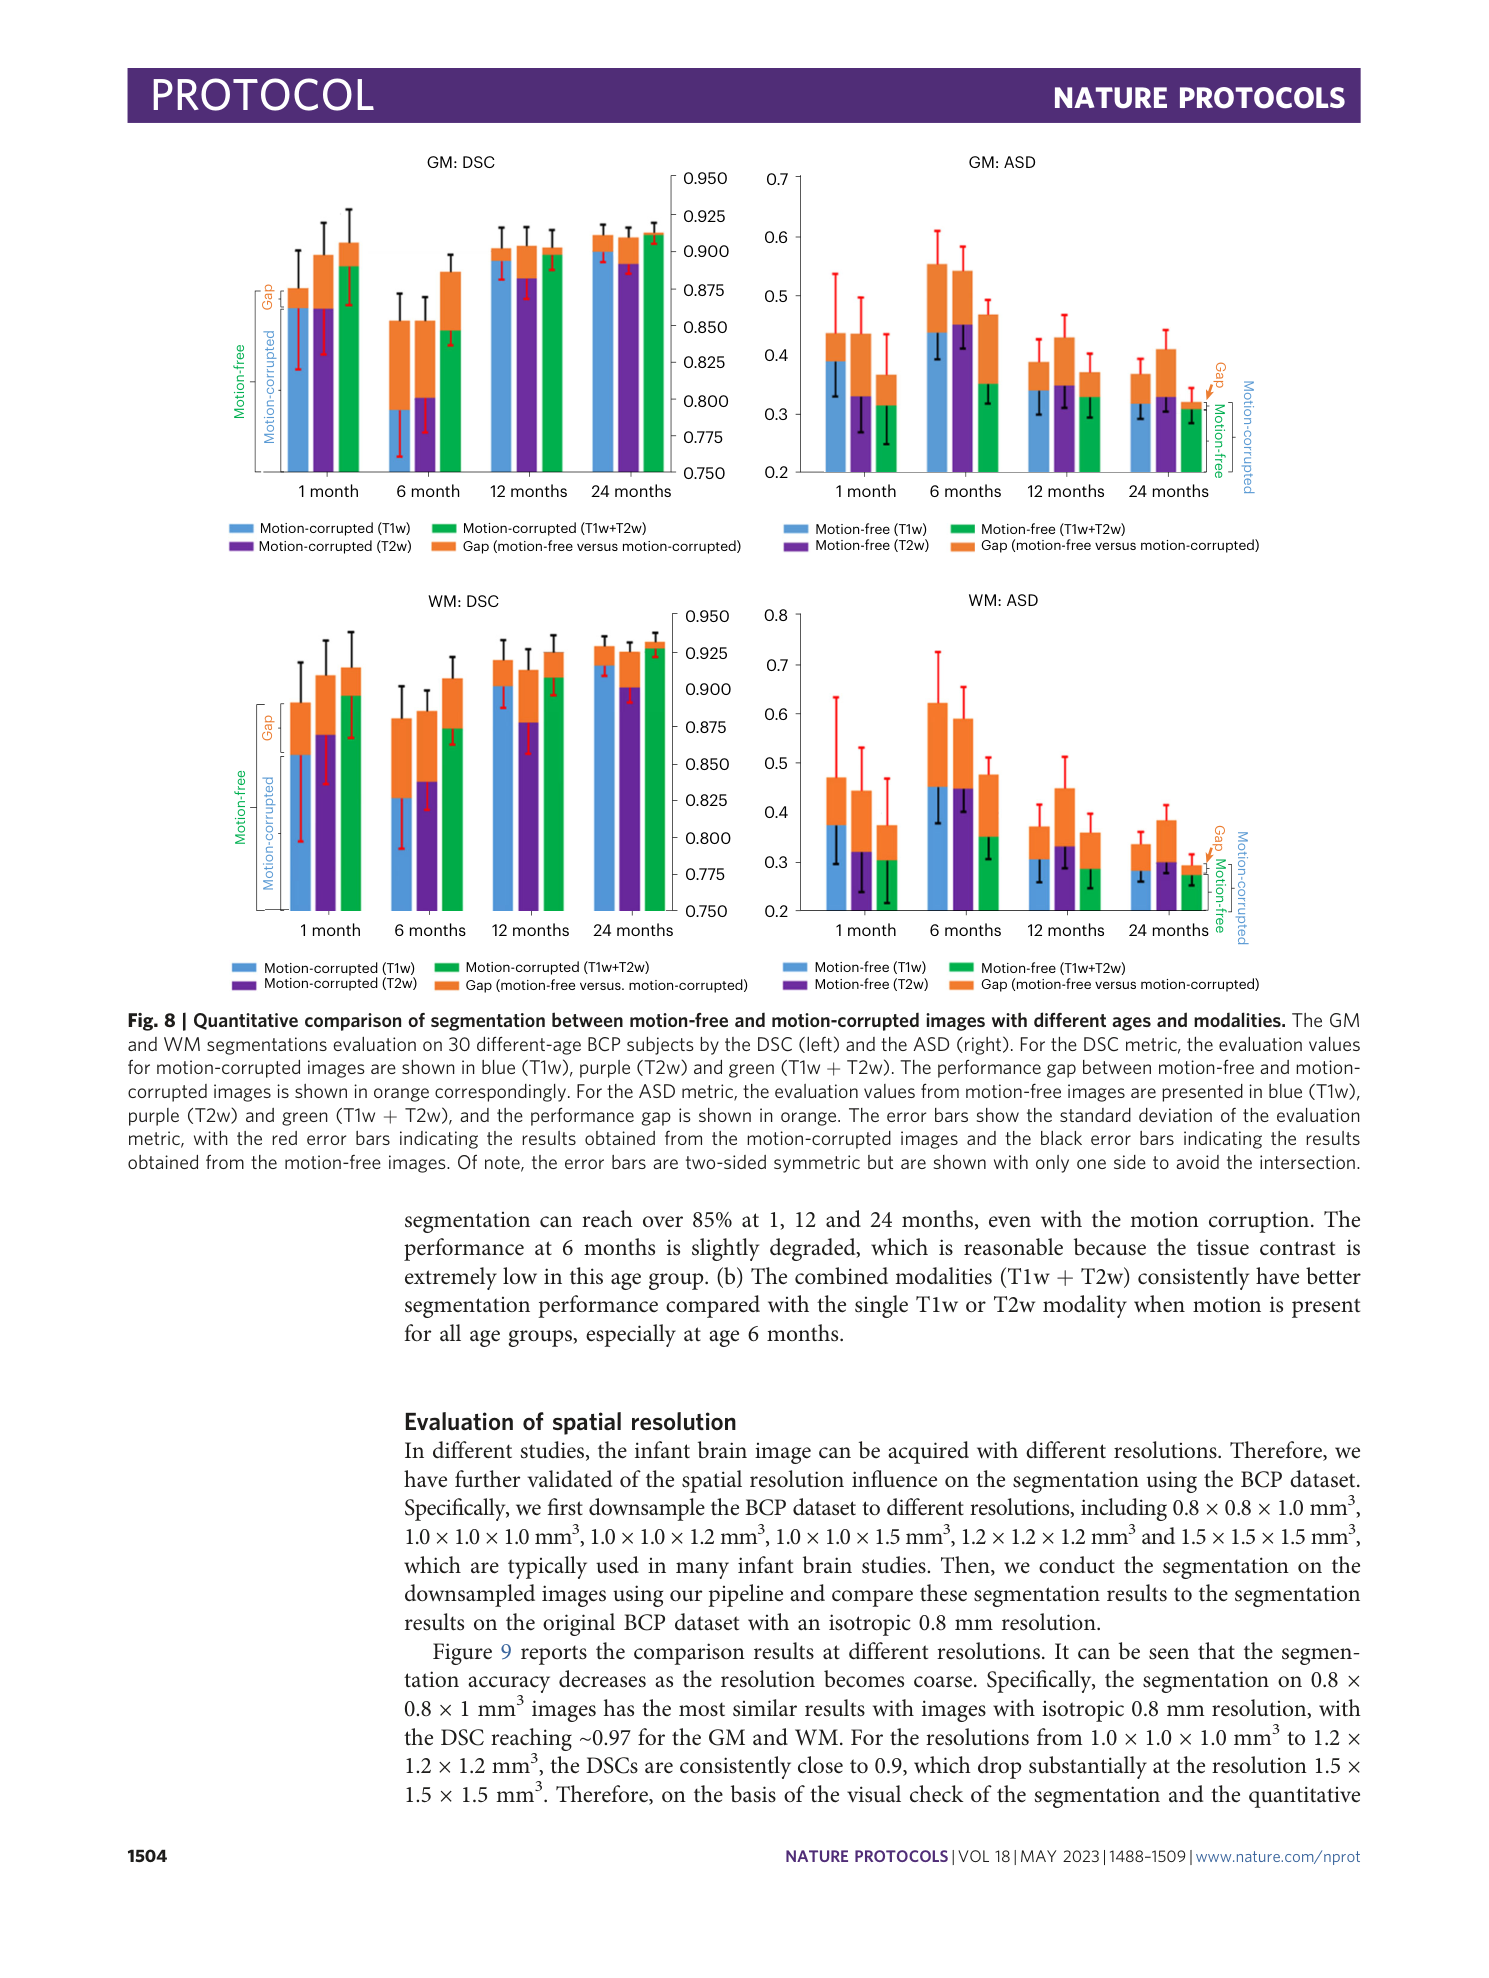
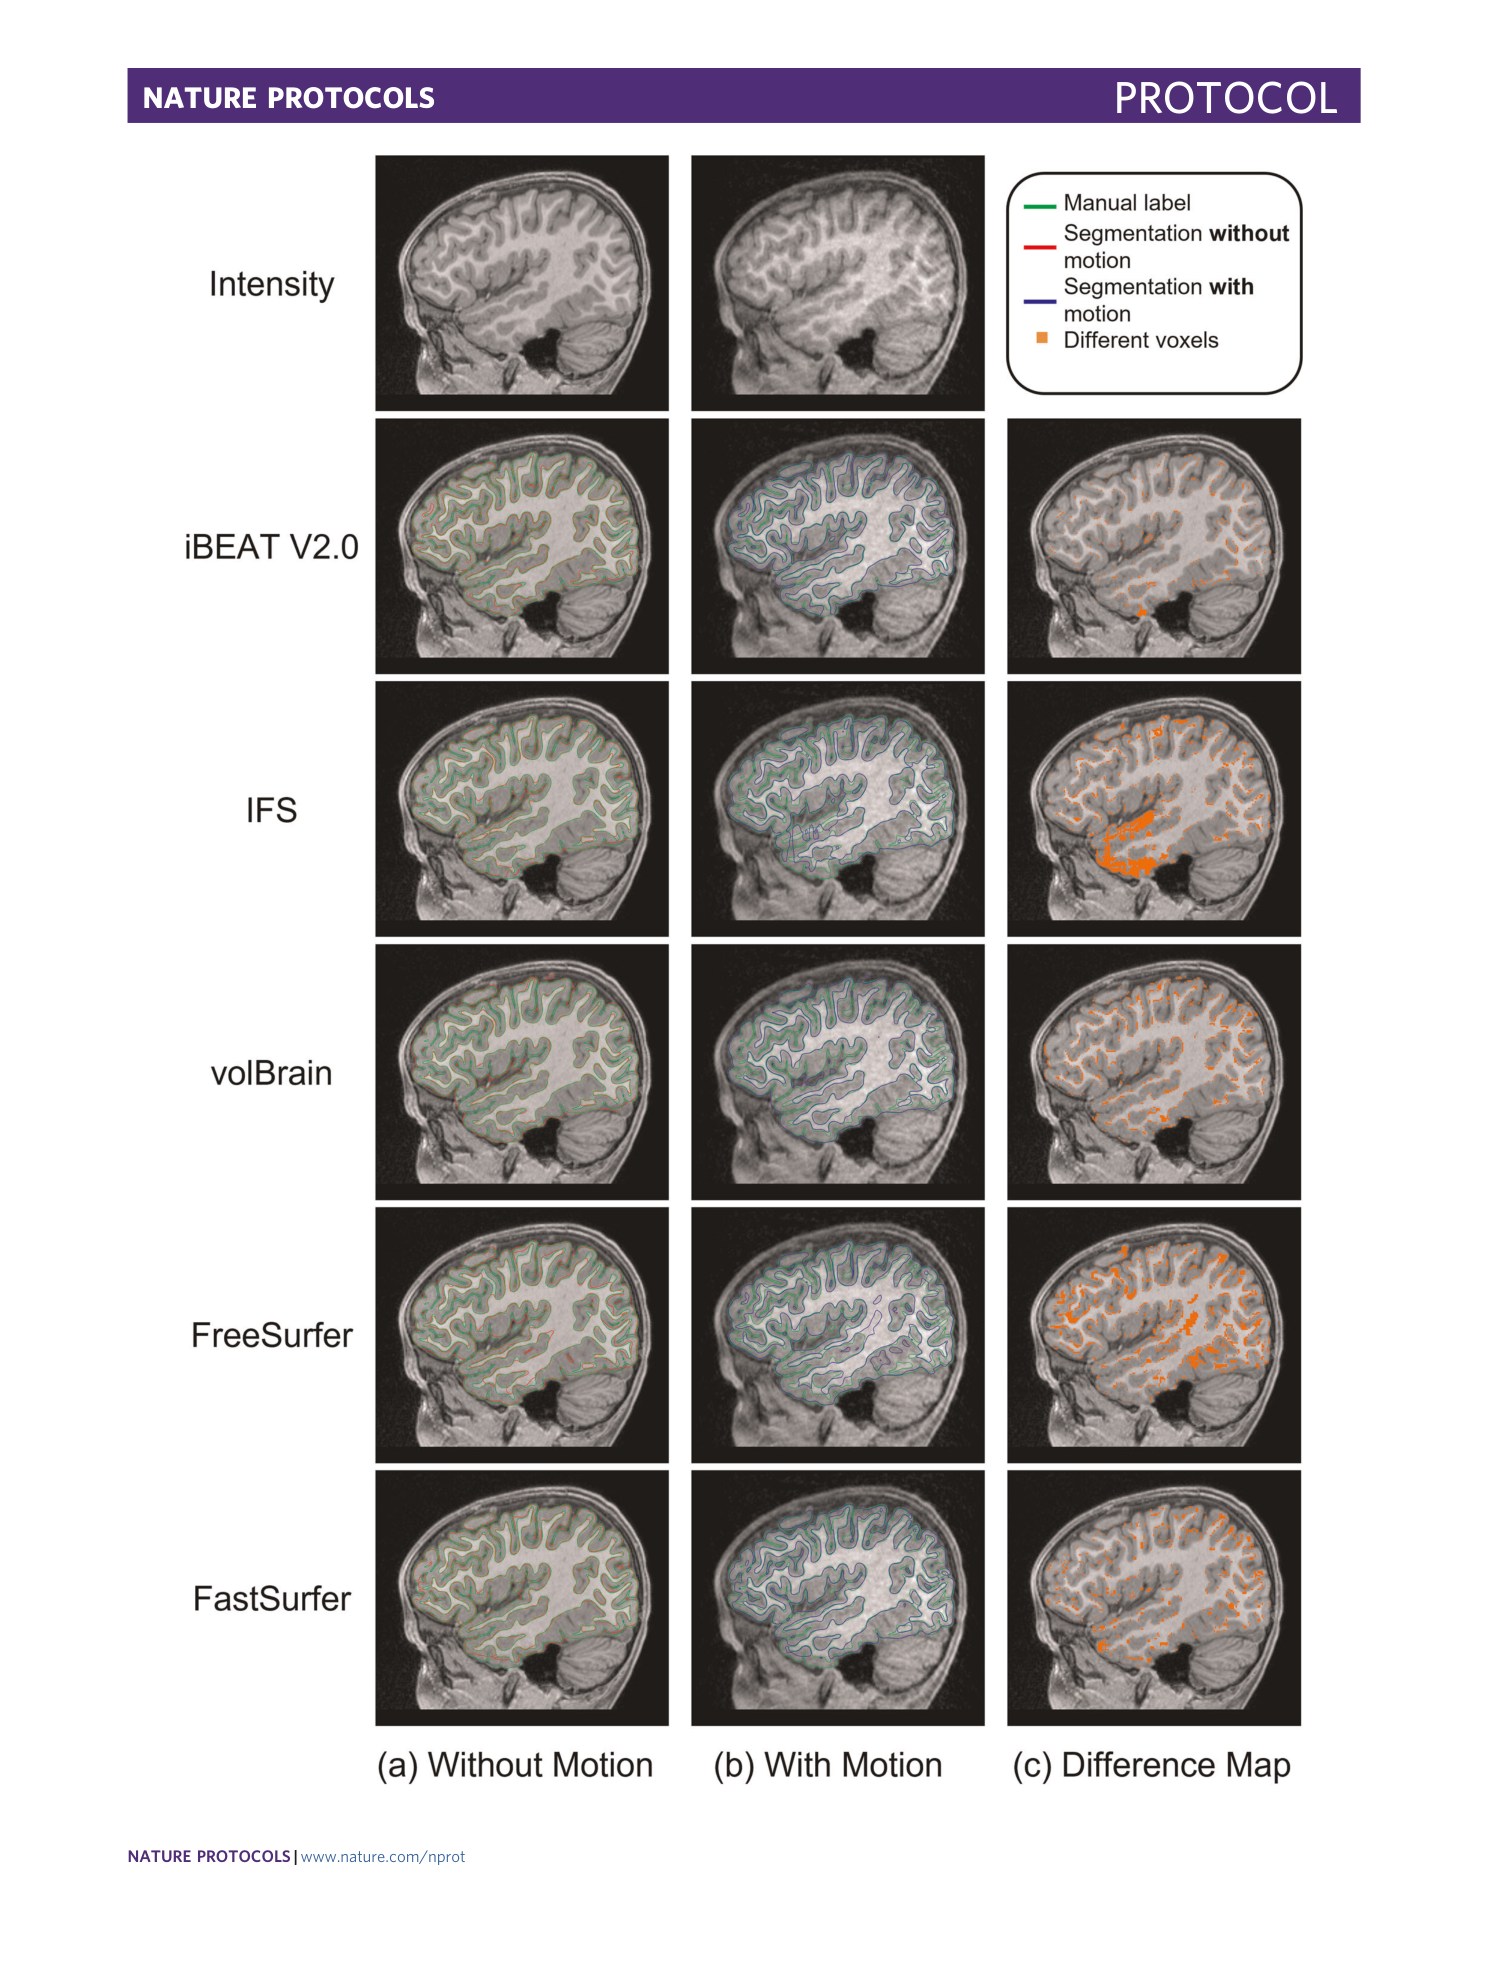
Extended Data Fig. 5 Comparison of segmentation results by typical pipelines for 5 images from the BCP dataset with and without motion artifacts.
( a ) Results for images without motion artifacts. ( b ) Results for images with motion artifacts. ( c ) Difference maps of the segmentation results with and without motion artifacts. Since IFS, volBrain, FreeSurfer, and FastSurfer mainly use T1w images as input, we also only used T1w images for a fair comparison.
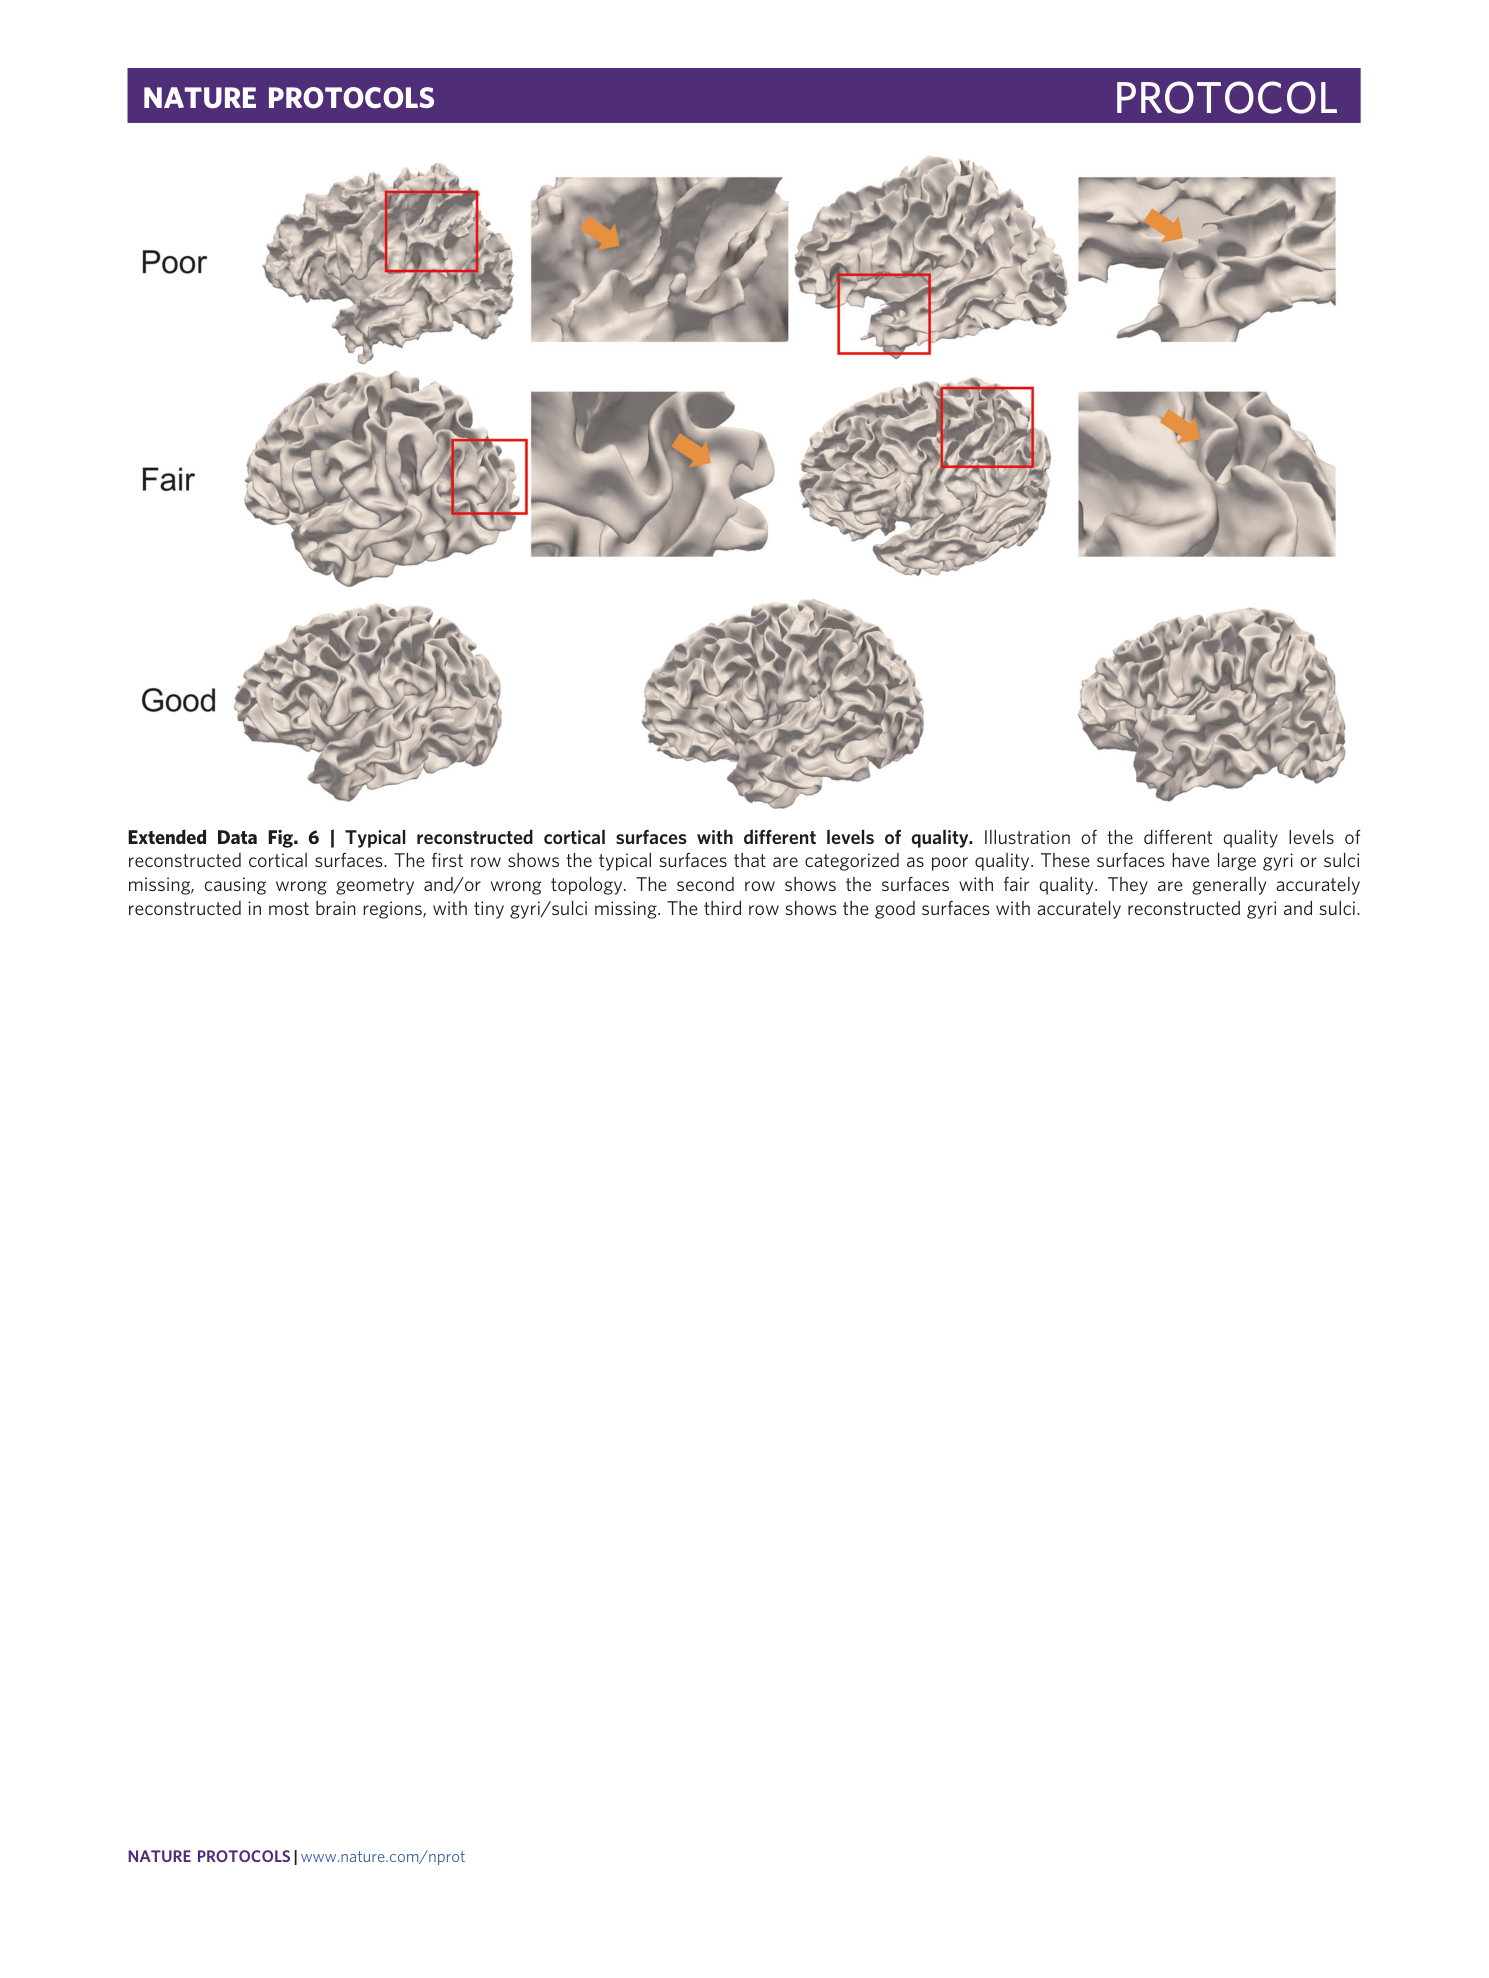
Extended Data Fig. 6 Typical reconstructed cortical surfaces with different levels of quality.
Illustration of the different quality levels of reconstructed cortical surfaces. The first row shows the typical surfaces that are categorized as poor quality. These surfaces have large gyri or sulci missing, causing wrong geometry and/or wrong topology. The second row shows the surfaces with fair quality. They are generally accurately reconstructed in most brain regions, with tiny gyri/sulci missing. The third row shows the good surfaces with accurately reconstructed gyri and sulci.
