Standardized production of hPSC-derived cardiomyocyte aggregates in stirred spinner flasks
Ulrich Martin, Lika Drakhlis, Robert Zweigerdt, Felix Manstein, Nils Kriedemann, Wiebke Triebert, Jana Teske, Mira Mertens, Annika Franke, Kevin Ullmann, Alexandra Haase, Caroline Halloin
hPSC-derived cardiomyocytes
GMP-compliant production
spinner flasks
WNT-pathway modulation
cell aggregate production
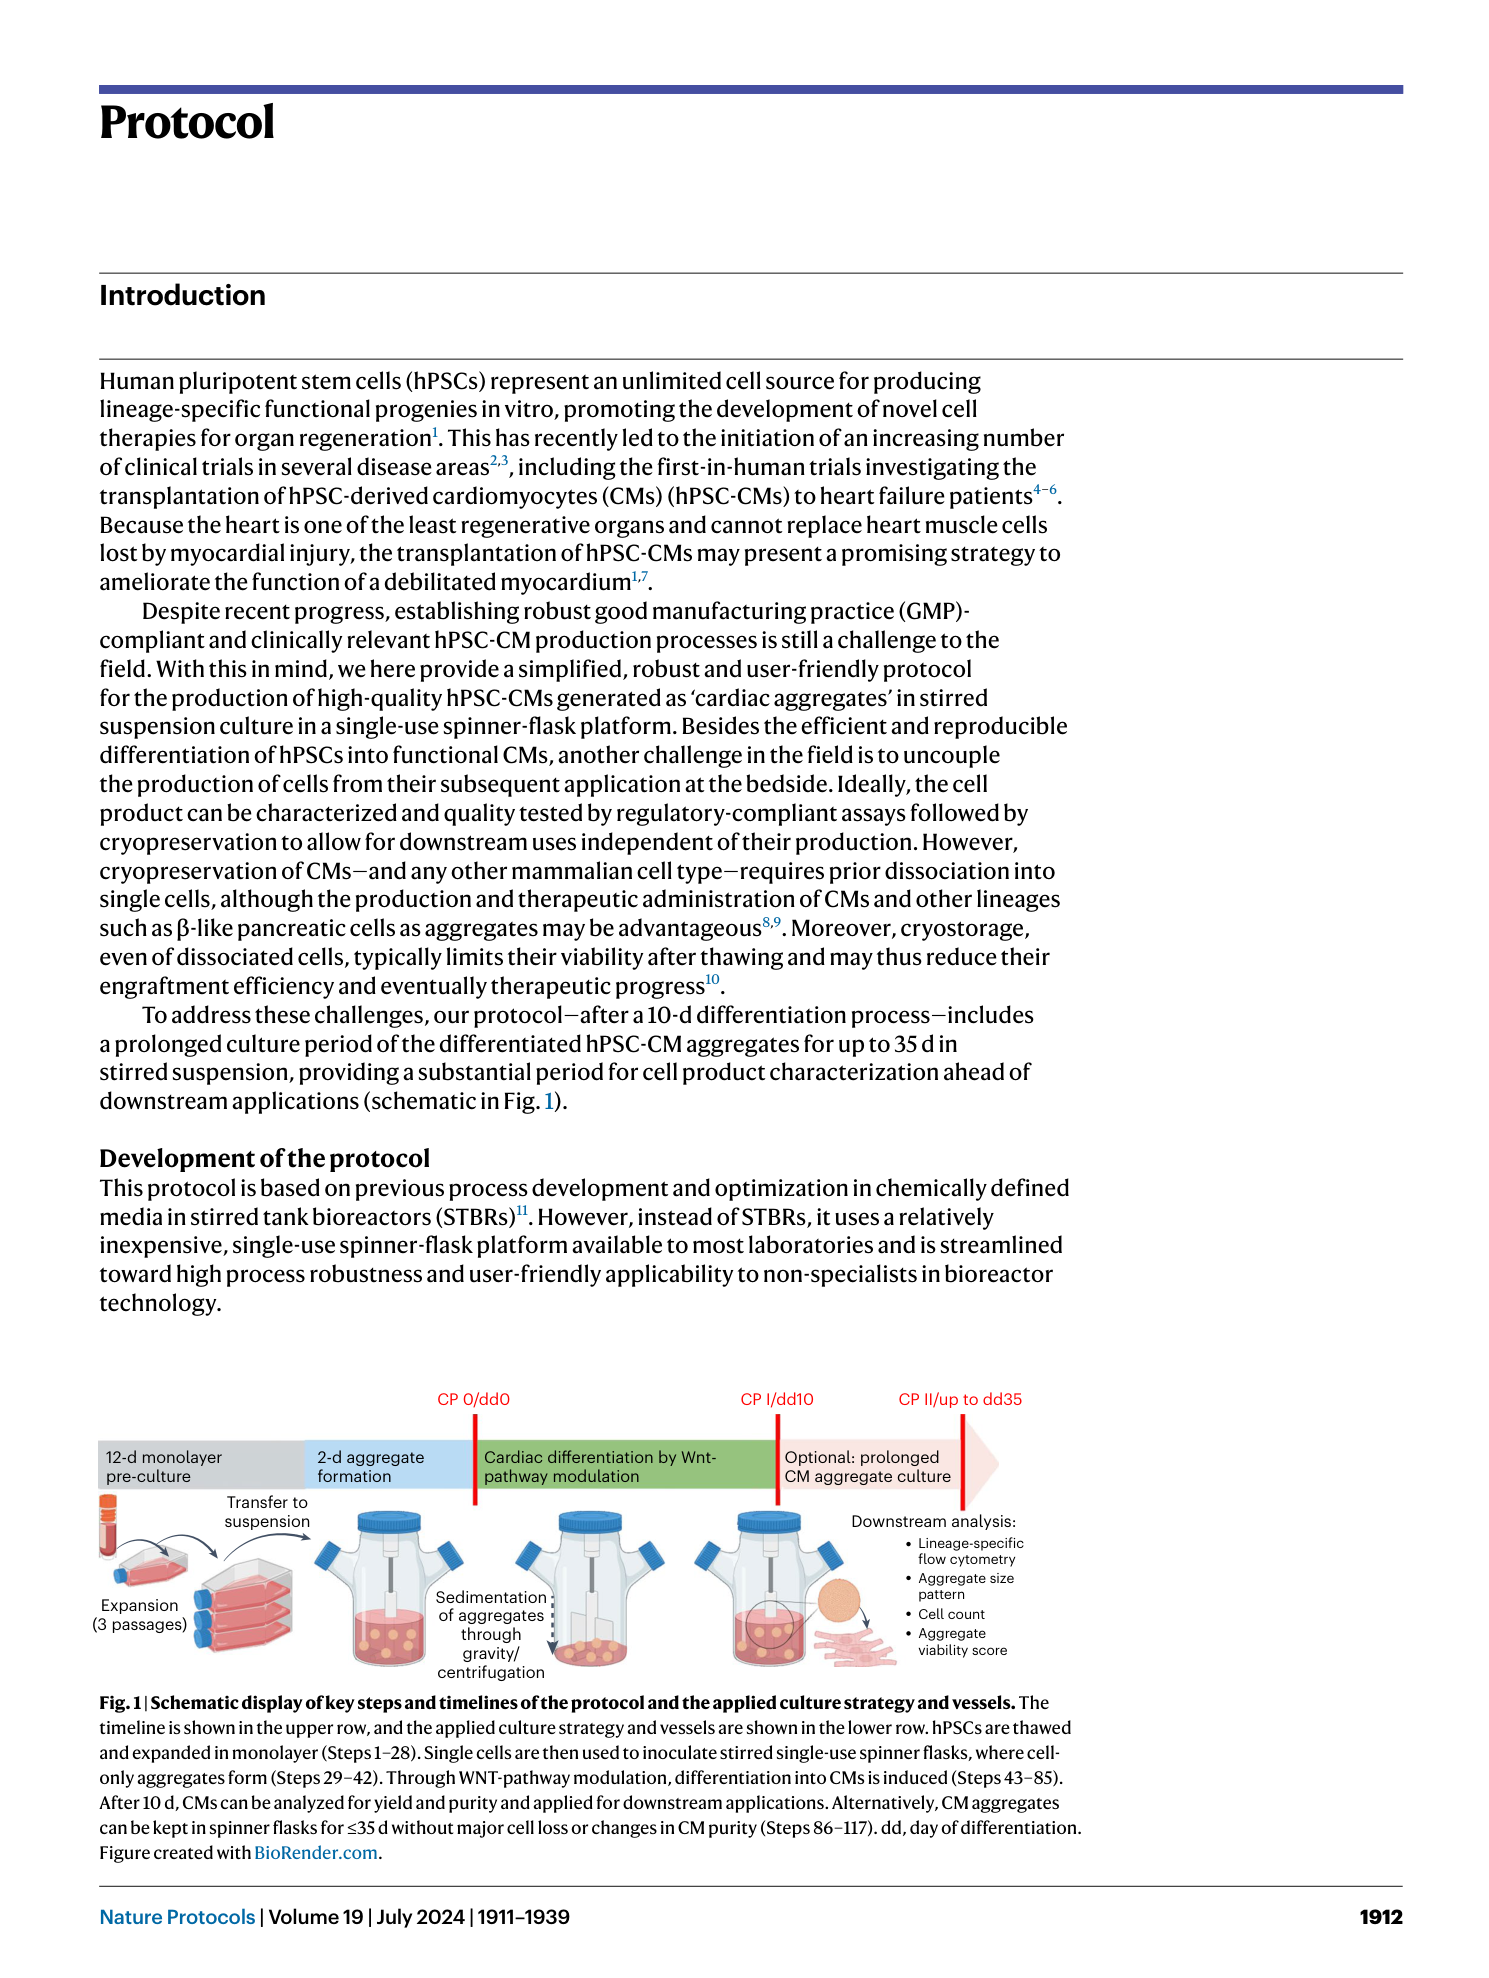
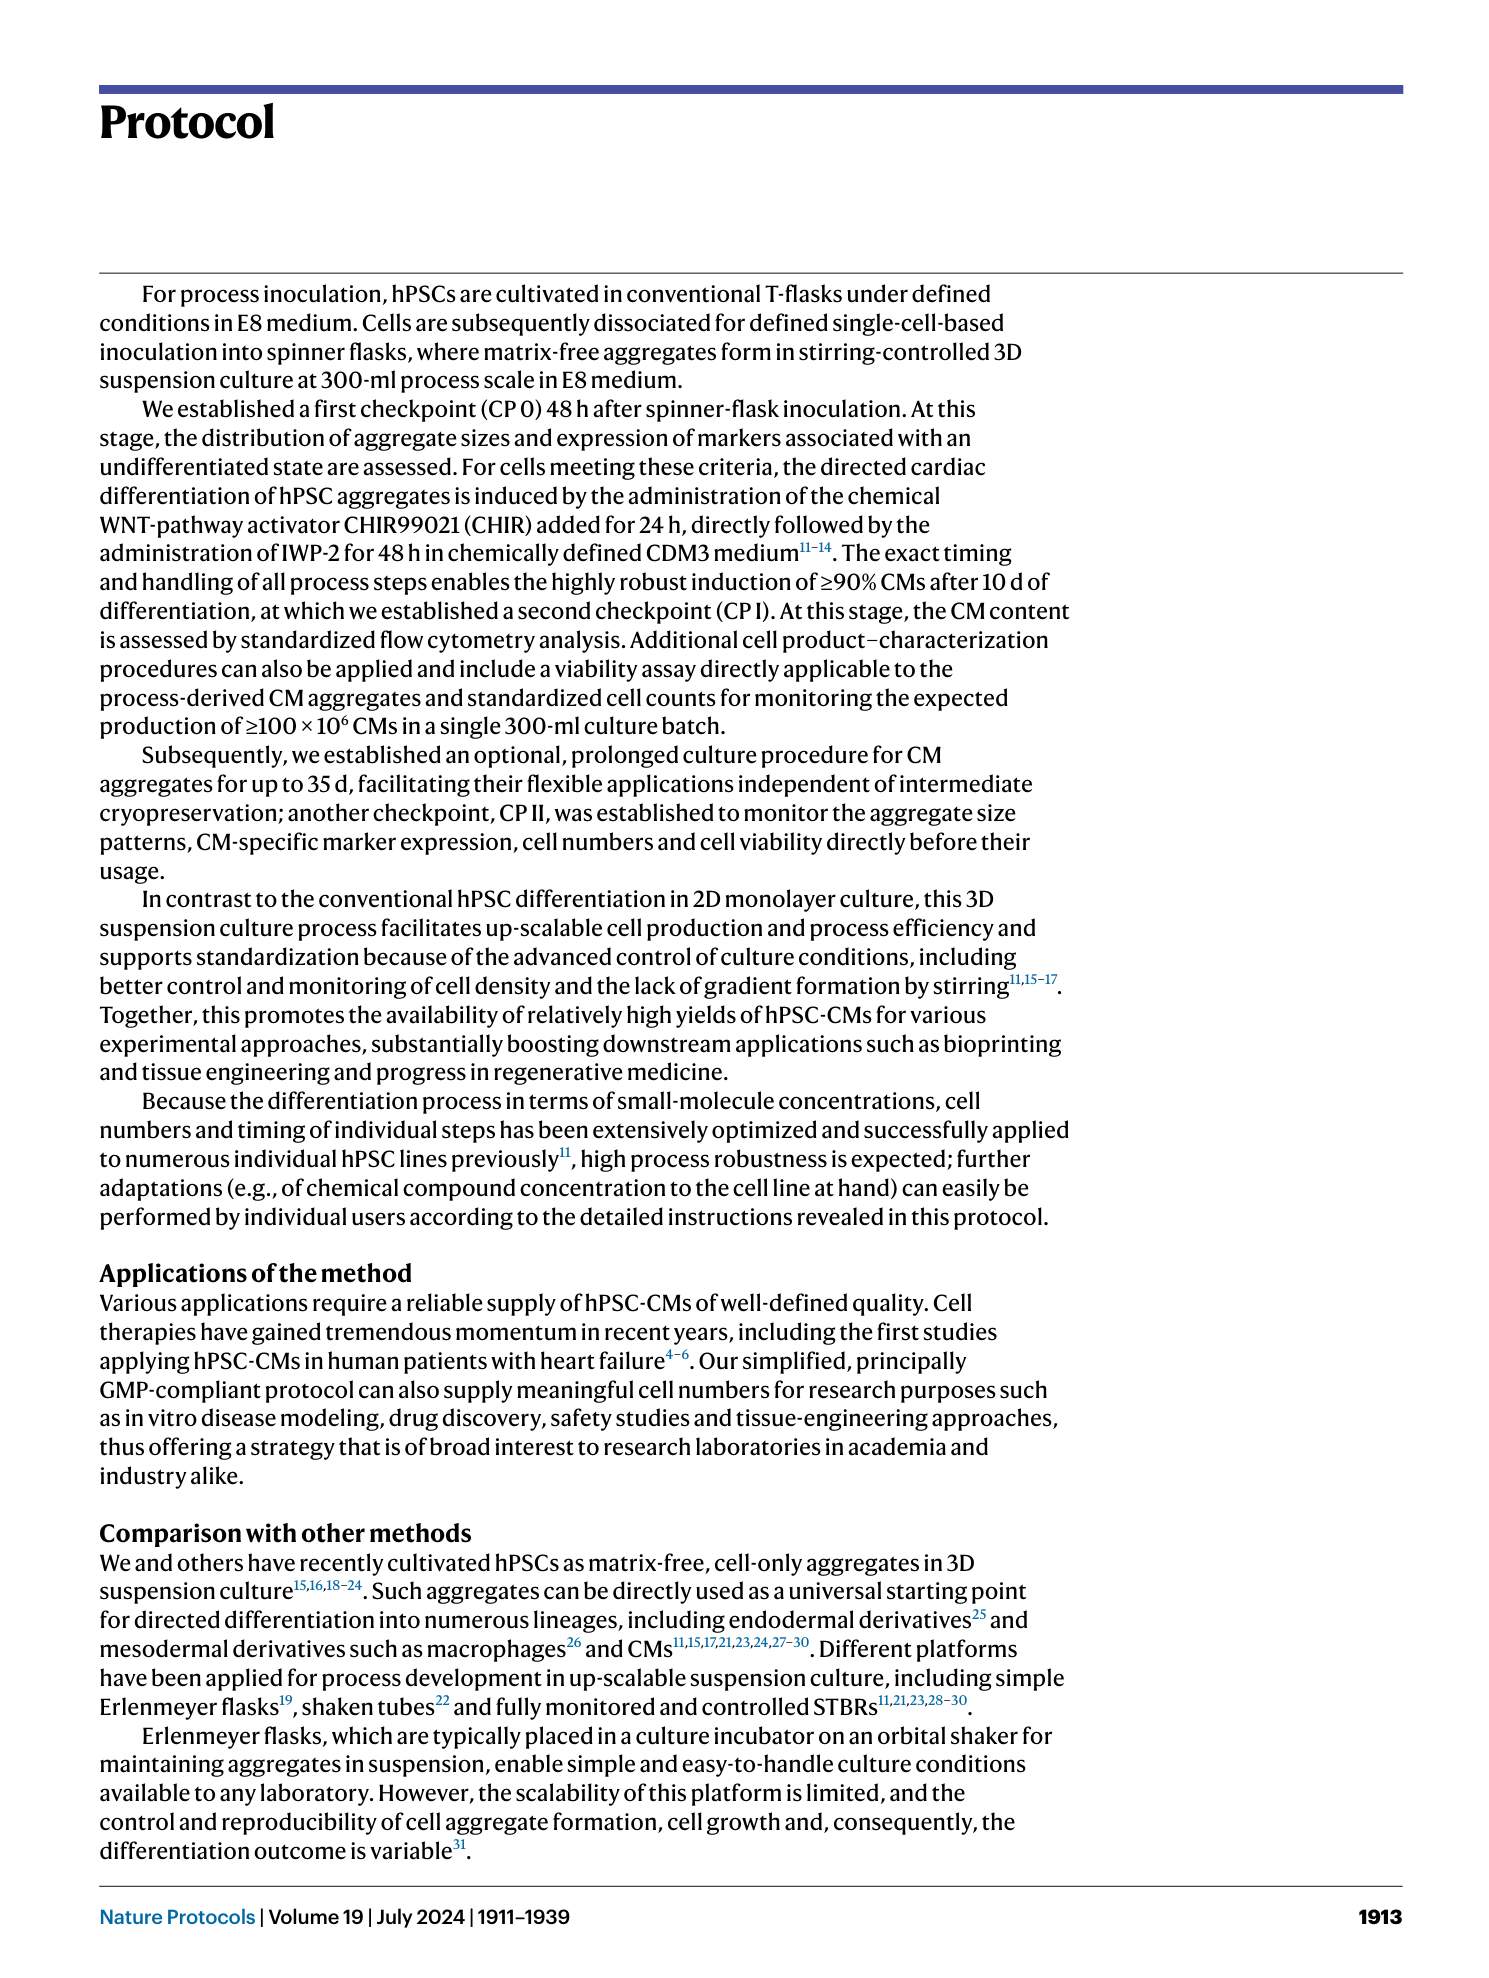
Extended
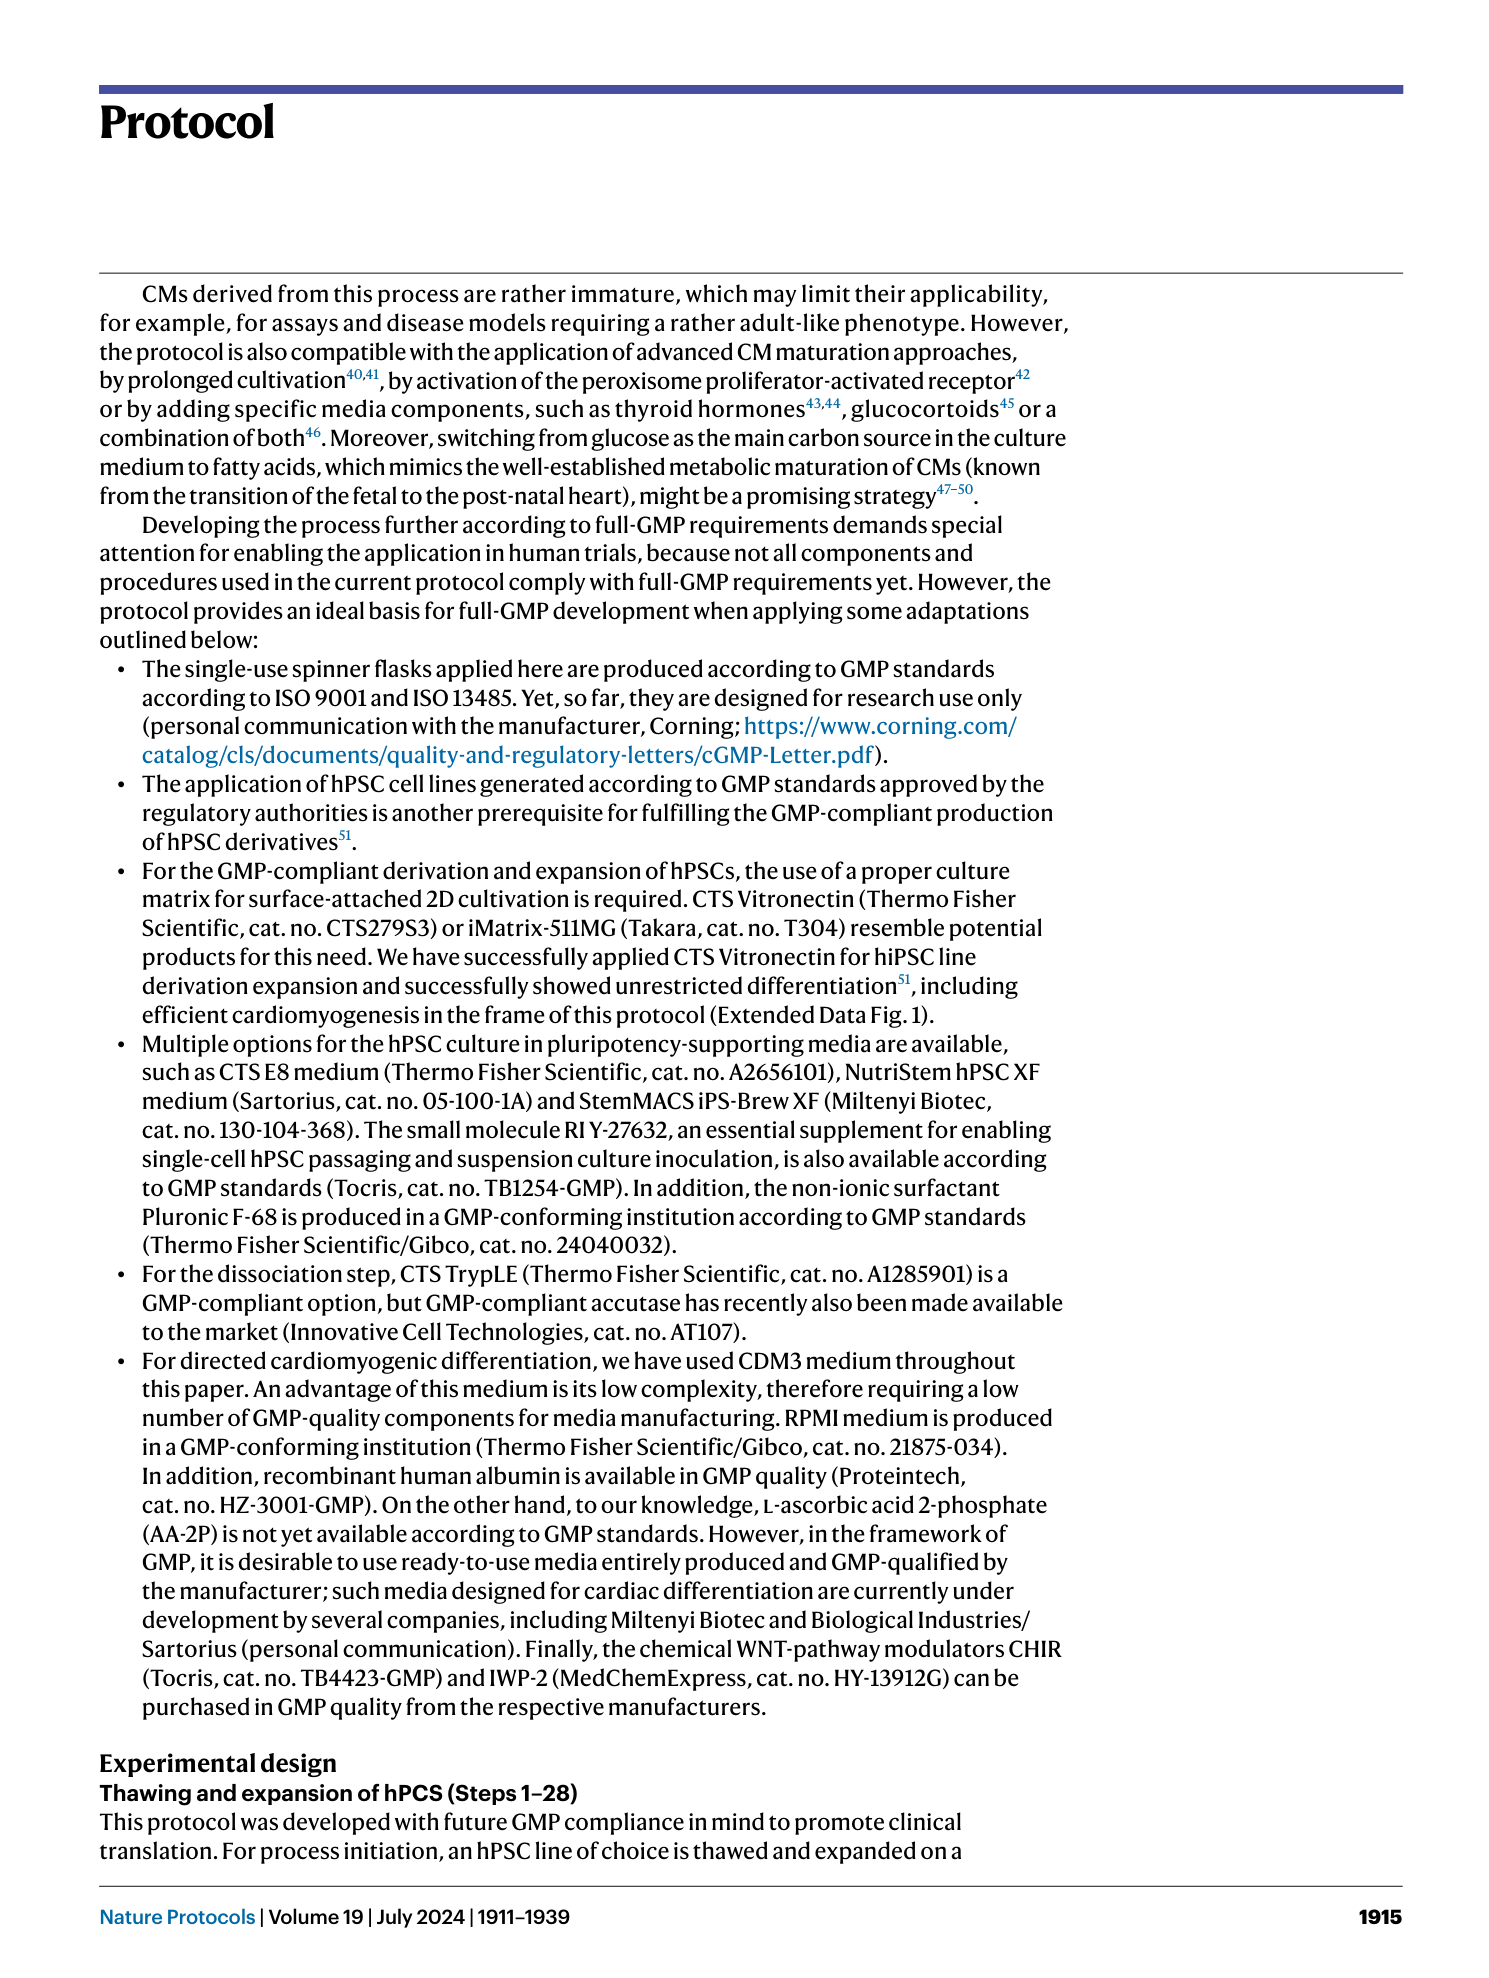
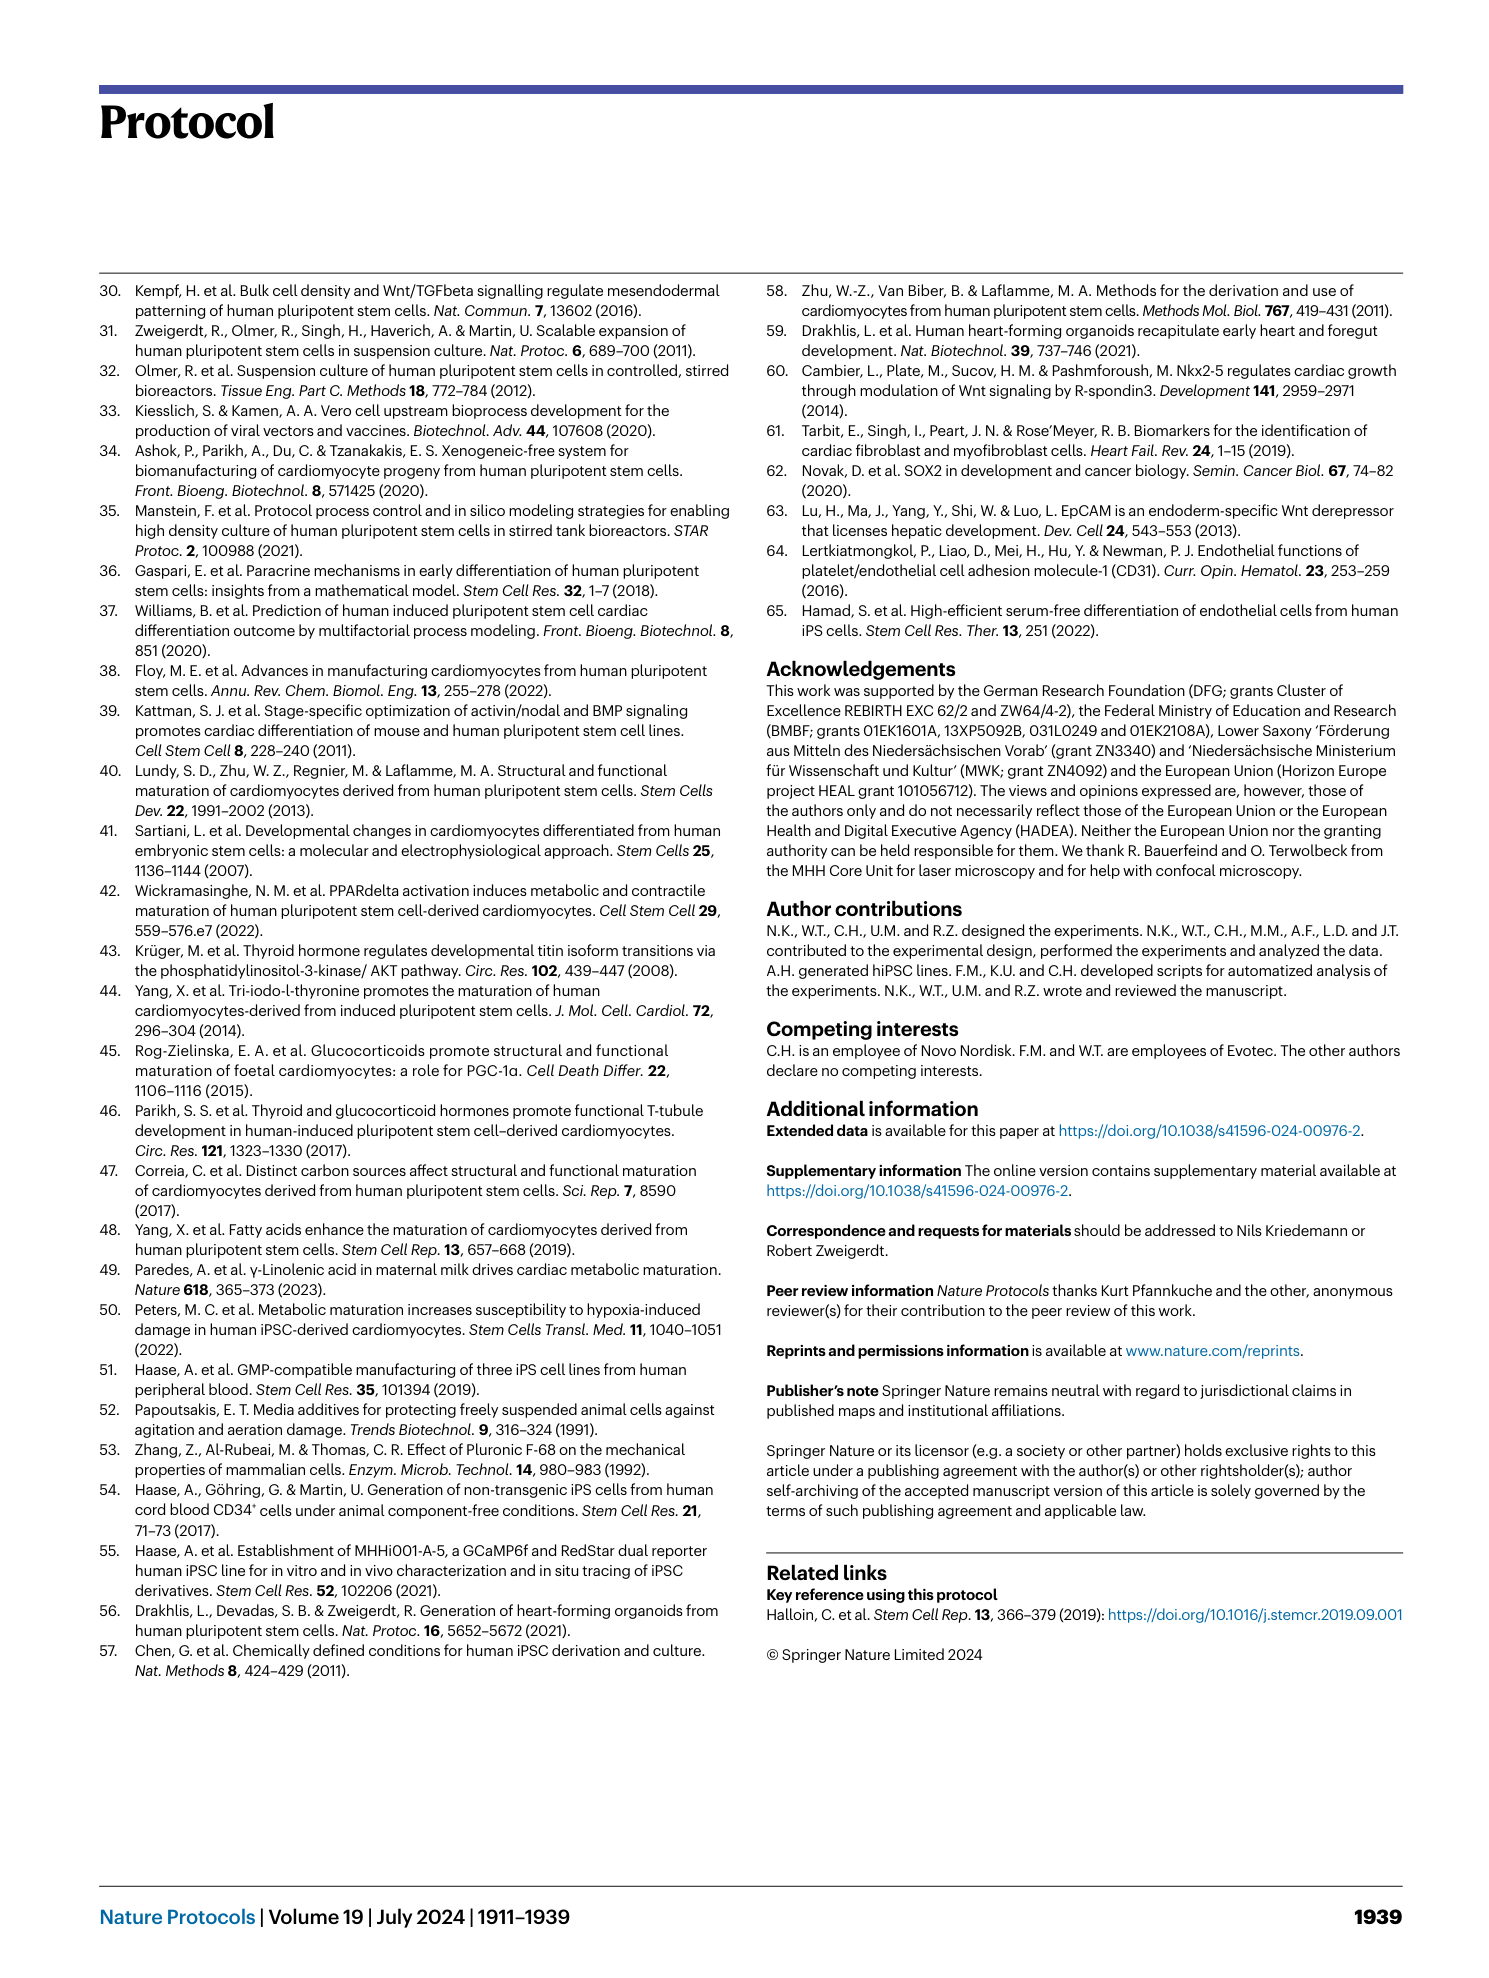
Extended Data Fig. 1 Exemplary production of hiPSC-derived cardiomyocytes from vitronectin and (GMP-conforming) CTS vitronectin pre-culture.
a and b , Appearance of cells on CTS vitronectin ( a ) and vitronectin ( b ) on day −2 of the production protocol in monolayer (scale bar, 500 µm). c , Expression of markers of an undifferentiated state at CP 0 before induction of differentiation in samples from spinner flasks pre-cultured on vitronectin or CTS vitronectin. d , Cell yield at CP I of respective spinner-flask runs. e , Aggregate diameter of representative samples taken at CP I from respective spinners. Shown are individual values and mean ± s.d. in red. f , Percentage of cells positive for cardiac markers in representative samples from the respective spinner flasks at CP I.
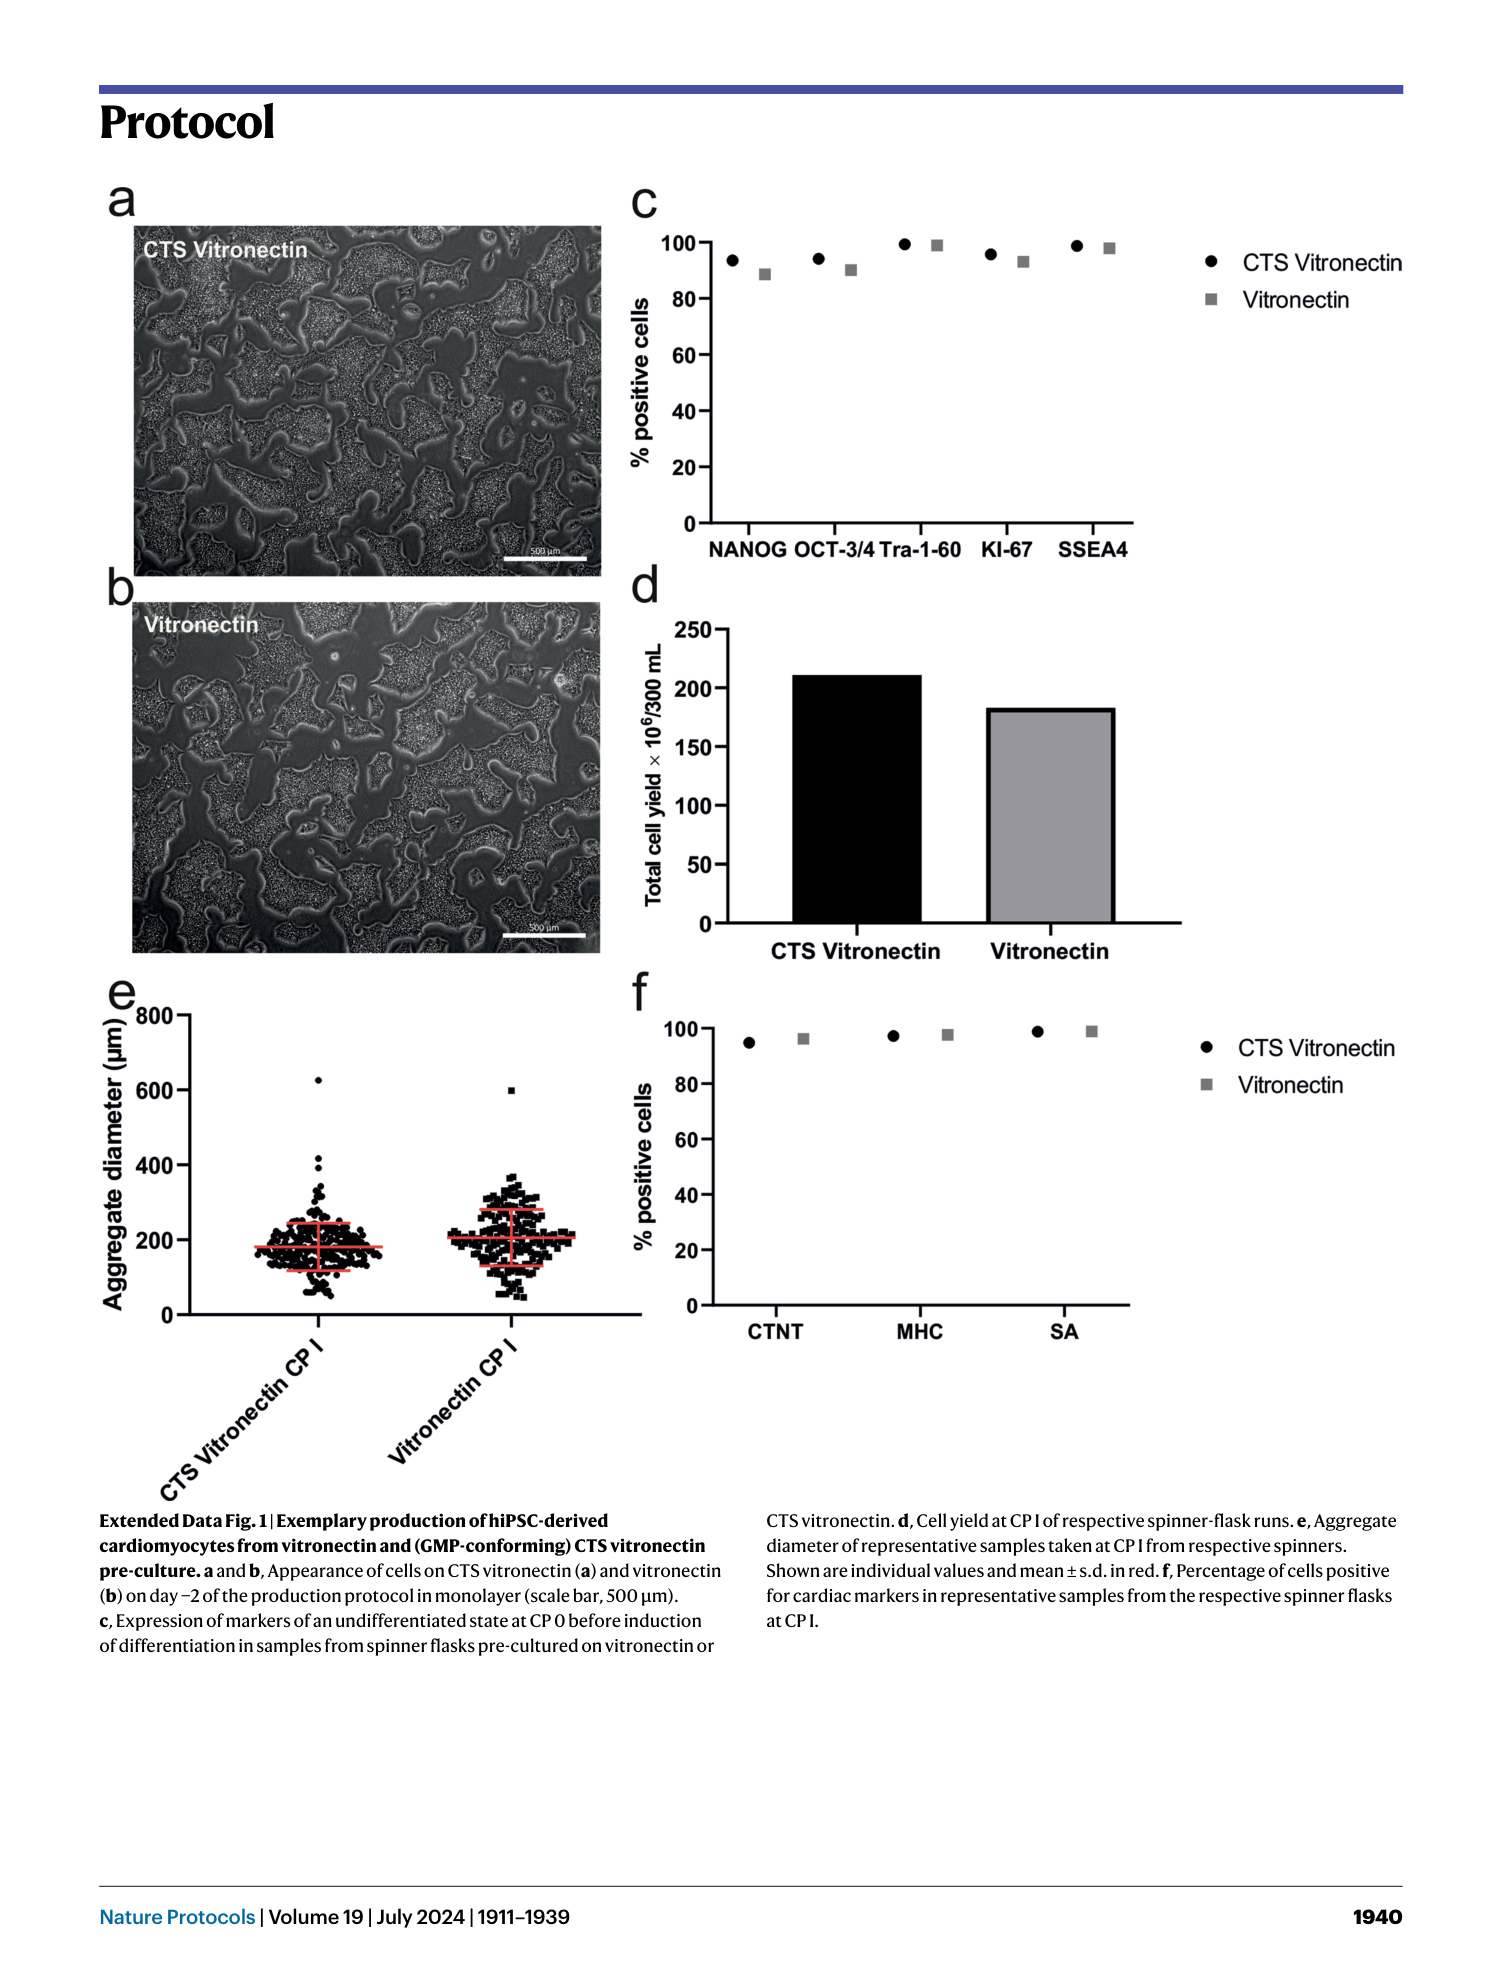
Extended Data Fig. 2 Setup of the spinner flask.
In a sterile environment, unpack from plastic and install the lid with the stirrer. Remove one of the lids for the side ports and install a sampling device (optional).
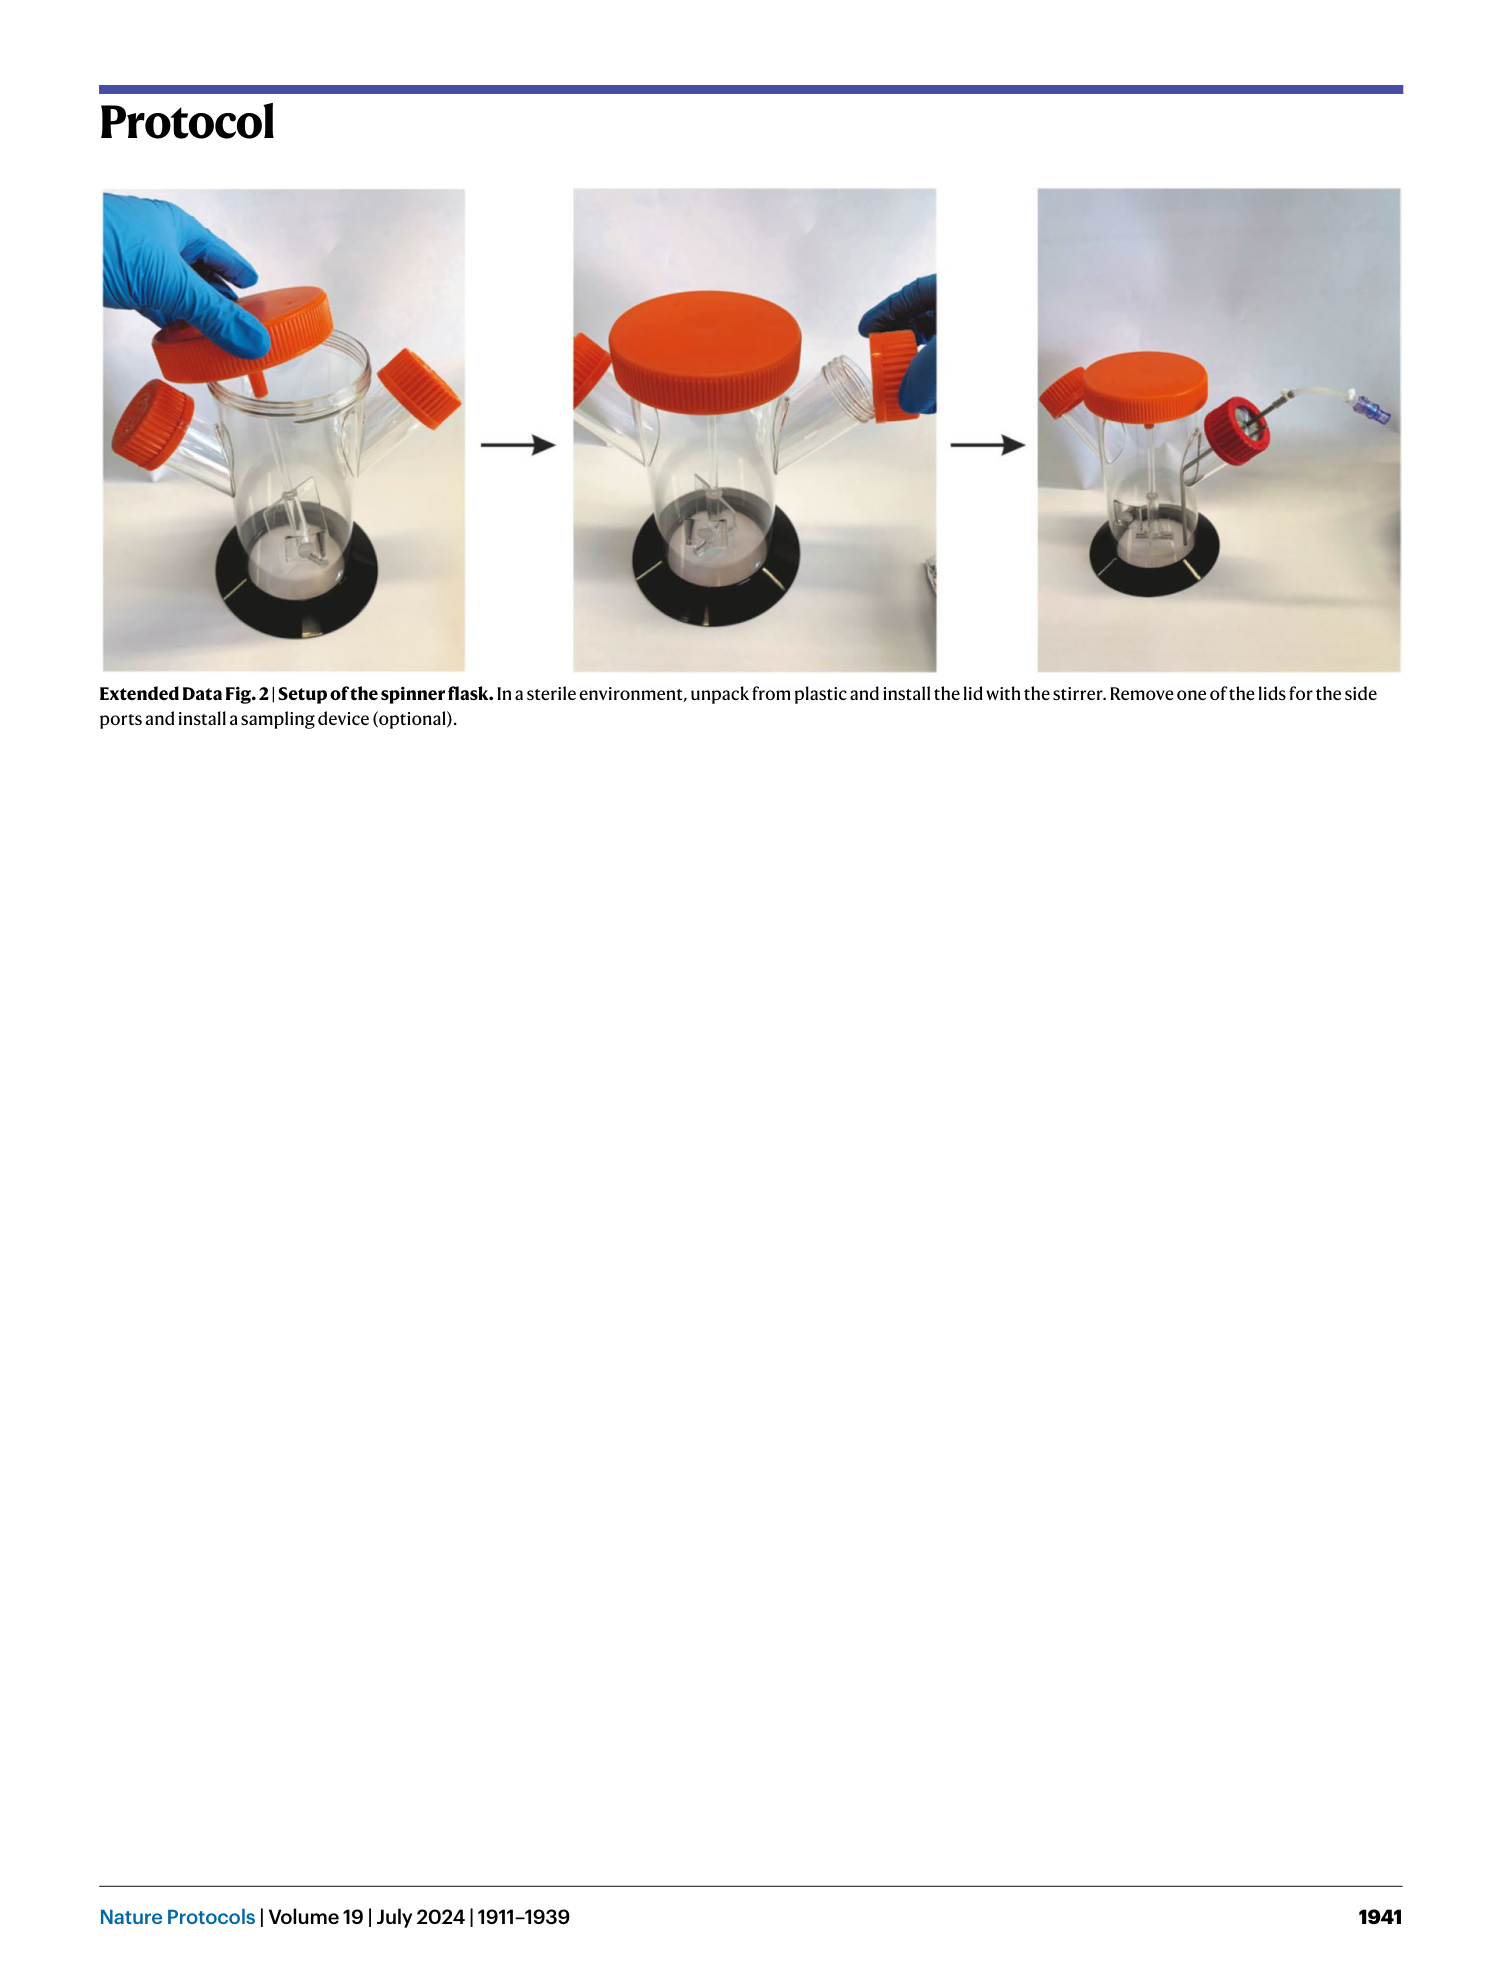
Extended Data Fig. 3 Aggregate diameter size distribution for one differentiation run at CP 0, CP I and CP II.
Shown are individual aggregate diameters (gray) and mean values ± s.d. (red). The hiPSC line used is Amber.
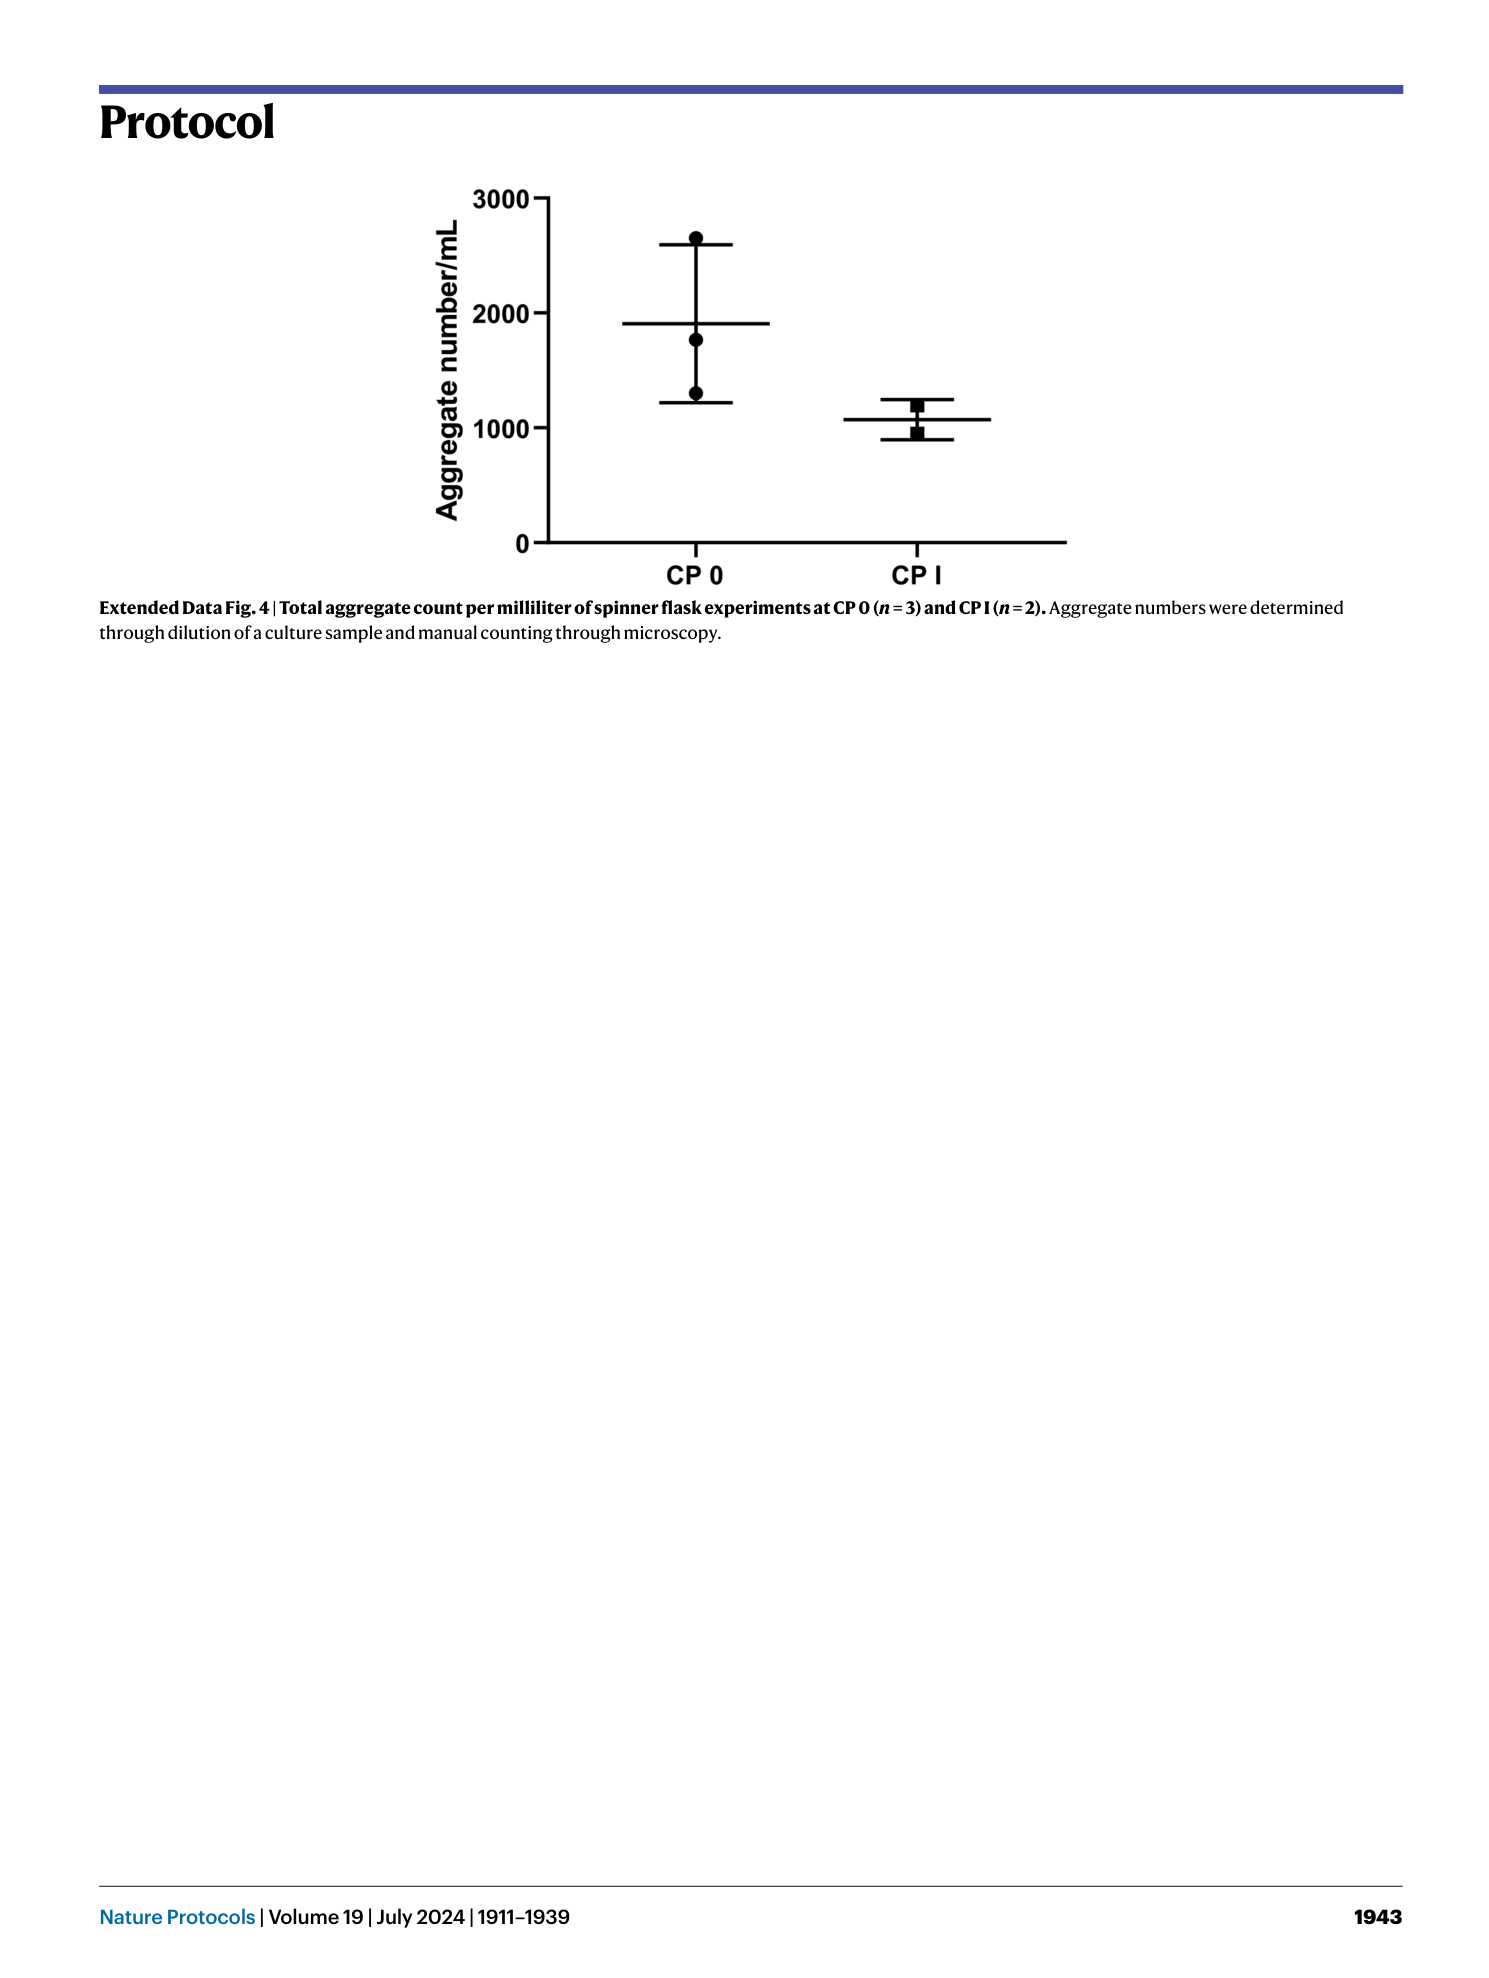
Extended Data Fig. 4 Total aggregate count per milliliter of spinner flask experiments at CP 0 ( n = 3) and CP I ( n = 2).
Aggregate numbers were determined through dilution of a culture sample and manual counting through microscopy.
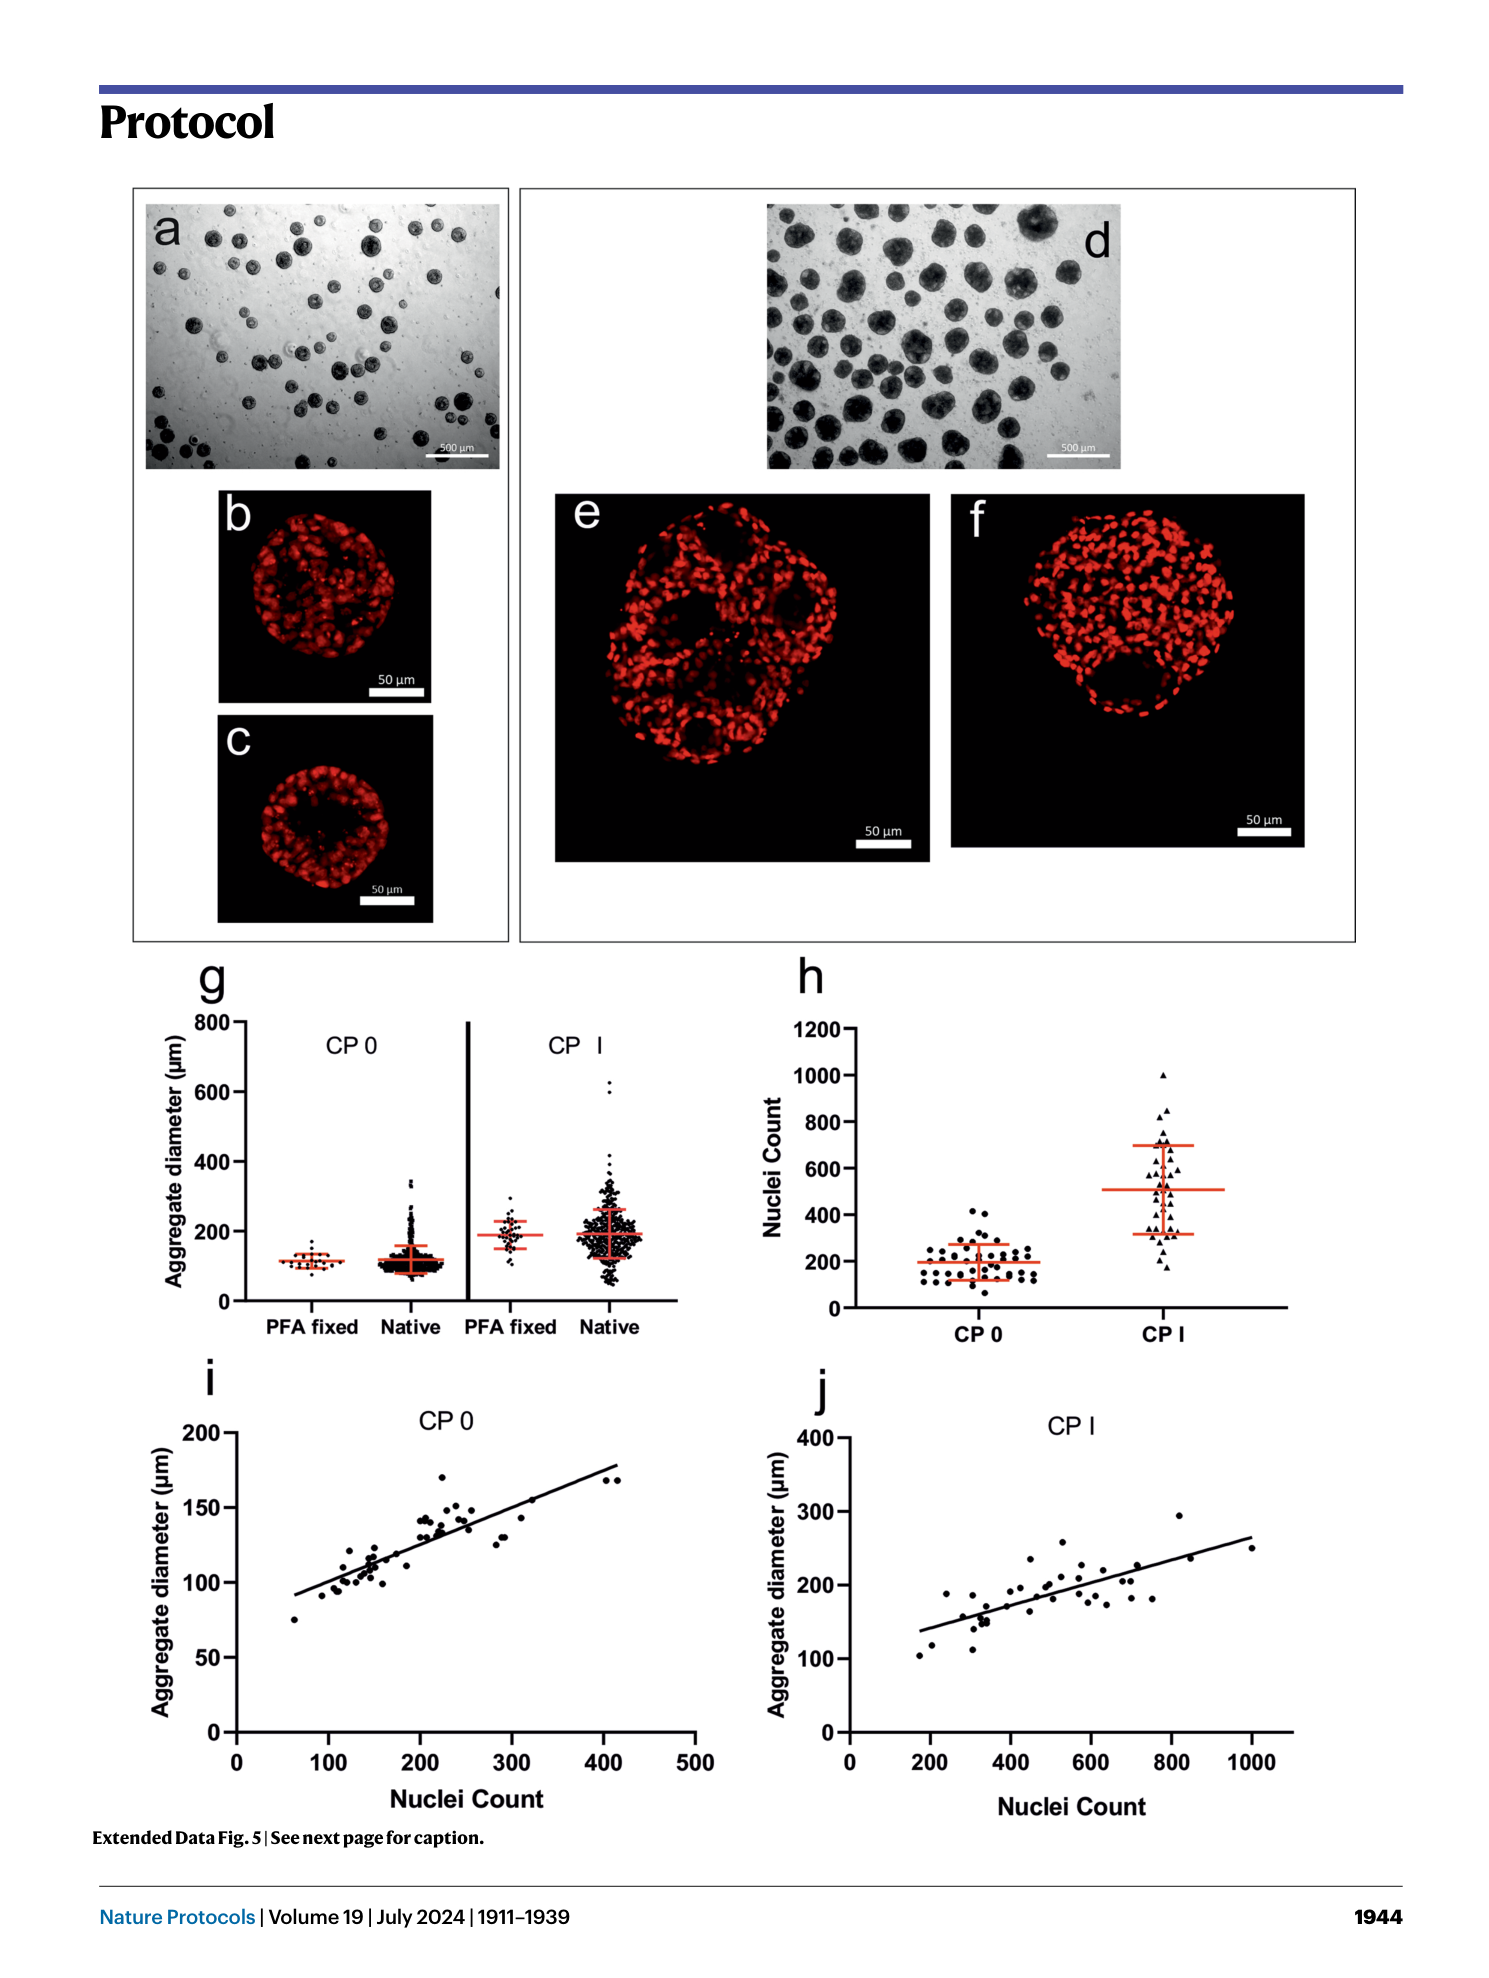
Extended Data Fig. 5 Confocal microscopy of aggregates at CP 0 and CP I to analyze cell number per aggregate.
a–c , Light microscope pictures of a representative cell sample at CP 0 (scale bar, 500 µm) ( a ) and confocal images of the central Z-stack of aggregates of the same batch (scale bar, 50 µm) ( b and c ). d–f , Light microscope pictures of a representative cell sample at CP I (scale bar, 500 µm) ( d ) and confocal images in a differentiated state as CM aggregates at CP I (scale bar, 50 µm) ( e and f ). Nuclei were stained with Sytox red after fixation; afterwards, aggregates were dehydrated with ethanol and cleared with methyl salicylate/benzyl benzoate (MSBB). Notable are pronounced cavities at CP 0 as well as at CP I. g , Aggregates treated for confocal imaging do not differ in diameter compared to untreated, equivalent samples measured according to QC3 at CP 0 or CP I. h , Nuclei identified at CP 0 and CP I through automatic counting of confocal z-stacks imaging whole aggregates. This nuclei count should closely resemble the total cell count per aggregate. i and j , Identified nuclei per aggregate in comparison to the individual aggregate diameter for aggregates at CP 0 ( i ) and CP I ( j ). Linear regression was added to depict the goodness of fit (CP 0 R 2 = 0.73; CP I R 2 = 0.55). For examples, see supplementary file z-stacks for CP 0 and CP I (open with the hyperstack function of FIJI/ImageJ). PFA, paraformaldehyde. The hiPSC line Phoenix was used in all experiments.
Supplementary information
Supplementary Information
Supplementary Tables 1 and 2
Supplementary Video 1
CM harvest for downstream application
Supplementary Video 2
hPSC splitting
Supplementary Video 3
Spinner medium exchange
Supplementary Data 1
Confocal z-stack pluripotent aggregates CP 0
Supplementary Data 2
Confocal z-stack CM aggregates CP I
Supplementary Code 1
ImageJ macro for aggregate size determination
Supplementary Code 2
ImageJ macro for viability score determination
