Repeated Measurement of Microglia-Dendritic Spine Interactions Using Multi-Photon Imaging
Ross C. Langley, Ross C. Langley, Alison J. Canty, Alison J. Canty, Jenna M. Ziebell, Jenna M. Ziebell
Abstract
In recent decades, mounting evidence has shown that microglia play a vital role in maintaining synapses throughout life. This maintenance is done via numerous microglial processes, which are long, thin, and highly motile protrusions from the cell body that monitor their environment. However, due to the brevity of the contacts and the potentially transient nature of synaptic structures, establishing the underlying dynamics of this relationship has proven difficult. This article describes a method of using rapidly acquired multiphoton microscopy images to track microglial dynamics and microglia:synapse interactions and the fate of the synaptic structures following those interactions. First, we detail a method for capturing multiphoton images at 1-min intervals for approximately 1 hr and how that process can be done at multiple time points. We then discuss how best to prevent and account for any drifting of the region of interest that can occur during the imaging session and how to remove excessive background noise from those images. Finally, we detail the annotation process for dendritic spines and microglial processes using plugins in MATLAB and Fiji, respectively. These semi-automated plugins allow tracking of individual cell structures, even if both microglia and neurons are imaged in the same fluorescent channel. This protocol presents a method of tracking both microglial dynamics and synaptic structures, in the same animal, at multiple time points, giving the user information on process speed, branching, tip size, location, and dwell time, as well as any dendritic spine gains, losses, and size changes. © 2023 The Authors. Current Protocols published by Wiley Periodicals LLC.
Basic Protocol 1 : Rapid multiphoton image capture
Basic Protocol 2 : Image preparation using MATLAB and Fiji
Basic Protocol 3 : Dendritic spine and microglial processes annotation using ScanImage and TrackMate
INTRODUCTION
In recent decades there has been increased interest in the interactions between microglia and neuronal elements. Microglia were initially thought to be reactive immune cells but have been shown to play an active role in developing and maintaining neuronal networks (Miyamoto et al., 2016; Paolicelli et al., 2011; Parkhurst et al., 2013). Advances in technology have led to investigations of when and why microglial process contacts occur. However, multi-photon imaging has transformed our understanding of these interactions when studying the dynamics of microglia:synapse relationships. Multi-photon imaging provides a non-invasive, in-vivo imaging technique that can be repeated over the course of days, weeks, or months, allowing changes to be studied over time. However, this technique has its limitations, some of which are discussed below.
When designing live imaging studies, cells of interest are typically visualized by tagging fluorophores linked to cell-specific promotors. When investigating single cell types, this is relatively straightforward using commercially available genetically modified animals, which largely rely on green fluorescent protein (GFP) as a reporter of choice. However, the challenge occurs when investigating multiple cell types simultaneously. For example, excitatory neurons and microglia are usually visualized with gfp linked to the Thy-1 and CX3CR1 promoters, respectively. Image analysis of these populations with the same reporter (in a single channel) can be challenging, and automation of any analysis is complex. The second challenge multiphoton imaging presents is the time taken to capture an image. The speed of multi-photon imaging is determined by the size of the region of interest (ROI) and the resolution of the image. A 1028 × 1028 pixel stack consisting of 60 slices could take as long as 5 min to capture. By altering settings such as size and resolution, the image acquisition speed can be increased, allowing for more frequent image sampling of dynamic interactions. Decreasing the image resolution can lead to a reduction in the information captured. Increasing image acquisition speed by reducing ROI size can be problematic due to higher susceptibility to drift. Imaging drift is caused by very slight movements in either the animal or the imaging stage and causes the ROI to move in the x, y, or z plane.
To enable fast image acquisition while accounting for drift, we have devised an imaging protocol, described below, focused on a dendritic segment containing multiple spines and microglial processes in the same fluorophore/channel, with repeated image stacks collected at 1-min intervals over a 45-min imaging session. This semi-automated protocol generates a complete series of aligned, denoised image stacks that can be efficiently quantified for a range of measures, including dendritic spine gains, losses, and size changes, as well as microglia process speed, branching, tip size, location, and dwell time. These measurements can be combined to track the behavior of microglial processes before, during, and after contact with a dendritic spine and the spine's fate following the contact. Here, we detail this method that uses popular and largely freely available software to understand microglial process movement in relation to neuronal spines.
NOTE : All protocols involving animals must be reviewed and approved by the appropriate Animal Care and Use Committee and must follow regulations for the care and use of laboratory animals.
STRATEGIC PLANNING
Cranial Window Implantation
In-vivo multi-photon imaging can be performed over any region of accessible cerebral cortex via cranial window implantation or a thinned skull preparation. Thinned skull imaging allows immediate ROI imaging for several days before the bone thickens and obscures further imaging. Suturing the scalp between imaging sessions and re-thinning the skull can allow for imaging sessions up to 18 months apart (Cramer et al., 2021). On the other hand, cranial window implantation must be done several weeks before the first imaging time point to allow any inflammation related to surgery to recede (2-3 weeks) before commencing imaging. Cranial windows have an advantage when it comes to prolonged imaging sessions, where a single surgical procedure can allow for clear imaging for 2 to 5 months and a near-unlimited number of imaging sessions in that period (Cramer et al., 2021). Ultimately, the choice should be based on the project, the resources at hand, and what is deemed more ethically appropriate for the study. This study used cranial window implantation, but the protocol will work, without alteration, for images collected through a thinned skull window.
Timeline
A key choice when using this protocol is the imaging acquisition timeline or frequency of imaging sessions. When developing this protocol, our research question required 1-hr imaging sessions at 24-hr intervals for 4 consecutive days each month. This schedule allowed us to investigate microglial process dynamics and the stability of dendritic spines both day-to-day and month-to-month. If a different imaging acquisition timeline is required, the analysis protocols can be used without modifications.
Project Flow
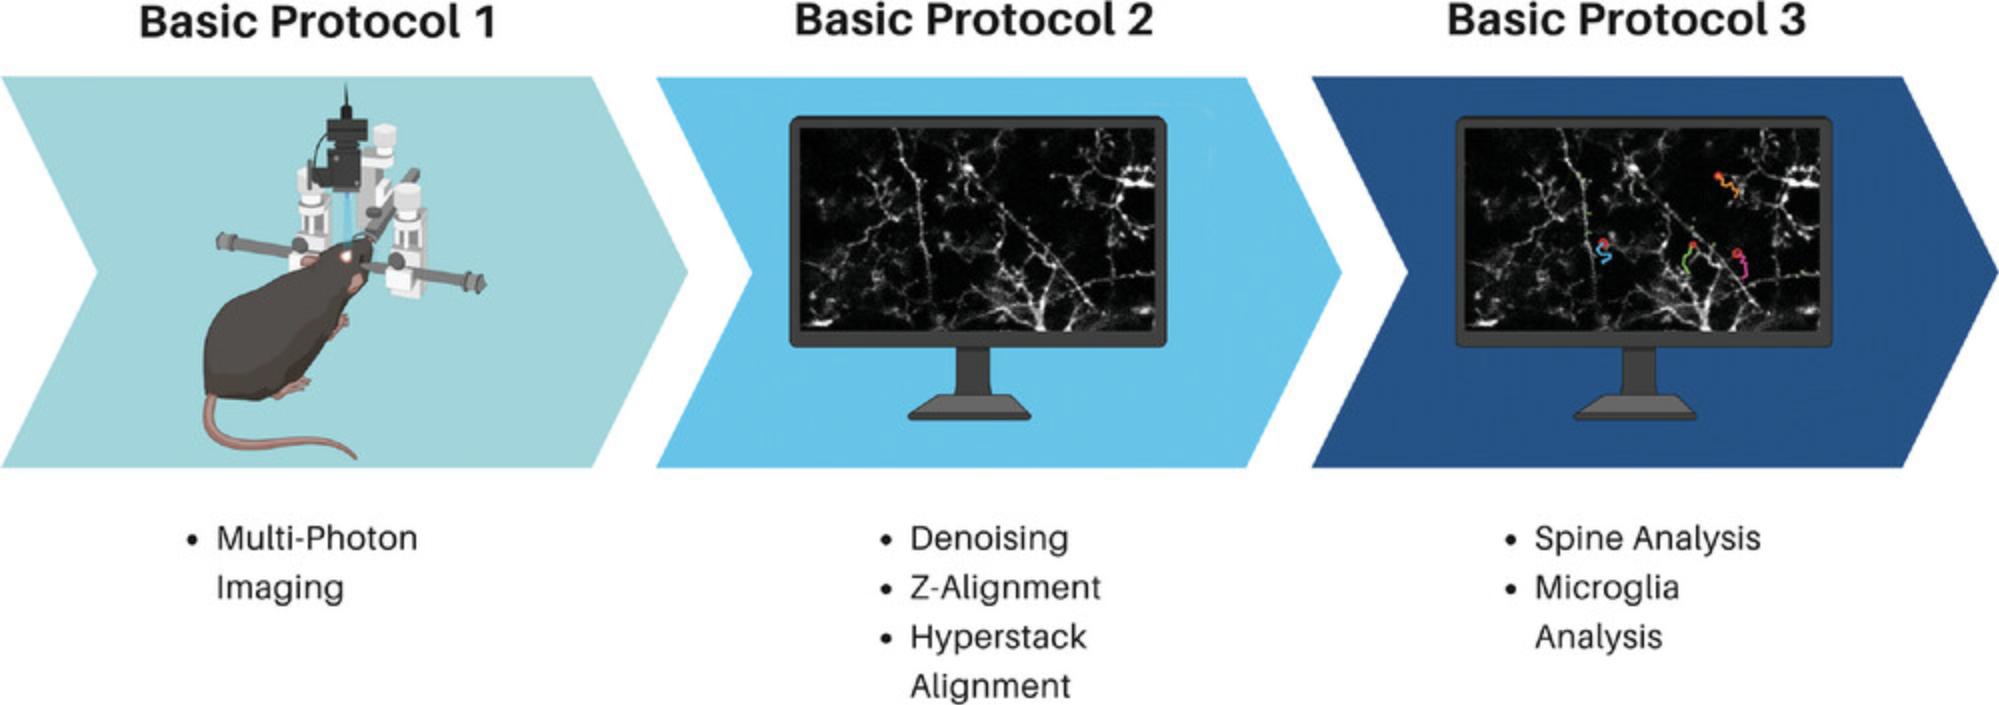
This protocol has been organized into three smaller protocols, Basic Protocols 1, 2, and 3 (Fig. 1). When planning, it can be beneficial to run each animal through one of the protocols before moving on, as this streamlines the process—for example, capturing the multi-photon images from all animals in the experiment before moving on to protocol two and preparing them as a single large batch.
Basic Protocol 1: RAPID MULTIPHOTON IMAGE CAPTURE
For the accurate measurement of microglial dynamics, the upper and lower limits of the ROI should be set, and the collection of image stacks should be continually looped, with minimal time between the final slice of one image stack and the first slice of the next stack. Manual collection can also be performed, although this approach can be more prone to error. This protocol details the collection of images from a live mouse at 1-min intervals. At the end of the protocol, you will have 45-60 image stacks of a region measuring approximately 100 µm × 100 µm × 30 µm. Each stack consists of 30 z-slices, each slice separated by 1-µm intervals in the z plane, allowing structures to be tracked in three dimensions (3D). The protocol also outlines how to set up the ROI so future imaging sessions can image the same location, allowing for comparisons over days, weeks, and months.
Materials
-
All breeding and animal protocols must be approved by your Institute prior to experimentation.
-
Mice with cranial windows: This protocol used male CX3CR1+/gfp × Thy-1egfp mice on a C57BL/6J background. CX3CR1+/gfp and Thy-1egfp mice are available from Jackson Laboratories and can be cross-bred. Animals were housed with unlimited access to food and water in a 12-hr day-night cycle facility. Whenever possible, siblings are group housed. Cranial windows were implanted at 2 months of age. Mice were then housed singly for 1 hr before returning to their cage and being given 3 weeks to recover prior to imaging. All breeding and animal protocols were approved by the University of Tasmania Animal Ethics Committee (A16806) and in accordance with the Australian code of practice for the care and use of animals for scientific purposes. See Holtmaat et al. (2009) and Kılıç et al. (2020) for detailed protocols for cranial window implantation. (Note: This protocol can be done with any model with fluorescence-marked neurons and microglia. This includes other genotypes as well as virally transfected fluorescent animals.)
-
Isoflurane
-
Oxygen
-
Tissues
-
Eye lubricant (Poly Visc Lubricating Eye Ointment)
-
Water (tap or MilliQ is suitable).
-
Multi-photon microscope
-
Stereotaxic frame
-
Heating pad
-
Anesthetic vaporizer for induction and maintenance of anesthetic, i.e., isoflurane
-
Fiji
-
MATLAB
1.Anesthetize the mouse with a cleared cranial window.
2.Once anesthetized, transfer the mouse to a stereotaxic frame with a small heat pad on the base of the stereotaxic frame set to 37°C.
3.Periodically check the vital signs of the mouse. At a minimum, these checks should include body temperature, breathing rate, reflex response (e.g., pedal withdrawal or tail pinch), oxygen flow rate, and the flow rate of any anesthetic. The mouse must be kept under a light anesthetic, with steady breathing between 50 and 70 breaths per minute, no reflex response, and a temperature of approximately 37°C. Health checks should occur regularly throughout the imaging session, with the time of each check recorded to avoid any skewing of the data due to any variation in time between image stacks.
4.Coat the eyes with eye lubricant to avoid them drying out.
5.Using the stereotaxic frame, immobilize the head.
6.Once the head is immobilized, place the mouse under the microscope and use a 20× magnification water immersion lens to find an easily identifiable vasculature landmark under bright field imaging conditions. Capture an image of the landmark for reference in future sessions.
7.Switch the microscope to multiphoton mode at wavelength 910 nm, gain −670, and power at the imaging site set between 0.7 mW and 0.8 mW.
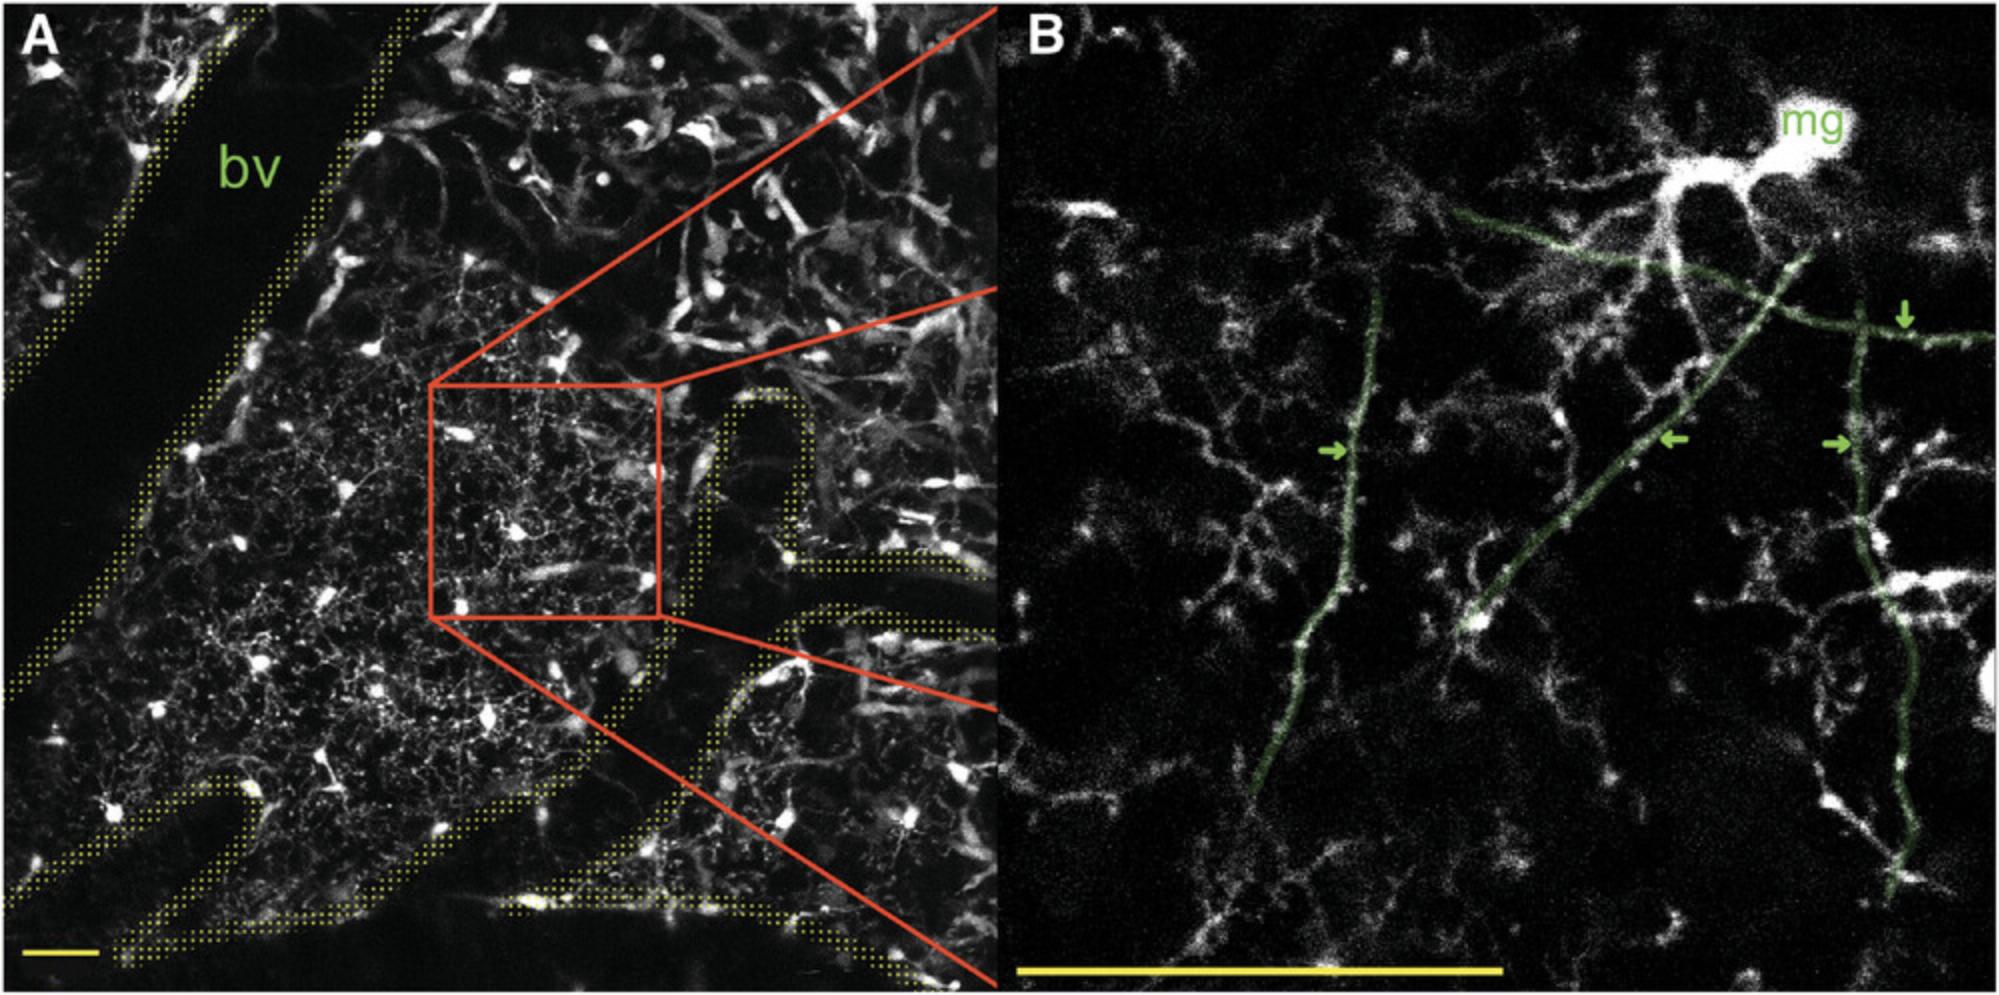
8.Set the zoom to a low magnification and examine the area for a potential region of interest (ROI) (Fig. 2).
9.Set a 512 × 512-pixel field of view.
10.Set the z-step distance to 1 µm and set the points for the top and the bottom of the stack, creating a z depth of 30 µm.
11.Set the software to loop at 1-min intervals for 8 min.
12.Check the animal's health and make any required adjustments before starting the imaging.
13.Start the loop and begin capturing images.
14.Once the loop is done, compare the first image with the last. This can be done in Fiji. Check if the image has drifted in the x, y, or z axis and correct for any detected drift before starting the next loop.
15.Continue capturing image stacks in this manner for the duration of the imaging session.
16.When the imaging session is complete, turn off the flow of anesthetic and remove the mouse from the stereotaxic frame. Return the mouse to a clean cage, heated via a heating pad under the cage, and monitor carefully during recovery.
17.This imaging protocol can be repeated in future imaging sessions according to the timeline for the study or as long as the cranial window remains clear (open).
Basic Protocol 2: IMAGE PREPARATION USING MATLAB AND FIJI
Following collection, the image stacks acquired in Basic Protocol 1 require preparation before analysis. This process can be broken into three stages: 1) denoising, 2) z-drift correction, and 3) the creation and alignment of a hyperstack. A hyperstack is a four-dimensional stack with sliders for time and depth. The amount of time and effort required in this protocol depends on the quality of the images collected, that is, how much noise is present in the images and how much drift on the x-, y-, and z-axis may have occurred during image collection. Noise can occur within an image for various reasons, such as fluctuations in laser power, overexposure, or use of a high-gain setting. The result is an image with random illuminated pixels that make it difficult to analyze fine structures. Removing the noise and realigning the image makes for a more accurate analysis of microglial process movement.
To save time, we recommend performing Basic Protocol 2 in batches, step by step, i.e., adjusting images from multiple imaging sessions simultaneously. For example, doing all the denoising, then all the z-drift corrections, and then the hyperstack alignment, rather than taking a single imaging session through to completion before moving on to the next one.
Materials
- The image preparation and analysis processes require two programs and plugins. A list of the programs and plugins and the version used in the protocol are listed below.
- Programs and plugins:
- MATLAB (CANDLE is less stable in newer versions of MATLAB; we used version 2013b)
- CANDLE multi-photon denoising (Coupé et al., 2012) plugin for MATLAB (see Internet Resources)
- Fiji 2.3.0 (or a similar version)
- HyperStackReg – plugin for Fiji (see Internet Resources)
- NOTE : The computing power required for these plugins will vary based on the images being analyzed. As a frame of reference, this protocol was tested and ran smoothly on a PC with 16 GB of RAM and an i9-8950HK processor.
- NOTE : Before opening MATLAB, ensure all images to be denoised are located in animal-specific folders, with each imaging session contained within a subfolder.
Denoising
1.Open MATLAB 2013b.
2.Ensure the file path is set to the correct location.
3.Run the script.
4.A window will open, asking you to select the images for denoising. Select all the images you wish to denoise.
5.You will be prompted to enter the parameters for denoising. The following parameters are recommended:
Smoothing parameter = 0.1, Patch radius = 2, Search Volume Radius = 3, and fast background processing enabled.
6.Leave the script to run.
7.The denoised files will appear sequentially in the same folder as the original files with the suffix ‘_denoised’.
Adjust for drift in the z-plane via stack alignment
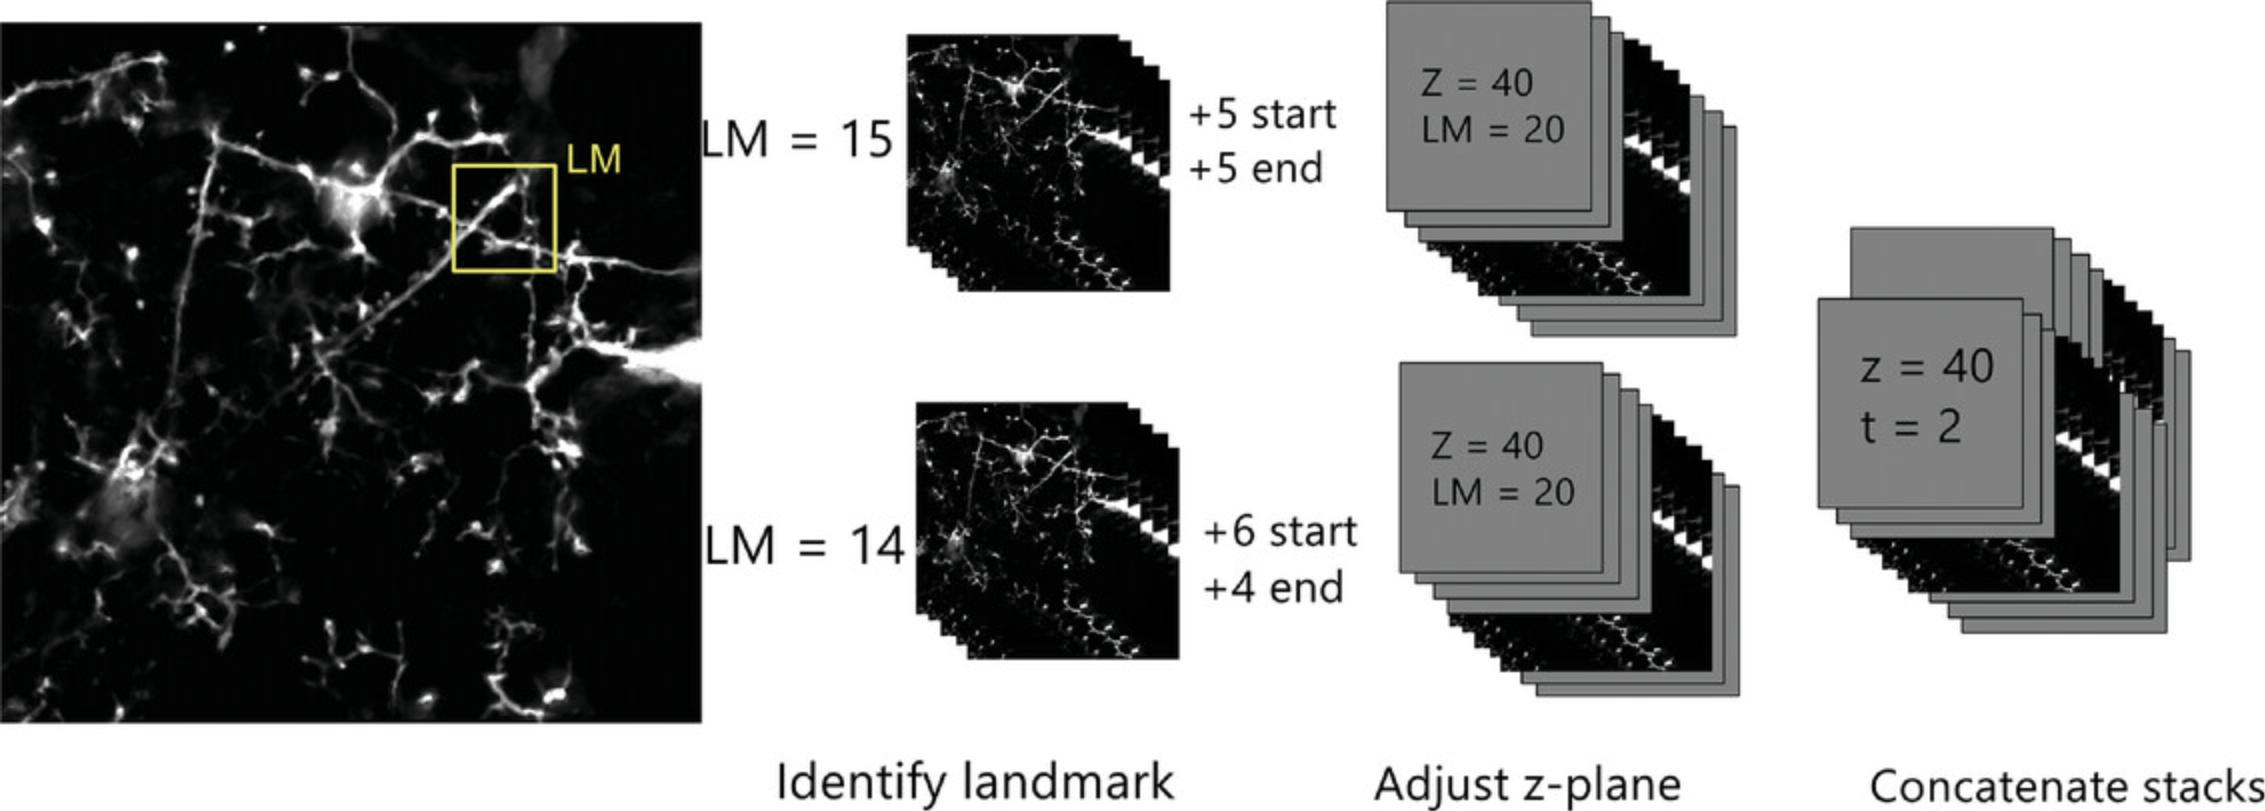
Each imaging session yielded approximately 45 stacks of images, i.e., one for every minute. To align each slice within each ROI image stack, we added a series of empty slices to the top and bottom of the z stack and then shifted the position of the image slices within the stack so they are consistently aligned across sessions (Fig. 4). The following steps outline how to achieve this.
8.Open Fiji.
9.Create an empty stack.
10.Save this image as a tiff and close it.
11.Open your first denoised image for the first imaging session.
12.Open the stack sorter and select ‘add slices’.
13.When asked how many slices to add, select 5.This will add five slices after the slice currently visible on your stack.
14.Scroll to the bottom of the image and add five blank slices in the same manner as steps 12-13.You should now have your image stack flanked by 5 blank slices at the top and bottom of the stack.
15.Scroll through the stack of images slice by slice and find an easily identifiable landmark within the stack. Note what slice it is on.
16.Open the next image stack and find the same landmark. Compare the slice number and determine how many slices need to be added or subtracted to have both landmarks on the same z-slice. For example, if the landmark is on the 20th slice in the first image stack and the 14th slice in the second (before any blank slices are added), you must add six slices to the start of the image to bring the landmark to the 20th slice. After this, add four slices to the bottom to generate an image stack of the same thickness as the first image stack. Continue this process for all image stacks in the time series (Fig. 4), repeating steps 11-16 until all image stacks for ROI in the imaging session are aligned.
Hyperstack creation and alignment
A hyperstack is a four-dimensional image stack with sliders for depth (z) and time (t) at the bottom of the image. Creating a hyperstack allows for the measurement of time and distance in the x, y, and z planes.
17.Open all the images from the image session that went through z-alignment in the previous stage of the protocol.
18.Create a hyperstack using Images > Stacks > Tools > Concatenate. Select ‘All open windows’, and you will be prompted to name the image. We suggest using a title for the image that includes the animal identifier and imaging session number and select ‘Open as 4D image’. You do not need to select ‘Keep original images’ as this will not alter the source images.
19.With the image still open, select Plugins > HyperStackReg
20.Select > Rigid Body Alignment > and click ok. This alignment can take some time, depending on the power of the PC.
21.Once the alignment is complete, save the file as a .tiff. These images will be used in step 25 of Basic Protocol 3.
Basic Protocol 3: DENDRITIC SPINE AND MICROGLIAL PROCESSES ANNOTATION USING SCANIMAGE AND TrackMate
This protocol describes the software and steps needed to track and correlate dendritic spine and microglial process movements over time, both within and across multiple time points. Spine annotation can be done via numerous software packages, some of which are freely available (Fiji), while others require a license fee (Neurolucida, MicroDynamix). We used MATLAB, which also requires a license fee. Image annotation can be broken into two stages. The first is the dendritic spine annotation using ScanImage in MATLAB. A single image stack from each time point is annotated with all dendritic spines being marked and then correlated across all time points. The correlation allows for spine gain, loss, size, and maintenance to be tracked across time. Microglial processes are tracked in Fiji using the plugin TrackMate. The dendritic arbor is a fixed structure, which means we can use an image of the spine annotation as a guide for microglial contact annotation. Each microglial process can be identified and followed across a time series, and all dendritic spine contacts can be measured. Once both steps are complete, this protocol will combine all data into autogenerated spreadsheets with dendritic sizes across time as well as three additional spreadsheets. The first spreadsheet will provide information on the measurements within an image, such as process size and location. The second spreadsheet will provide information on the differences between each image, such as the distance moved by each spot between images. The third spreadsheet combines the first two to provide averages for all tracks. Across these spreadsheets, you will obtain microglial process speed, size, dwell time, and branching, and a labeled flow chart showing microglial process life span, branching, and contacts.
Materials
- The preparation and analysis processes require two programs and several plugins. Below is a list of the programs, plugins, and versions used in the protocol.
- Programs and plugins:
- MATLAB (ScanImage is compatible with all versions 2013b to 2022; we have not tested this protocol in versions post-2022)
- ScanImage (Pologruto et al., 2003)
- Fiji 2.3.0
- TrackMate (Included with Fiji since August 2022)
Spine annotation using ScanImage
1.Open MATLAB.
2.Set the directory so that the folder containing the launch.m script is displayed.
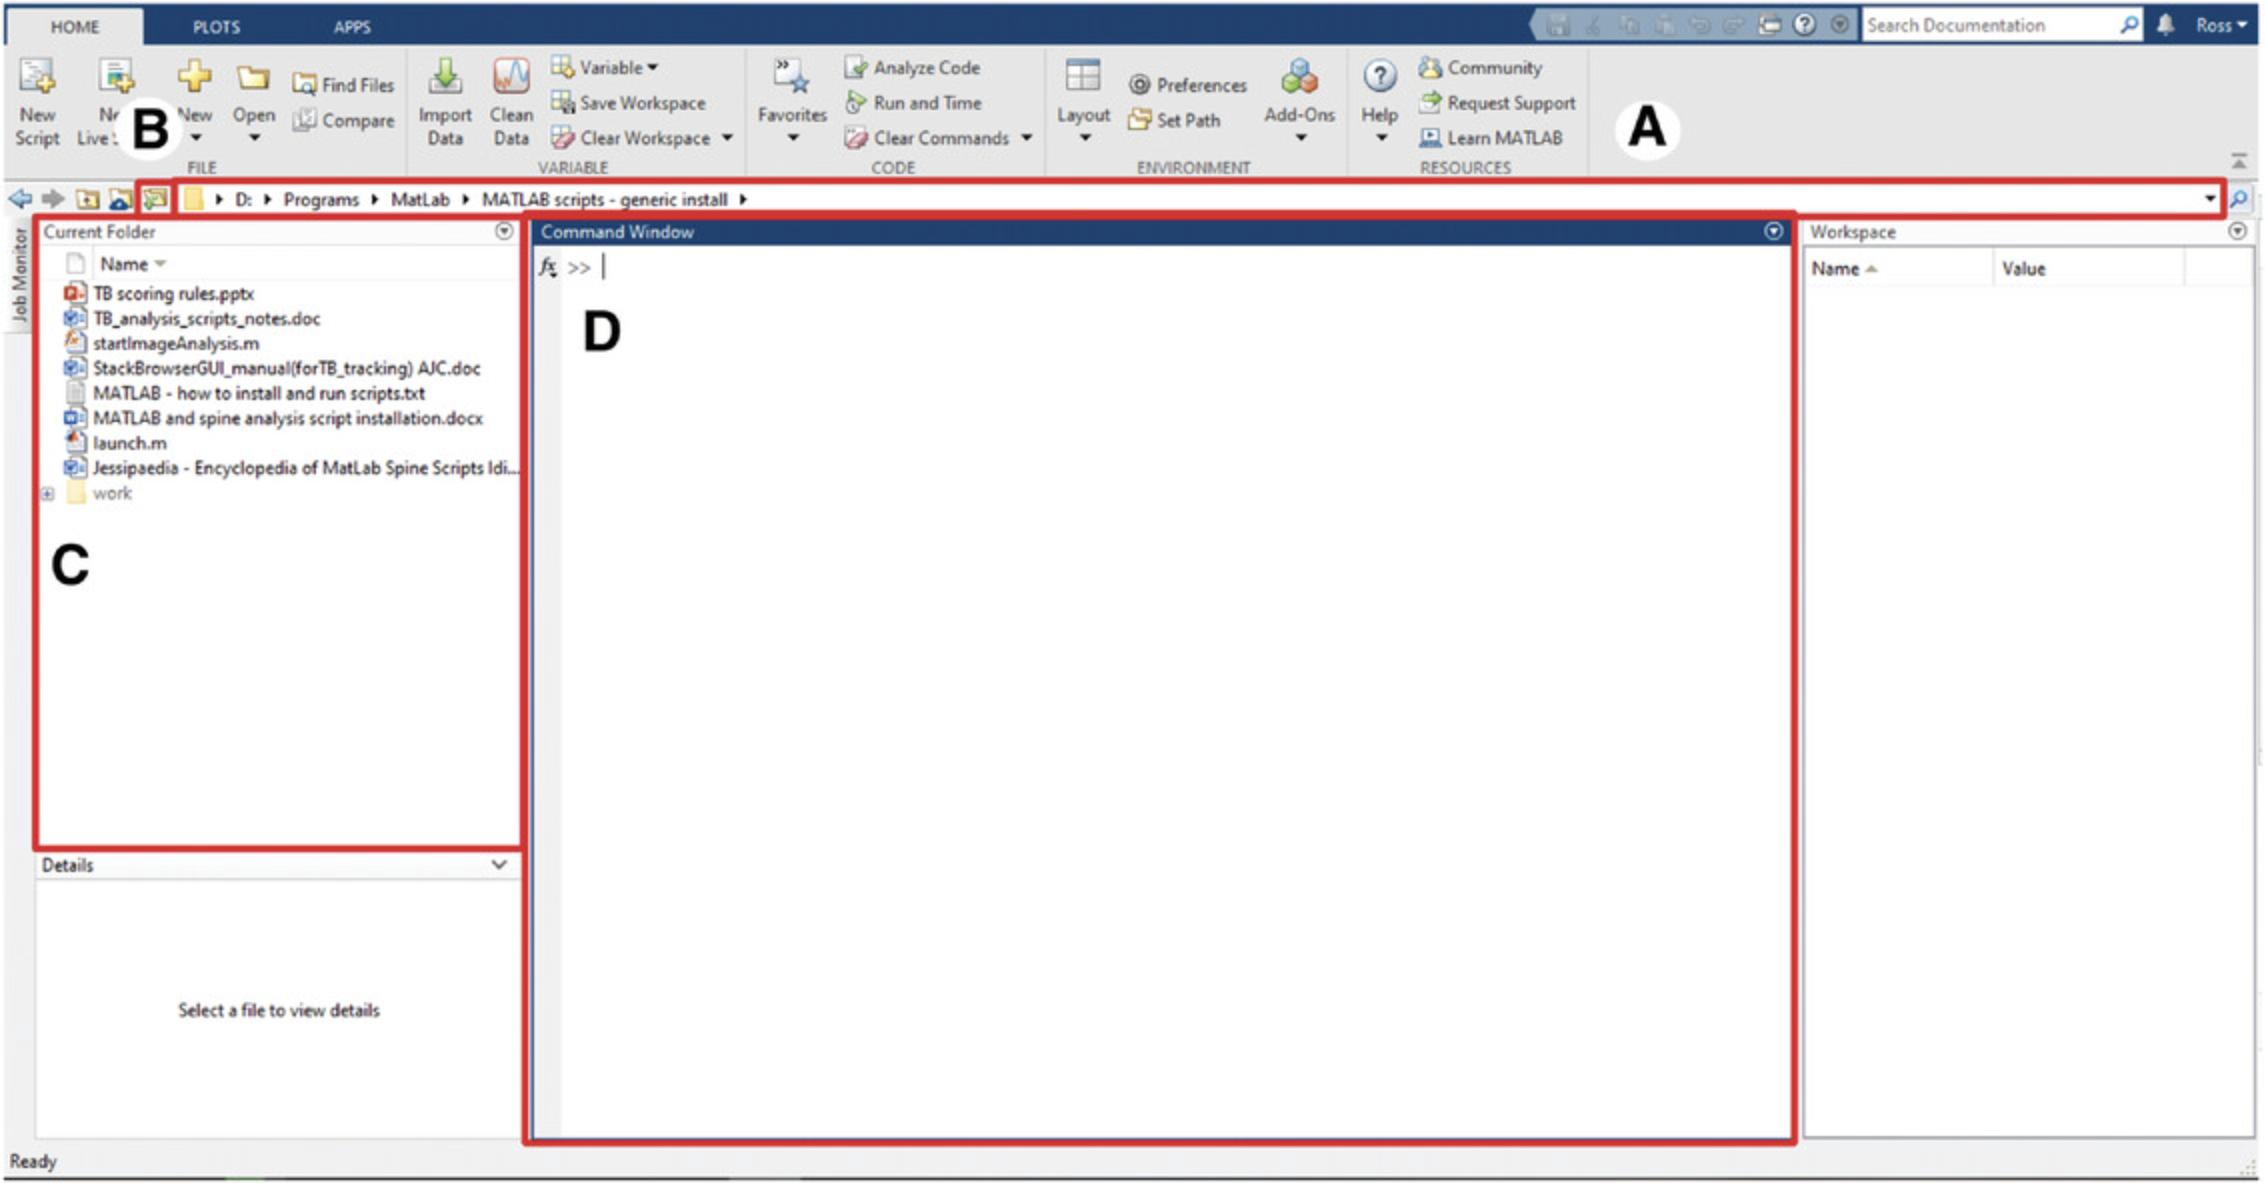
3.Run the launch.m script by right-clicking the script (Fig. 3C) and selecting ‘run’ or typing ‘launch’ into the console (Fig. 3D).
4.Two windows will open: in the ‘stack browser control’ window (Fig. 5A), click the arrow pointing to the right (highlighted with a red box), select ‘none’ under filter, and then select ‘new browser window’, which will open three windows. The ‘stack browser units’ window (Fig. 5B) sets the scale for the annotations, the ’stack browser annotations’ window (Fig. 5C) lists the annotations as they are made, and the ‘stack browser’ window (Fig. 5D) displays the image and annotations.
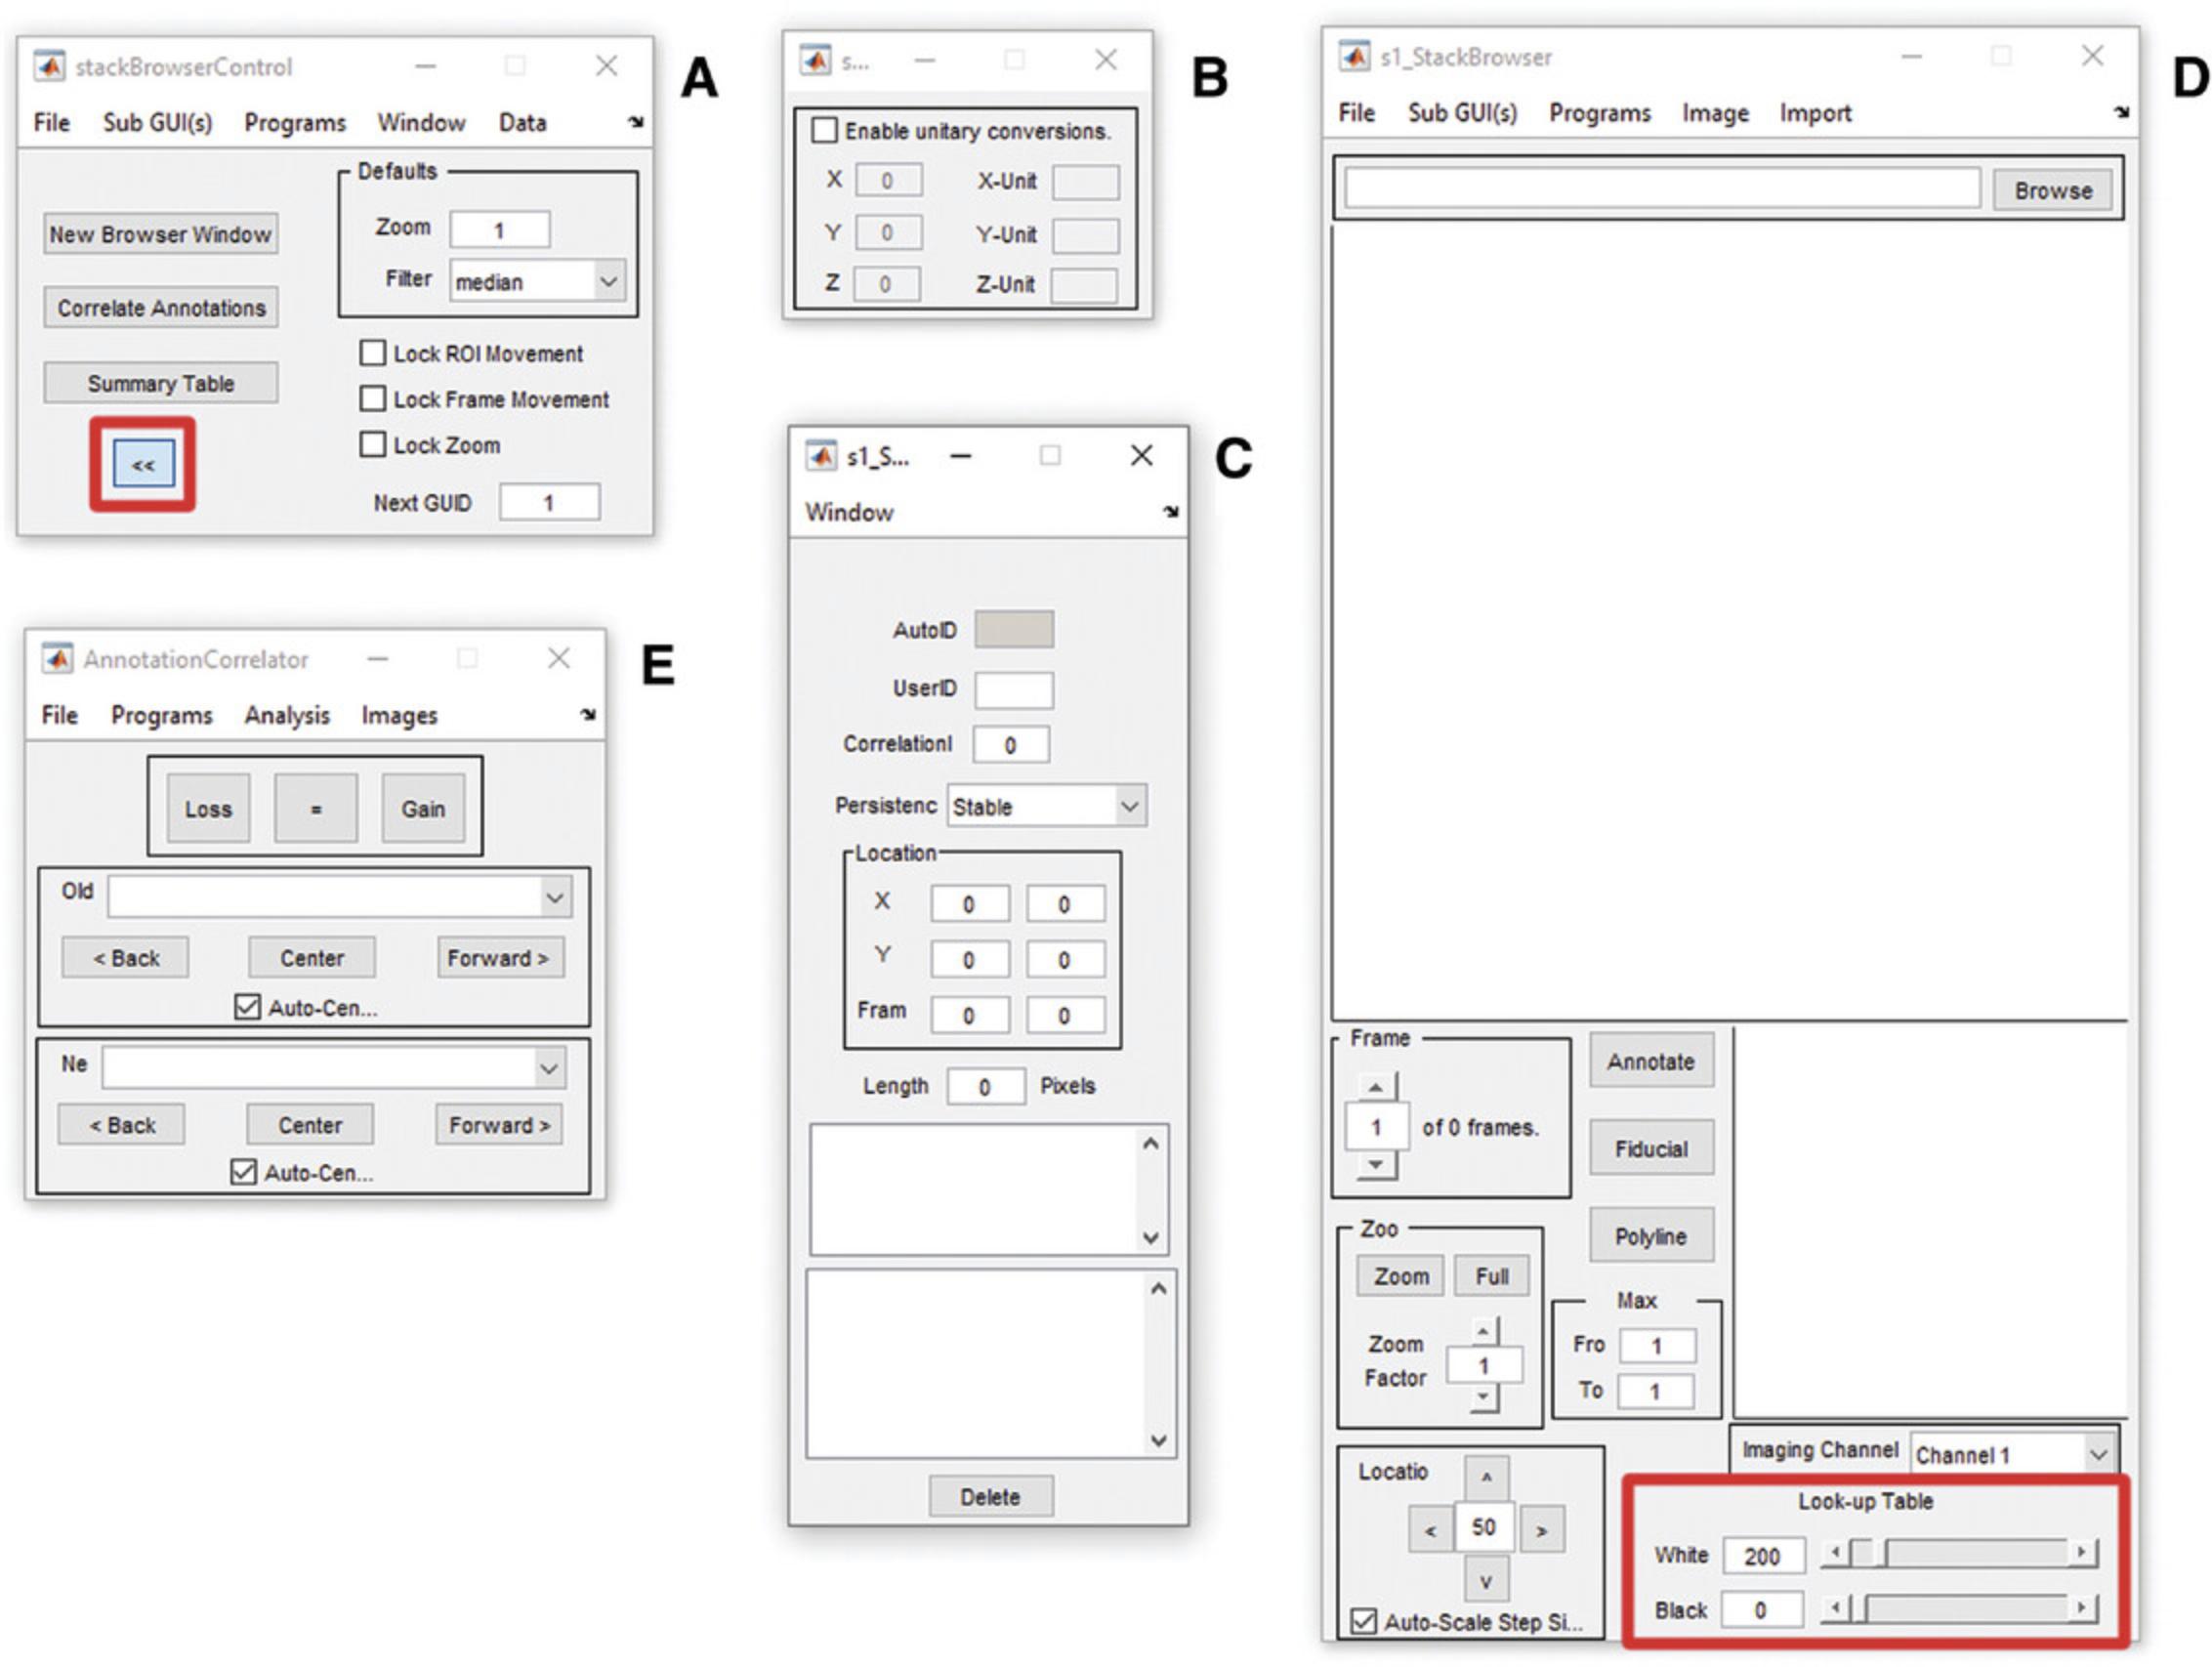
5.In the ‘stack browser’ window (Fig. 5D), select ‘browse’ on the top right and choose the image of interest.
6.In the ‘stack browser units’ window (Fig. 5B), select ‘enable unitary conversions’ and enter the scale and unit of measurement in the labeled locations.
7.With the image displayed in the window, familiarize yourself with the controls labeled ‘Frame’, Zoom’, ‘Location’, and ‘Look up table’, which control the z-layer, zoom, x-y location, and contrast, respectively.
8.Adjust the image contrast so that the dendrites can be seen clearly.
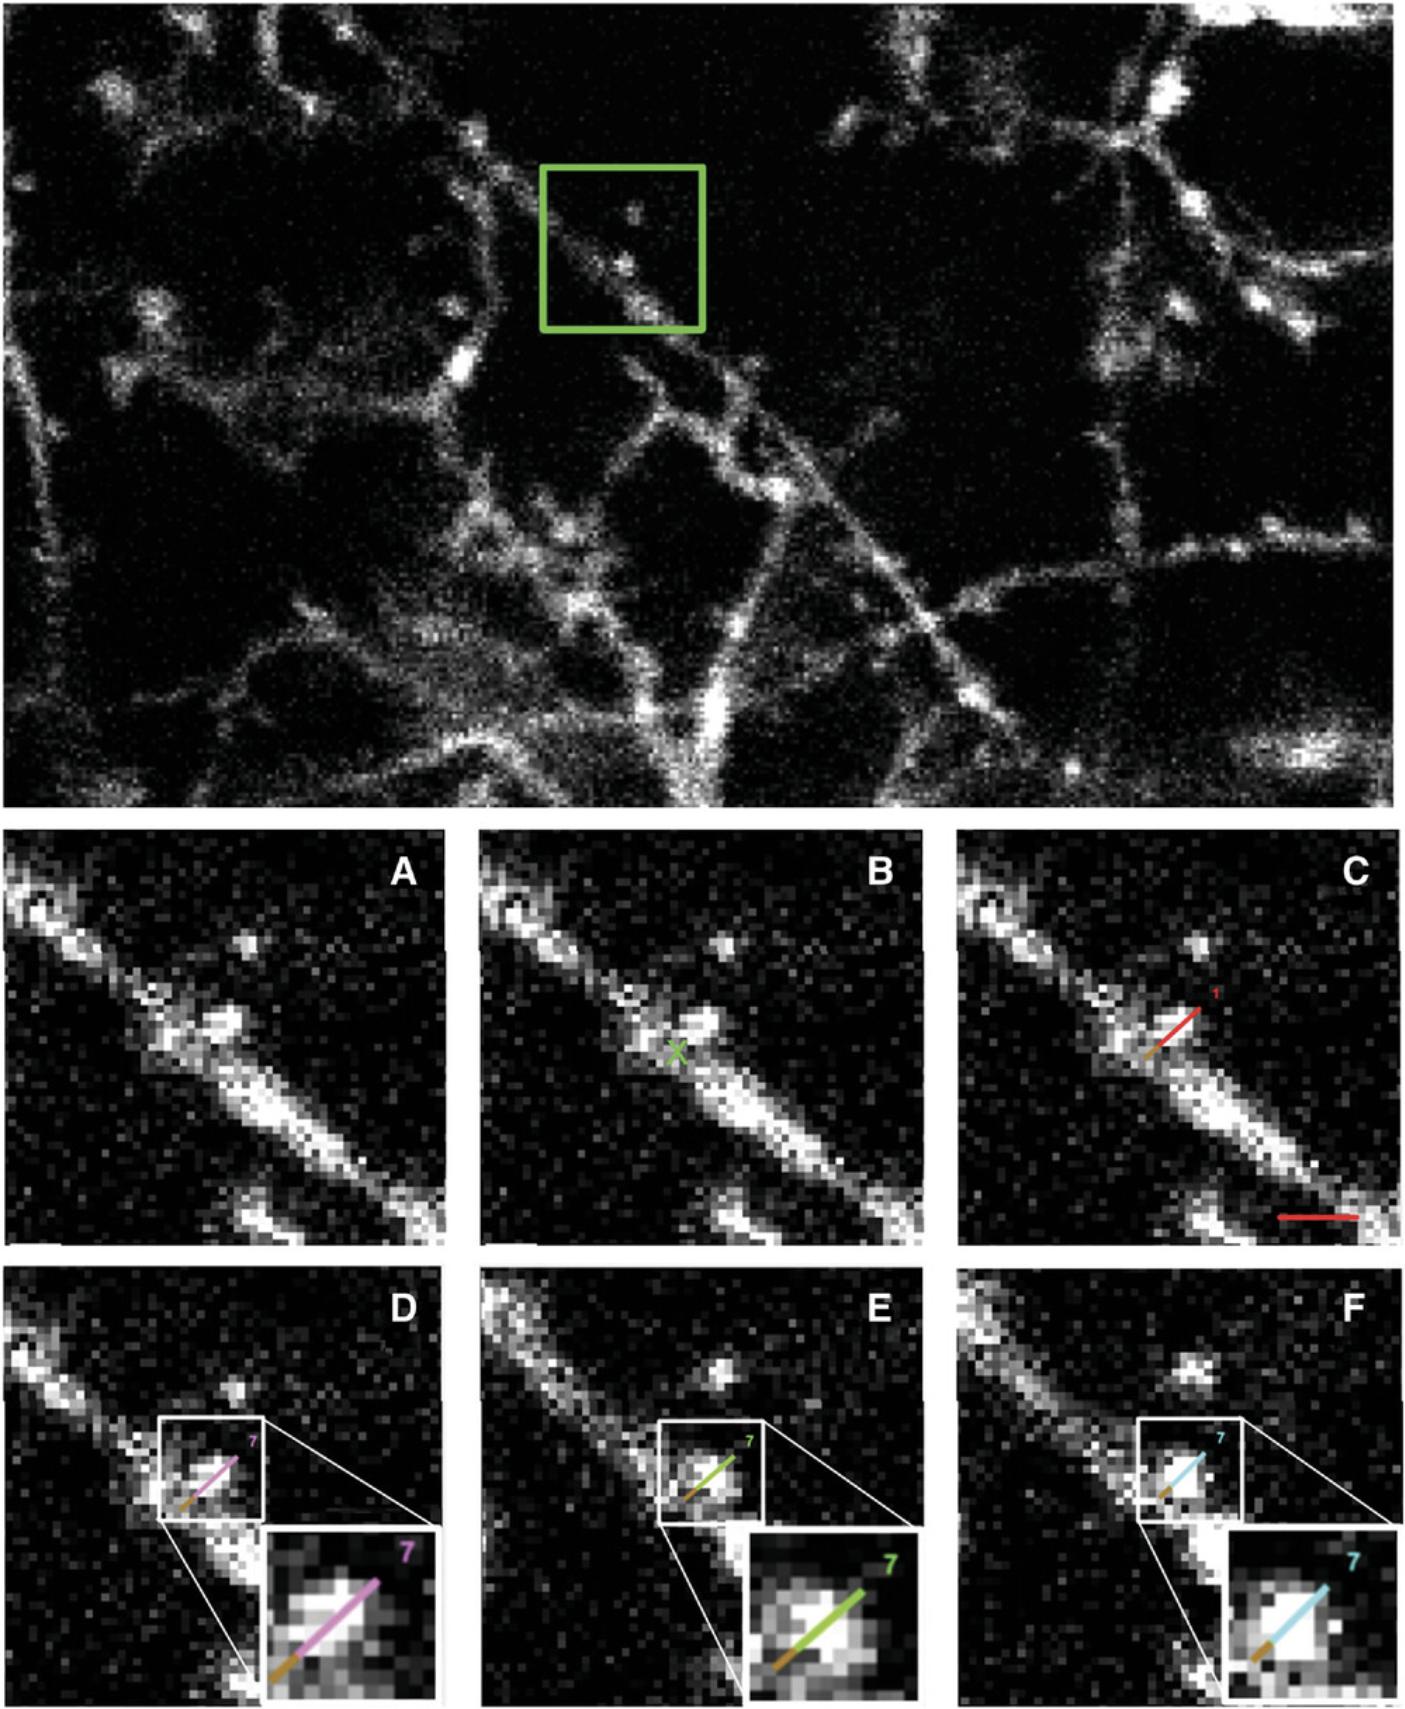
9.Annotation can now begin. Starting at one end of the dendrite and at the top of the stack, zoom in (10× to 13× zoom is recommended (bottom, 5d)) and move along the dendrite using the ‘Frame’ and ‘Location’ buttons. Once you have located a spine, click ‘annotate’, click the cursor in the middle of the dendritic shaft at the base of the spine, and then double-click at the outer-most edge of the pixel at the tip of the spine. This should create a numbered line running from the center of the dendritic shaft to the end of the dendritic spine (Fig. 6). Continue navigating along the dendritic shaft, annotating each spine within the ROI in the same way.
10.Save the annotation as an .ann file in the stack browser control window (Fig. 5A) using ‘Data > Save’.
11.Open a new window using ‘new browser window’ in the stack browser control window (Fig. 5A) and repeat steps 9 and 10 for the next image stack in the time series, working your way along the dendrite and annotating spines as per steps 5, 6, 9, and 10.Save the .ann file periodically, updating the name as suggested in step 10.
12.Repeat step 11 for all image stacks of the dendrite in the time series. Once you have annotated the final image stack in the time series, save the .ann file again (see step 10) and close MATLAB.
13.Restart MATLAB, going through steps 1-6 of this protocol. Open the first annotated image for the imaging series. Import the annotation data using ‘data > load’ (Fig. 5A) and select the saved .ann file.
14.Open the second image in the time series using ‘new browser window’ in the stack browser control window (Fig. 5A)
15.In the ‘Stack browser control’ window (Fig. 4A), select ‘Correlate annotations’. The ‘Annotation Correlator’ window will appear (Fig. 4E), with three buttons at the top (‘loss’, ‘=’, and ‘gain’) and two drop-down menus (‘new’ and ‘old’). Select the first image in the time series in the ‘old’ menu and the second image in the time series (opened in step 14) in the ‘new’ menu (Fig. 5E).
16.Navigate along the same dendrite in each image, checking if the spines are present in both images or only in one of the images. If they are present in both images, click on the spine in both images and then click ‘=’. Both annotation lines will turn green, and the number of each annotation will now be the same. This is considered a stable spine.
If the spine is present in the new image and not the old image, click on the new spine in the new image, do not make any further selections (clicks) in the new image, and click ‘gain’ in the ‘Annotation Correlator’ window. This is considered a spine gain. The annotation line will turn pink in the new image, to visually indicate the first session in which this spine is present.
If the spine is present in the old image and not the new image, select the spine in the old image and, without selecting any other spines, click ‘loss’. The spine will then turn blue to indicate that this is the last time the spine was visible. An example of this process can be found in Figure 6.
17.Move along the dendrite until all spines in the pair of image stacks have been considered. Remember to save the .ann file periodically.
18.Open the next (third) image in the time series using ‘new browser window’ in the stack browser control window (Fig. 5A).
19.Select the next combination of new and old images in the ‘Annotation Correlator’ window. The second image in the time series is now considered the ‘old’ image, and the third image in the time series is considered the ‘new’ image.
20.Follow step 15 for the second and third images in the time series.
21.Repeat steps 15-19 until all image stacks in the time series have been considered.
22.The annotated images make for a useful reference tool when doing microglia analysis. After each image stack is correlated, take a screenshot of the image and save it for future use.
23.Once all the images have been correlated, in the ‘Stack browser control’ select ‘Data > Export > Comma Separated’ to export the data as a .CSV file.
Microglia annotation using TrackMate
24.Open Fiji.
25.Drag and drop the hyperstack you want to analyze into Fiji.
26.Check the image properties are correct using ‘Image > properties’. You are looking to make sure the units of measurement are correct.
27.Open TrackMate, ‘Plugins > tracking > manual tracking with TrackMate’.
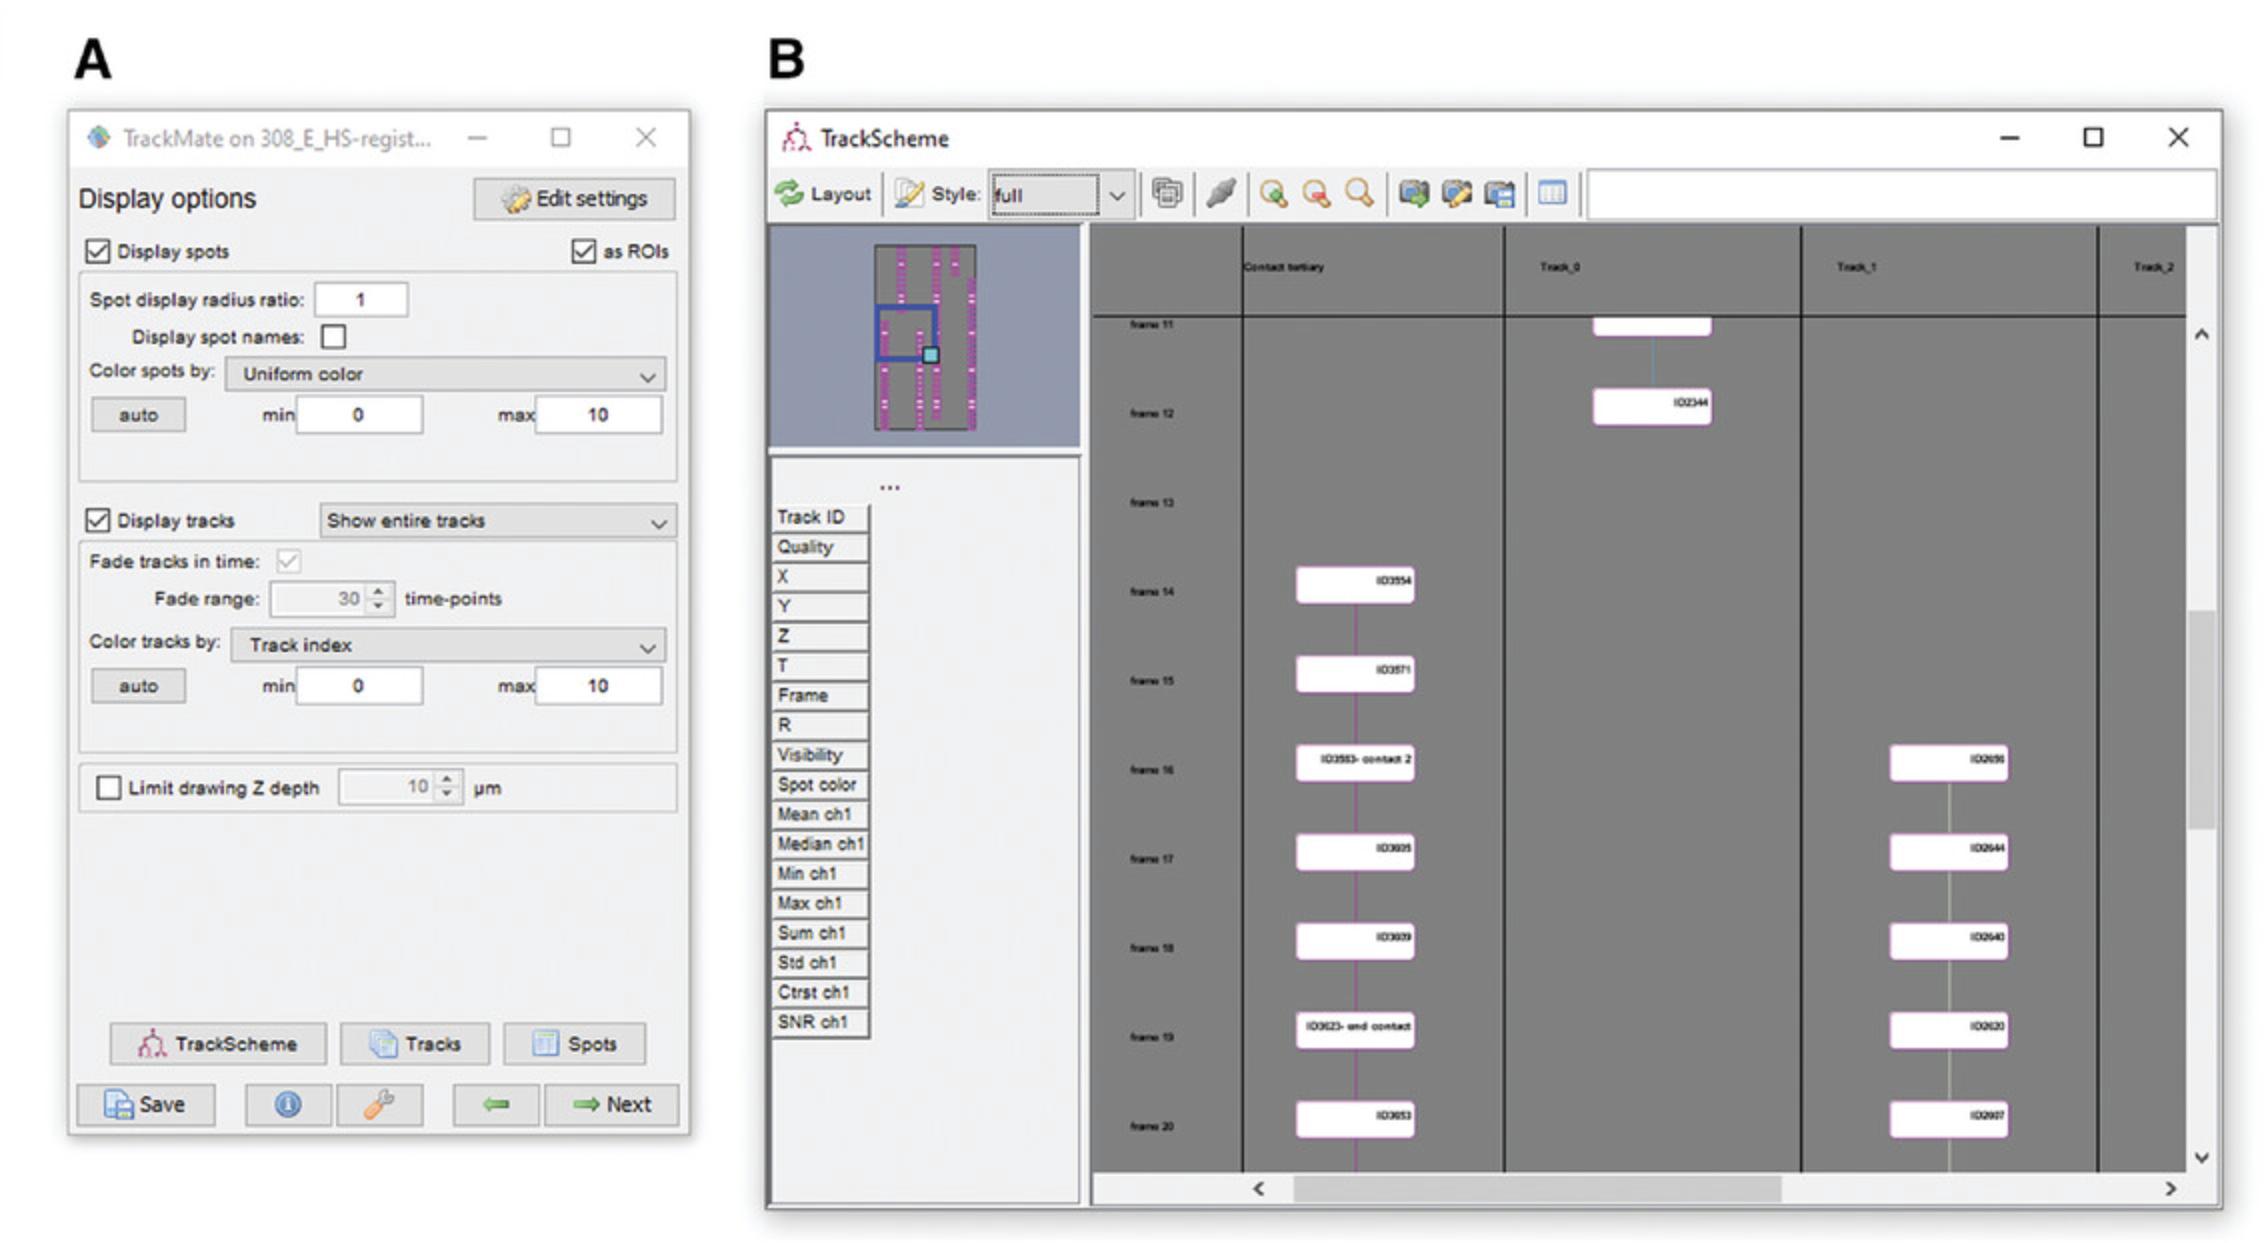
28.This will open a window, as shown in Figure 7A.
29.Next, open a screenshot of the annotation for the image you are looking at. This can be done in any image viewing software, but avoid opening the image in Fiji as this could interfere with the microglia annotation.
30.Search the first image (the first t-slice) in the hyperstack for microglial processes. When you have found a process, hover the reticule (white cross) over it and press ‘a’ on the keyboard to add a spot (red circle). The spot size can be increased or decreased by selecting it and using the ‘q’ and ‘e’ keys, respectively. The spot can be moved by holding the space bar and dragging the reticule. If you make a mistake and need to delete a spot, press ‘d’.
31.Ensure you make consistent placement and size decisions to avoid inconsistencies in the data.
32.With the first spot placed, move to the second t slice, find the same process, and place a spot over it in the same way as step 30.
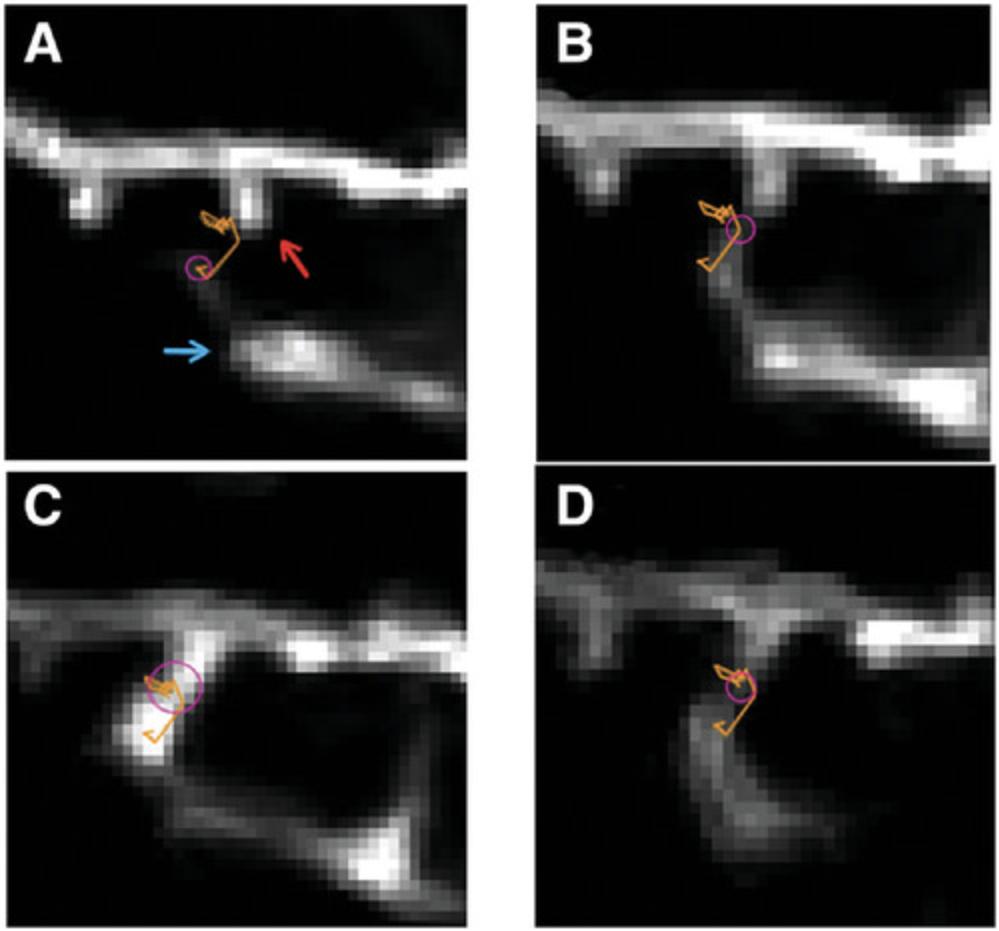
33.At this point, one of two things will happen, depending on the settings in Fiji. The spots may automatically link, in which case you will see a colored line linking the two locations (Fig. 6, orange line). You can move through the hyperstack, selecting and tracking the process at each time point as you go. If they do not automatically link, select both spots by clicking on the first spot, holding the shift key, and then clicking on the second spot. With both spots selected, press ‘‛l’ (l = link)’ on the keyboard to link the selected spots, then press ‘shift + L’ on the keyboard again to start the automatic linking function. With automatic linking turned on, you can now move through the hyperstack, selecting and tracking the microglial process as you go. At the end of the tracking processes, you can visually inspect the tip movement across the time series using the orange line (Fig. 6).
34.While the tracking is taking place, you can click the ‘TrackScheme’ button on the control panel (Fig. 5A, bottom). This button opens an interactive map of the points called ‘TrackScheme’ (Fig. 7B). Use this map to record any notes associated with specific spots.
35.Once all microglial processes have been tracked via spot placement, press the ‘tracks’ and ‘spots’ buttons in the control panel window (Fig. 5A). This will open a window containing three spreadsheets labeled, Spots, Edges, and Tracks. These provide information on the individual spots, the links between the spots, and the averages for each process. These can then be exported using the ‘Export to CSV’ button in the top left of the window. The TrackScheme map can be exported using the export function located on the top toolbar of the TrackScheme window.
36.Finally, save your tracking. To do this, click the save button at the bottom left of the control panel and save it to a safe location. This file can be accessed later using ‘Plugins > tracking > load a TrackMate file’.
COMMENTARY
Background Information
Recent decades have seen many advances in our understanding of microglia, a population of glial cells within the central nervous system. We no longer think of them as simple, reactive, immune cells—we now know them to be highly dynamic and morphologically plastic cells with a growing number of described functions. One such function is in the regulation of synaptic health and connectivity. This function was first described when microglia were observed contacting dendritic spines in interactions that varied in duration and correlated with spine activity and size (Wake et al., 2009). Many of the smaller spines received frequent contacts from microglial processes, while the less active spines received more extended contacts. Following these contacts, spines were shown to either increase or decrease in size, correlated with the duration of the microglial contact. These findings were quickly followed by studies showing that microglia play a vital role in the regulation of synapses through the synaptic pruning stage of development (Ji et al., 2013; Paolicelli et al., 2011). During this critical period, microglia:dendrite contact plays a role in developing post-synaptic structures, promoting the production of dendritic filopodia that will later develop into dendritic spines (Miyamoto et al., 2016). In addition to production, microglia have also been associated with regulating the number and functionality of synapses during development. Mice that have undergone microglial ablation have significantly reduced synaptic density, while mice that have had the chemokine receptor CX3CR1 knocked out have a deficiency in the number of mature, functioning synapses (Basilico et al., 2019; Ji et al., 2013; Zhan et al., 2014). Microglia:synapse interactions are beginning to be recognized as a life-long phenomenon. Although many of the seminal studies focused on earlier periods of brain development where the high frequency of synaptic contacts facilitated efficient data collection, more recent reports have shown that the relationship between microglia and synapses could be equally important in adulthood, with young adult mice experiencing reduced synaptic density and poor long-term memory following microglia ablation (Basilico et al., 2022).
The idea that microglia might maintain a role in synaptic maintenance in the brain has resulted in the use of diverse experimental approaches to further understand the dynamic relationship between microglia and synapses. Previous studies used multi-photon microscopy to track the movements of microglia and the dynamics of their interactions with dendritic spines (Miyamoto et al., 2016; Wake et al., 2009). Multi-photon imaging allows for repeatable data collection from healthy animals over a long period; however, studies have shifted to other methods of measurement, such as live slice imaging, and indirect methods, such as electrophysiology (Basilico et al., 2019; Weinhard et al., 2018). The invasive nature of these techniques prohibits longer-term tracking of microglia:synapse interactions in the intact brain across the animal's life span. The requirement for long-term imaging is where multi-photon microscopy has its crucial advantage. A stable, relatively non-invasive window placed over the upper layers of the cortical neuropil allows synaptic structures to be revisited multiple times over many days, weeks, or months.
Current multi-photon microscopy techniques, however, are not without their pitfalls. At this time, these studies have not been attempted in other species, so all findings have come from mouse studies. Historically, genetically inserted fluorophores under the control of various promotors have been used with multi-photon microscopy. Unfortunately, not all genetically inserted fluorescent proteins are created equal. Some fluorophores cause disruptions to cellular pathways in specific cell types, which restricts the choice of imaging channel and makes it difficult to image multiple cell types at once, a requirement of visualizing microglia:dendrite interactions. The most robust commercially available mouse lines use an inserted green fluorescent protein (GFP), a popular fluorophore due to its high signal-to-noise ratio. By linking gfp to the Thy-1 or CX3CR1 promoters, subpopulations of excitatory neurons and microglia can be imaged. These commercially available mouse lines can then be crossed to produce lines that express GFP in both cell types, allowing them to be imaged simultaneously. However, this dual expression does not solve the problem, as having both cells visible in a single imaging channel can easily lead to chaotic images with multiple structures of interest in a single channel. Depending on the density and intensity of GFP expression in the brain, these overcrowded channels make interpreting images challenging and any automation of image analysis incredibly complex. There has been some success in addressing this problem using a yellow fluorescent protein (YFP) linked to the Thy1 promoter in mice; however, variations in sparse labeling can make imaging difficult.
In addition to challenges with imaging multiple cell populations in a single preparation, much of the published literature describes image acquisition of microglia:synapse interactions in 4- to 5-min intervals (Miyamoto et al., 2016; Sipe et al., 2016). In contrast, in live slice imaging, microglial contacts with post-synaptic elements were shown to take 4.2 ± 0.85 s, and removing pre-synaptic structures took as little as 3 min (Weinhard et al., 2018). These time frames suggest current commonly used imaging protocols for observing microglia:synapse interactions are too far apart to capture all of the interactions accurately.
This protocol offers increased accuracy and is robust enough to be applied to other cell types. By imaging both cell types in the same channel, we decrease the time to capture an image to 1 min, greatly reducing the chance of missing any interactions. We then use widely available software and plugins to both clean and annotate the image, making this protocol accessible to any lab with multi-photon facilities. While we have outlined the protocols used in measuring interactions between microglia and neurons, there is no reason the same principles could not be applied to other cell types. For example, interactions between microglia and axons or astrocytes could be tracked with minor tweaks to the protocol.
Critical Parameters
Drift
ROI drift is one of the greatest sources of error for repeated imaging. The measurements in each image are taken relative to their position in the previous image. If the ROI drifts in any plane, the drift will be measured in addition to the movement, providing inaccurate and inconsistent results. While we do have methods of accounting for drift, prevention is better than a cure. There are two key things to consider around drift when imaging, the first being the source of the drift. Drift typically occurs due to poor restraint of the animal/imaging stage or because the microscope is not returning to the exact same starting location after each image is collected. Provided the microscope is well maintained, the cause of the drift is likely the restraint of the animal.
Loop timing
Once established, loop timing should remain unchanged whenever possible, and any changes to the timing should be recorded. The analysis done by TrackMate assumes that the time between each image is constant and calculates speed accordingly. Any change can be accounted for easily if you know the breakpoint and the duration of the break. For example, knowing that there would be a break at every eighth minute and a slightly longer time between microglia images allows us to adjust our results relatively easily. If breaks are made at random or are not adequately recorded, you risk disrupting the calculations made by TrackMate, resulting in inaccurate measurements of process speed.
Troubleshooting
See Table 1.
| Problem | Cause | Solution |
|---|---|---|
| Noisy images | High gain setting | If you are actively collecting images, lower the gain setting. If you have already completed image collection, use the CANDLE plugin in MATLAB to improve your image quality. |
| Over-saturated images | High power setting | Lower the laser power during image collection. |
| Jerking or wobbling images | Poorly secured head or labored breathing |
Check the positioning of the animal's head; the restraint should be as tight as it can safely be. If breathing is labored or gasp-like, check the oxygen and anesthetic settings. The anesthetic may be too high or the oxygen too low. If the animal is getting enough oxygen and breathing is still gasp-like, check the animal's position. The animal should lay flat with a straight line running from its head to the end of its spine. Adjust the body position—if the stage has been angled to image the ROI or the animal is older and likely fatter, it could require support to keep it in place. If poor breathing persists, end the imaging session, as you risk the health of the animal. |
| Wet sounds when the animal breathes | Poor inhalation | Check and adjust the animal's anesthetic and position as described above. |
| X, Y, or Z drift | Poorly secured animal or stage drift | Check to see if the animal and the stage are adequately secured, and if not, secure them. If the problem persists, reduce the drift adjustment time between images (e.g., check for and correct drift every 4 min instead of 8) |
| MATLAB is not launching ScanImage or CANDLE | Incorrect file path | Check the address bar at the top of the screen (Fig. 2A) for the address of the plugin you are trying to run. If the address is incorrect, click on the “browse for folders” button to the left of the address and select the correct folder. |
| MATLAB is slowing down | Overburdened/insufficient RAM |
The MATLAB scripts can be demanding on a computer's memory, and the available memory can start to run low as you annotate spines. If you find MATLAB slowing down, save your progress, close MATLAB, and open it again. This will reset the available memory and speed up the program. Increasing the computer's RAM capacity will also rectify this problem. |
| Images not concatenating | Inconsistent image size | Review all the image stacks and check that each has the same number of z-slices and the same x, y measurements, then adjust as needed. |
| TrackMate controls not working | Plugin updated | TrackMate is a continuously updated plugin that is still being developed at the time of this publication. If the controls are not working, check the version you are using, update the plugin, and refer to the Fiji website to look for any significant updates. The likely cause of the controls not working is an update to the plug-in's inputs, meaning the shortcut keys may have changed. |
| Error messages when opening TrackMate save data | Annotated imaged moved | If you have moved the image file, you will not be able to open the saved data. If you cannot open the TrackMate save data, move the image file back to its original position and try again. |
| CSV datasheets produced by TrackMate give inaccurate/impossible numbers | Incorrect dimensions on original image | The TrackMate measurements are based on the dimensions of the original image; for example, if each pixel in the image is set to measure 0.2 µm and TrackMate measures five pixels, it will give a total of 1.0 µm. As a default, Fiji measures everything in pixels. If you are getting strange measurements or NaN (meaning Not a Number), check to see that you have correctly set the measurements for the image, including both distance and time (see Microglia Annotation, step 3). |
| Unable to find a specific spot in TrackMate | Incorrect naming | Open the tracking session and the TrackScheme interactive map. Name the spot you want to find in the .csv file, save the TrackScheme, and close it. Re-export the .csv and search for the new spot name. The same method can be used to find specific tracks in the .csv file. |
Understanding Results
We used this protocol to track the interactions between microglial processes and dendritic spines. We imaged mice at 3, 4, and 5 months of age. We established which spines were stable by tracking the spines that were present across all three time points and tracking the movement of the microglial processes that contacted stable spines at 4 months of age (n = 20, contact). We then tracked an additional twenty processes from the same groups of microglial cells in the same images that were not making visible contact with a dendritic spine for comparison (n = 20, no contact). We used this data to establish a baseline of microglial process behavior in young adult mice.
Microglia and dendritic spines were tracked over 3 months
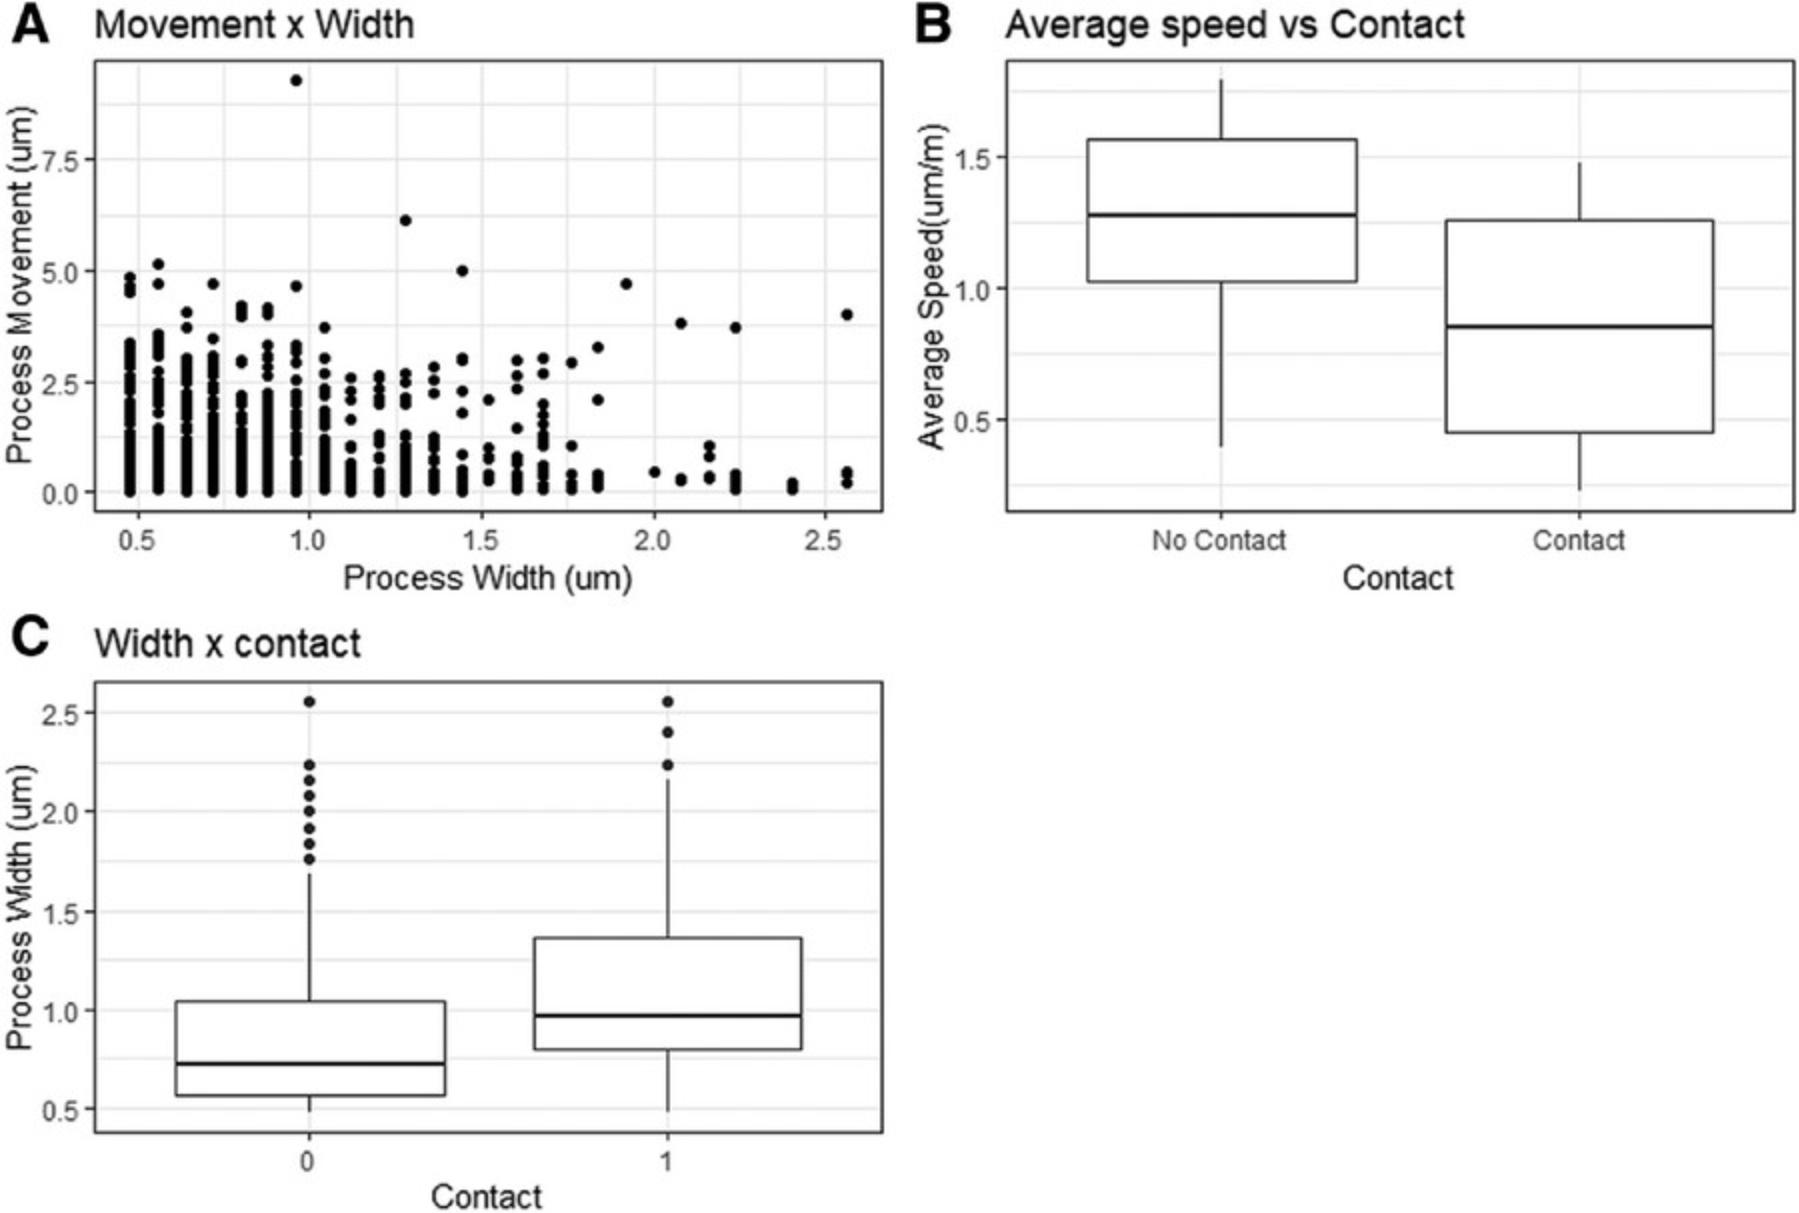
We successfully tracked microglia process movement and synaptic turnover in three animals over 3 months. The images from each session were successfully cleaned and curated using the described method, and each one was then annotated in MATLAB and Fiji. The annotation generated data for the speed, directionality, branching, radius, and dwell time of each microglia process making contact with confirmed stable dendritic spines. Below, we present data from mice at 4 months of age (Fig. 9).
Does microglia process speed correlate with microglial process size?
We compared the width of a microglial process, recorded as process ‘radius’ by TrackMate, with the speed it traveled in the minute after measurement. The width measurement is calculated only in the X and Y planes, but in reality, the processes are three-dimensional, with the width being a proxy measure for process size (volume).
We chose to restrict these measurements to processes making no visible contact, as the group making visible contact spent much of their time in near-stationary contacts. These measurements were compared for all tracked processes not in visible contact with a spine, giving a total of 640 measurements. The data were then compared using linear regression.
The width of the process was found to have no correlation with the process's speed. The average process had a speed of 1.28 µm/min, with speed having no significant effect on any changes in the width of the microglial tip, as seen in Figure 9A (1.28 µm/min – 0.00546, R2 = 0.001, F (1, 606) = 0.000443, p = .983).
Do microglia making visible contact with a dendritic spine move at a slower speed than those not making visible contact?
In addition to minute-to-minute measurements, the TrackMate output includes average measurements for each track (process). These track averages were used to compare speeds across processes that made visible contact with a dendritic spine (contact) and those that did not make visible contact (no contact). The average speed of processes moving in the neuropil not making visible contact with a labeled spine was 1.25 µm/min (n = 20). This speed dropped by 0.410 µm/min (n = 20) for any process that made visible contact with a labeled spine during the imaging session, which was statically significant (0.410 µm/min, p = .003; Fig. 9B).
Does microglial process width increase whilst in contact with a visible dendritic spine?
Microglial process tip width was tracked for all processes and was highly variable, with the average width being 0.846 µm (± 0.0150, n = 882) (Fig. 9C). The width was measured as a microglia process at the point that it contacted the dendritic spine. Process width increased by an average of 0.260 µm (± 0.0286, p = <.001) when the microglial processes contacted a dendritic spine.
Dwell time (3D) for non-contact processes
Microglial processes were classified as stationary if their movement was less than 0.5 µm for two consecutive minutes. The decision to use 0.5 µm as the threshold for movement was based on observation of very small movements of the process, during which time visible contact with dendritic structures was maintained. With this threshold in place, we looked at the movement of 20 microglial processes that were not making contact with a visible dendrite. Of these 20 processes, 12 were stationary for at least 2 min, and of these, eight were stationary for at least 4 min. Given that only a small subpopulation of excitatory neurons are labeled with Thy-1gfp, these pauses could likely represent microglial processes contacting non-labeled synaptic elements. This hypothesis could be investigated by comparing the width changes of the stationary microglial processes with the width of the processes leading up to and making contact with visible dendritic spines, enabling a proxy measurement of total microglia:dendrite contacts.
Time Considerations
In Basic Protocol 1, each imaging session will take approximately 1 hr to complete, not including set-up and post-anesthesia recovery time. For Basic Protocol 2, image alignment and preparation will take 10 to 15 min per hyperstack, though it should be noted that not all of this is active work, as the denoising and hyperstack alignment are automated. The time taken for Basic Protocol 3 is the most variable and will depend on the number of microglial processes being investigated. We found that tracking 10 to 20 microglial processes in each hyperstack took about 15 to 30 min. A hyperstack with fewer processes of interest or sparser GFP labeling will take less time, and a densely labeled or noisy image will take longer.
Acknowledgments
This project was funded by a Dementia Australia Research Foundation (formerly Alzheimer's Australia Dementia Research Foundation) project grant to Jenna Ziebell and the J.O. and J.R. Wicking Trust. The authors would like to thank Dr. Jessica Collins for preliminary multi-photon imaging and Dr. William Bennett, Dr. Barbora Fulopova, and Yasmine Doust for technical assistance.
Open access publishing facilitated by University of Tasmania, as part of the Wiley - University of Tasmania agreement via the Council of Australian University Librarians.
Author Contributions
Ross C. Langley : Conceptualization, Data curation, Formal analysis, Methodology, Original draft writing, review, and editing; Alison J. Canty : Conceptualization, Methodology, Supervision, Draft review and editing; Jenna M. Ziebell : Conceptualization, Funding acquisition, Methodology, Project administration, Supervision, Validation, Draft review and editing.
Conflict of Interest
The authors declare no conflict of interest.
Open Research
Data Availability Statement
The data supporting this protocol will be made available upon request.
Literature Cited
- Basilico, B., Ferrucci, L., Ratano, P., Golia, M. T., Grimaldi, A., Rosito, M., Ferretti, V., Reverte, I., Sanchini, C., Marrone, M. C., Giubettini, M., De Turris, V., Salerno, D., Garofalo, S., St-Pierre, M. - K., Carrier, M., Renzi, M., Pagani, F., Modi, B., … Ragozzino, D. (2022). Microglia control glutamatergic synapses in the adult mouse hippocampus. Glia , 70(1), 173–195. https://doi.org/10.1002/glia.24101
- Basilico, B., Pagani, F., Grimaldi, A., Cortese, B., Di Angelantonio, S., Weinhard, L., Gross, C., Limatola, C., Maggi, L., & Ragozzino, D. (2019). Microglia shape presynaptic properties at developing glutamatergic synapses. Glia , 67(1), 53–67. https://doi.org/10.1002/glia.23508
- Coupé, P., Munz, M., Manjón, J. V., Ruthazer, E. S., & Collins, D. L. (2012). A CANDLE for a deeper in vivo insight. Medical Image Analysis , 16(4), 849–864. https://doi.org/10.1016/j.media.2012.01.002
- Cramer, S. W., Carter, R. E., Aronson, J. D., Kodandaramaiah, S. B., Ebner, T. J., & Chen, C. C. (2021). Through the looking glass: A review of cranial window technology for optical access to the brain. Journal of Neuroscience Methods , 354, 109100. https://doi.org/10.1016/j.jneumeth.2021.109100
- Holtmaat, A., Bonhoeffer, T., Chow, D. K., Chuckowree, J., De Paola, V., Hofer, S. B., Hübener, M., Keck, T., Knott, G., Lee, W. C. A., Mostany, R., Mrsic-Flogel, T. D., Nedivi, E., Portera-Cailliau, C., Svoboda, K., Trachtenberg, J. T., & Wilbrecht, L. (2009). Long-term, high-resolution imaging in the mouse neocortex through a chronic cranial window. Nature Protocols , 4(8), 1128–1144. https://doi.org/10.1038/nprot.2009.89
- Ji, K., Akgul, G., Wollmuth, L. P., & Tsirka, S. E. (2013). Microglia actively regulate the number of functional synapses. PLoS ONE , 8(2), e56293. https://doi.org/10.1371/journal.pone.0056293
- Kılıç, K., Tang, J., Erdener, Ş. E., Sunil, S., Giblin, J. T., Lee, B. S., Postnov, D. D., Chen, A., & Boas, D. A. (2020). Chronic imaging of mouse brain: From optical systems to functional ultrasound. Current Protocols in Neuroscience , 93(1), e98. https://doi.org/10.1002/cpns.98
- Miyamoto, A., Wake, H., Ishikawa, A. W., Eto, K., Shibata, K., Murakoshi, H., Koizumi, S., Moorhouse, A. J., Yoshimura, Y., & Nabekura, J. (2016). Microglia contact induces synapse formation in developing somatosensory cortex. Nature Communications , 7(1), 12540. https://doi.org/10.1038/ncomms12540
- Paolicelli, R. C., Bolasco, G., Pagani, F., Maggi, L., Scianni, M., Panzanelli, P., Giustetto, M., Ferreira, T. A., Guiducci, E., Dumas, L., Ragozzino, D., & Gross, C. T. (2011). Synaptic pruning by microglia is necessary for normal brain development. Science , 333(6048), 1456–1458. https://doi.org/10.1126/science.1202529
- Parkhurst, C. N., Yang, G., Ninan, I., Savas, J. N., Yates, J. R., Lafaille, J. J., Hempstead, B. L., Littman, D. R., & Gan, W. - B. (2013). Microglia promote learning-dependent synapse formation through brain-derived neurotrophic factor. Cell , 155(7), 1596–1609. https://doi.org/10.1016/j.cell.2013.11.030
- Pologruto, T. A., Sabatini, B. L., & Svoboda, K. (2003). ScanImage: Flexible software for operating laser scanning microscopes. Biomedical Engineering Online [Electronic Resource] , 2, 13. https://doi.org/10.1186/1475-925X-2-13
- Sipe, G. O., Lowery, R. L., Tremblay, M., Kelly, E. A., Lamantia, C. E., & Majewska, A. K. (2016). Microglial P2Y12 is necessary for synaptic plasticity in mouse visual cortex. Nature Communications , 7, 10905. https://doi.org/10.1038/ncomms10905
- Wake, H., Moorhouse, A. J., Jinno, S., Kohsaka, S., & Nabekura, J. (2009). Resting microglia directly monitor the functional state of synapses in vivo and determine the fate of ischemic terminals. The Journal of Neuroscience , 29(13), 3974–3980. https://doi.org/10.1523/jneurosci.4363-08.2009
- Weinhard, L., Di Bartolomei, G., Bolasco, G., Machado, P., Schieber, N. L., Neniskyte, U., Exiga, M., Vadisiute, A., Raggioli, A., Schertel, A., Schwab, Y., & Gross, C. T. (2018). Microglia remodel synapses by presynaptic trogocytosis and spine head filopodia induction. Nature Communications , 9(1), 1228. https://doi.org/10.1038/s41467-018-03566-5
- Zhan, Y., Paolicelli, R. C., Sforazzini, F., Weinhard, L., Bolasco, G., Pagani, F., Vyssotski, A. L., Bifone, A., Gozzi, A., Ragozzino, D., & Gross, C. T. (2014). Deficient neuron-microglia signaling results in impaired functional brain connectivity and social behavior. Nature Neuroscience , 17(3), 400–406. https://doi.org/10.1038/nn.3641
INTERNET RESOURCES
HyperStackReg __
* <https://github.com/ved-sharma/HyperStackReg>
For more information on HyperStackReg, including the script and installation guide.
TrackMate __
* <https://imagej.net/plugins/trackmate/getting-started>
For more information on TrackMate including a full user manual, walkthrough, and developer guidelines.
CANDLE __
* <https://sites.google.com/site/pierrickcoupe/softwares/denoising/multiphoton-image-filtering?authuser=0>
For more information on CANDLE, including a full description of the denoising process.
ScanImage __
* <https://scanimage.org/>
The dendritic spine annotations were done using MATLAB scripts included with ScanImage (scim_spineAnalysis.m) (Holtmaat et al., 2009; Pologruto et al., 2003)
For full information on ScanImage.

