Production and use of antigen tetramers to study antigen-specific B cells
Allyssa Phelps, Diego Pazos-Castro, Francesca Urselli, Emily Grydziuszko, Olivia Mann-Delany, Allison Fang, Tina D. Walker, Rangana Talpe Guruge, Jaime Tome-Amat, Araceli Diaz-Perales, Susan Waserman, Jim Boonyaratanakornkit, Manel Jordana, Justin J. Taylor, Joshua F. E. Koenig


Extended
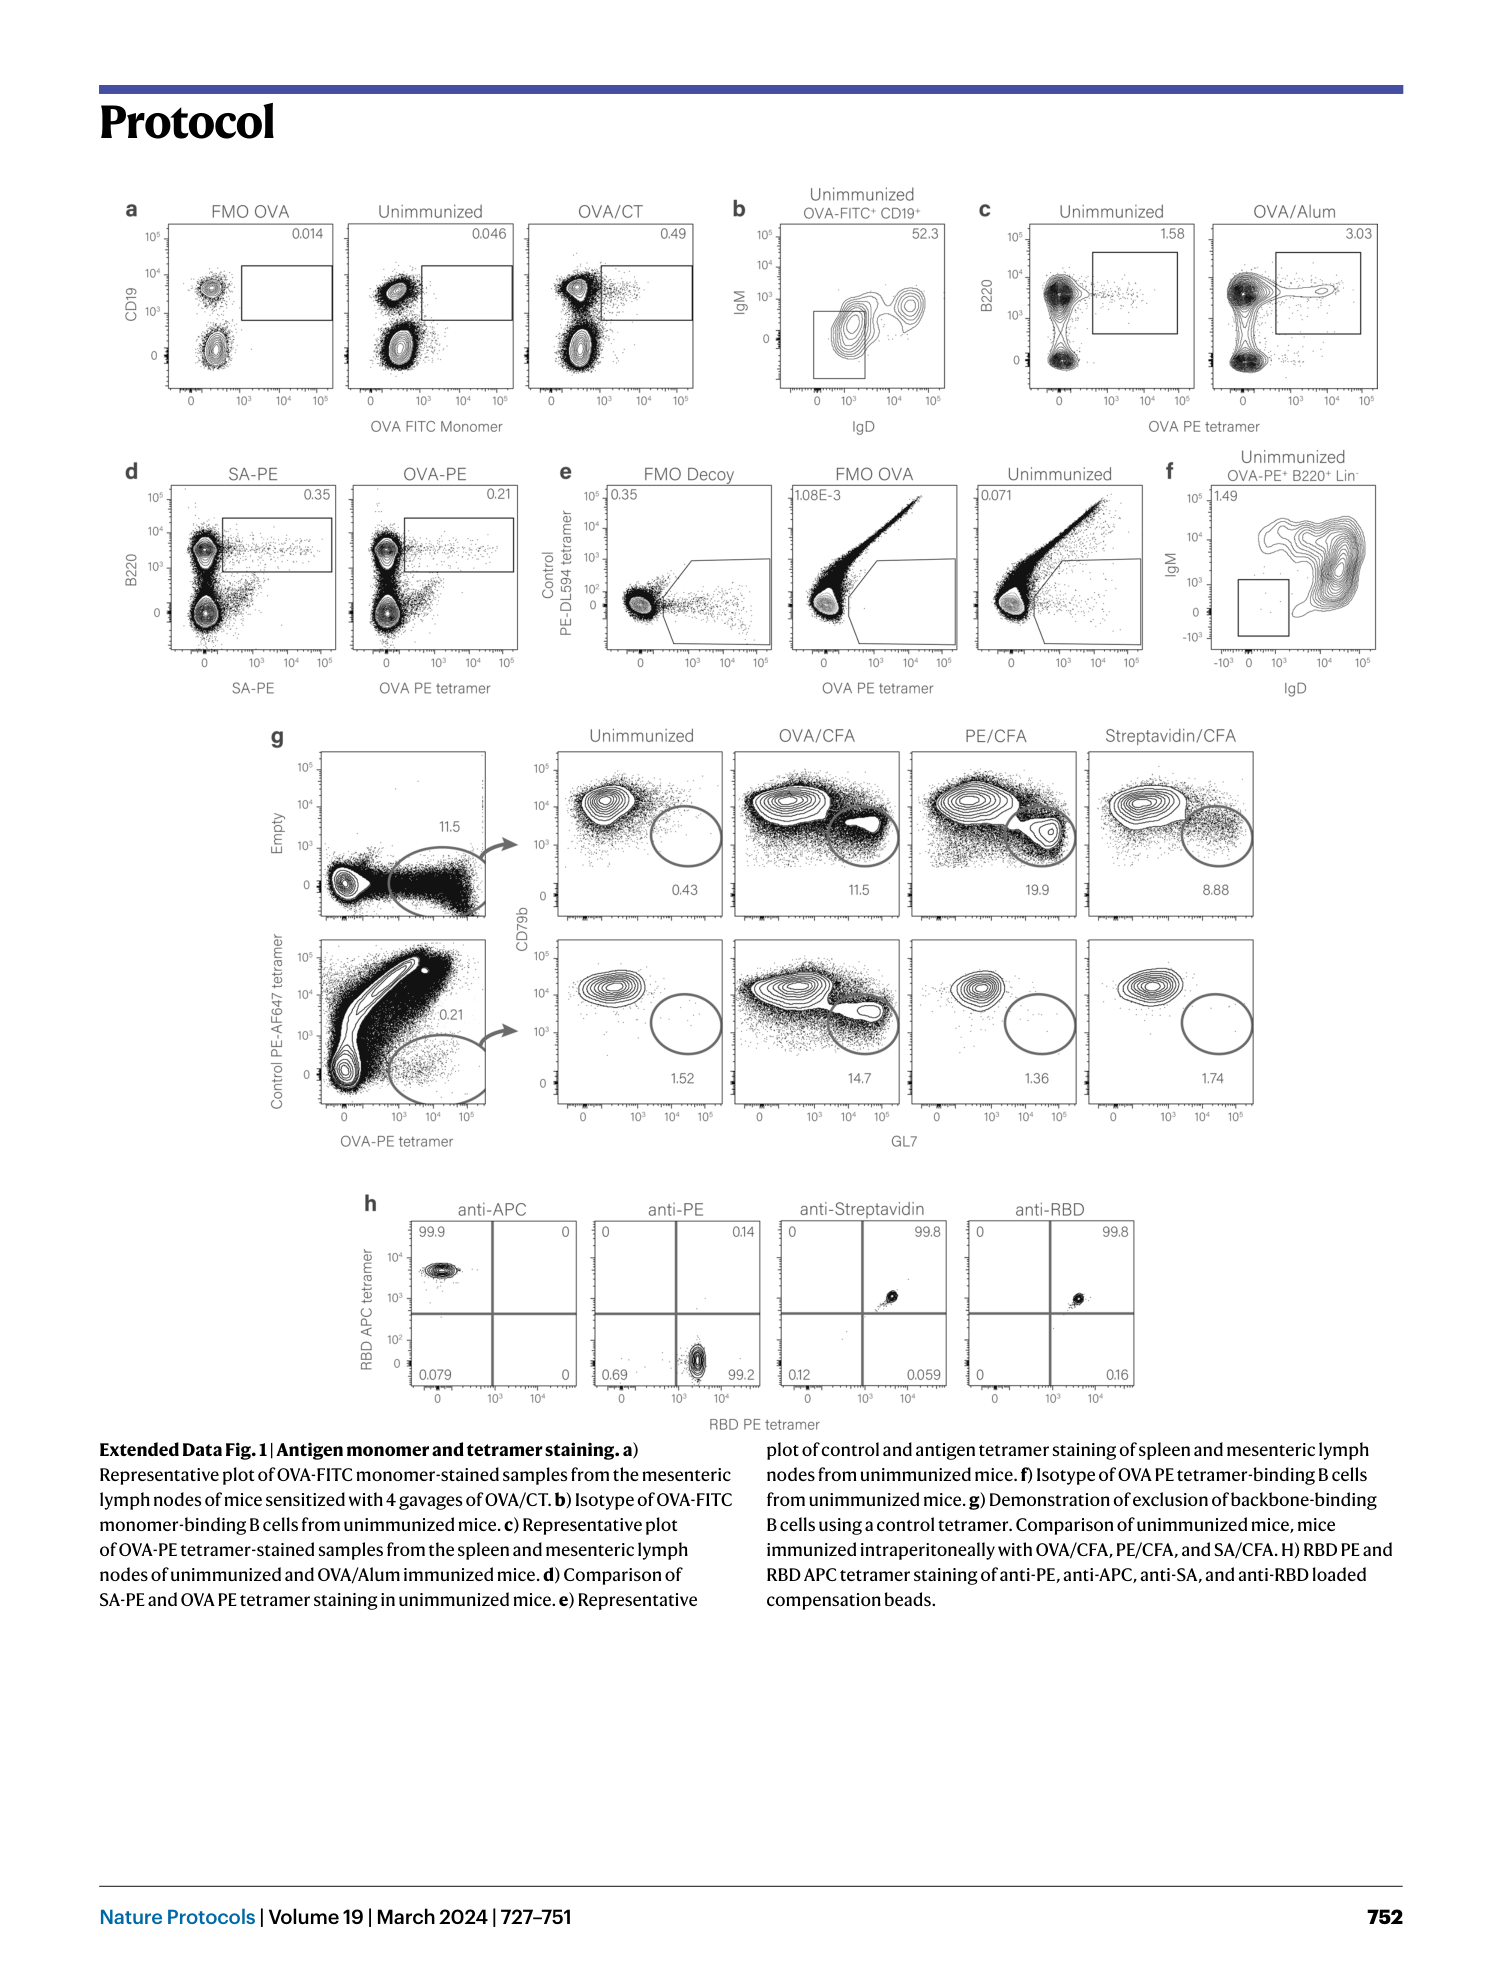
Extended Data Fig. 1 Antigen monomer and tetramer staining.
a ) Representative plot of OVA-FITC monomer-stained samples from the mesenteric lymph nodes of mice sensitized with 4 gavages of OVA/CT. b ) Isotype of OVA-FITC monomer-binding B cells from unimmunized mice. c ) Representative plot of OVA-PE tetramer-stained samples from the spleen and mesenteric lymph nodes of unimmunized and OVA/Alum immunized mice. d ) Comparison of SA-PE and OVA PE tetramer staining in unimmunized mice. e ) Representative plot of control and antigen tetramer staining of spleen and mesenteric lymph nodes from unimmunized mice. f ) Isotype of OVA PE tetramer-binding B cells from unimmunized mice. g ) Demonstration of exclusion of backbone-binding B cells using a control tetramer. Comparison of unimmunized mice, mice immunized intraperitoneally with OVA/CFA, PE/CFA, and SA/CFA. H) RBD PE and RBD APC tetramer staining of anti-PE, anti-APC, anti-SA, and anti-RBD loaded compensation beads.
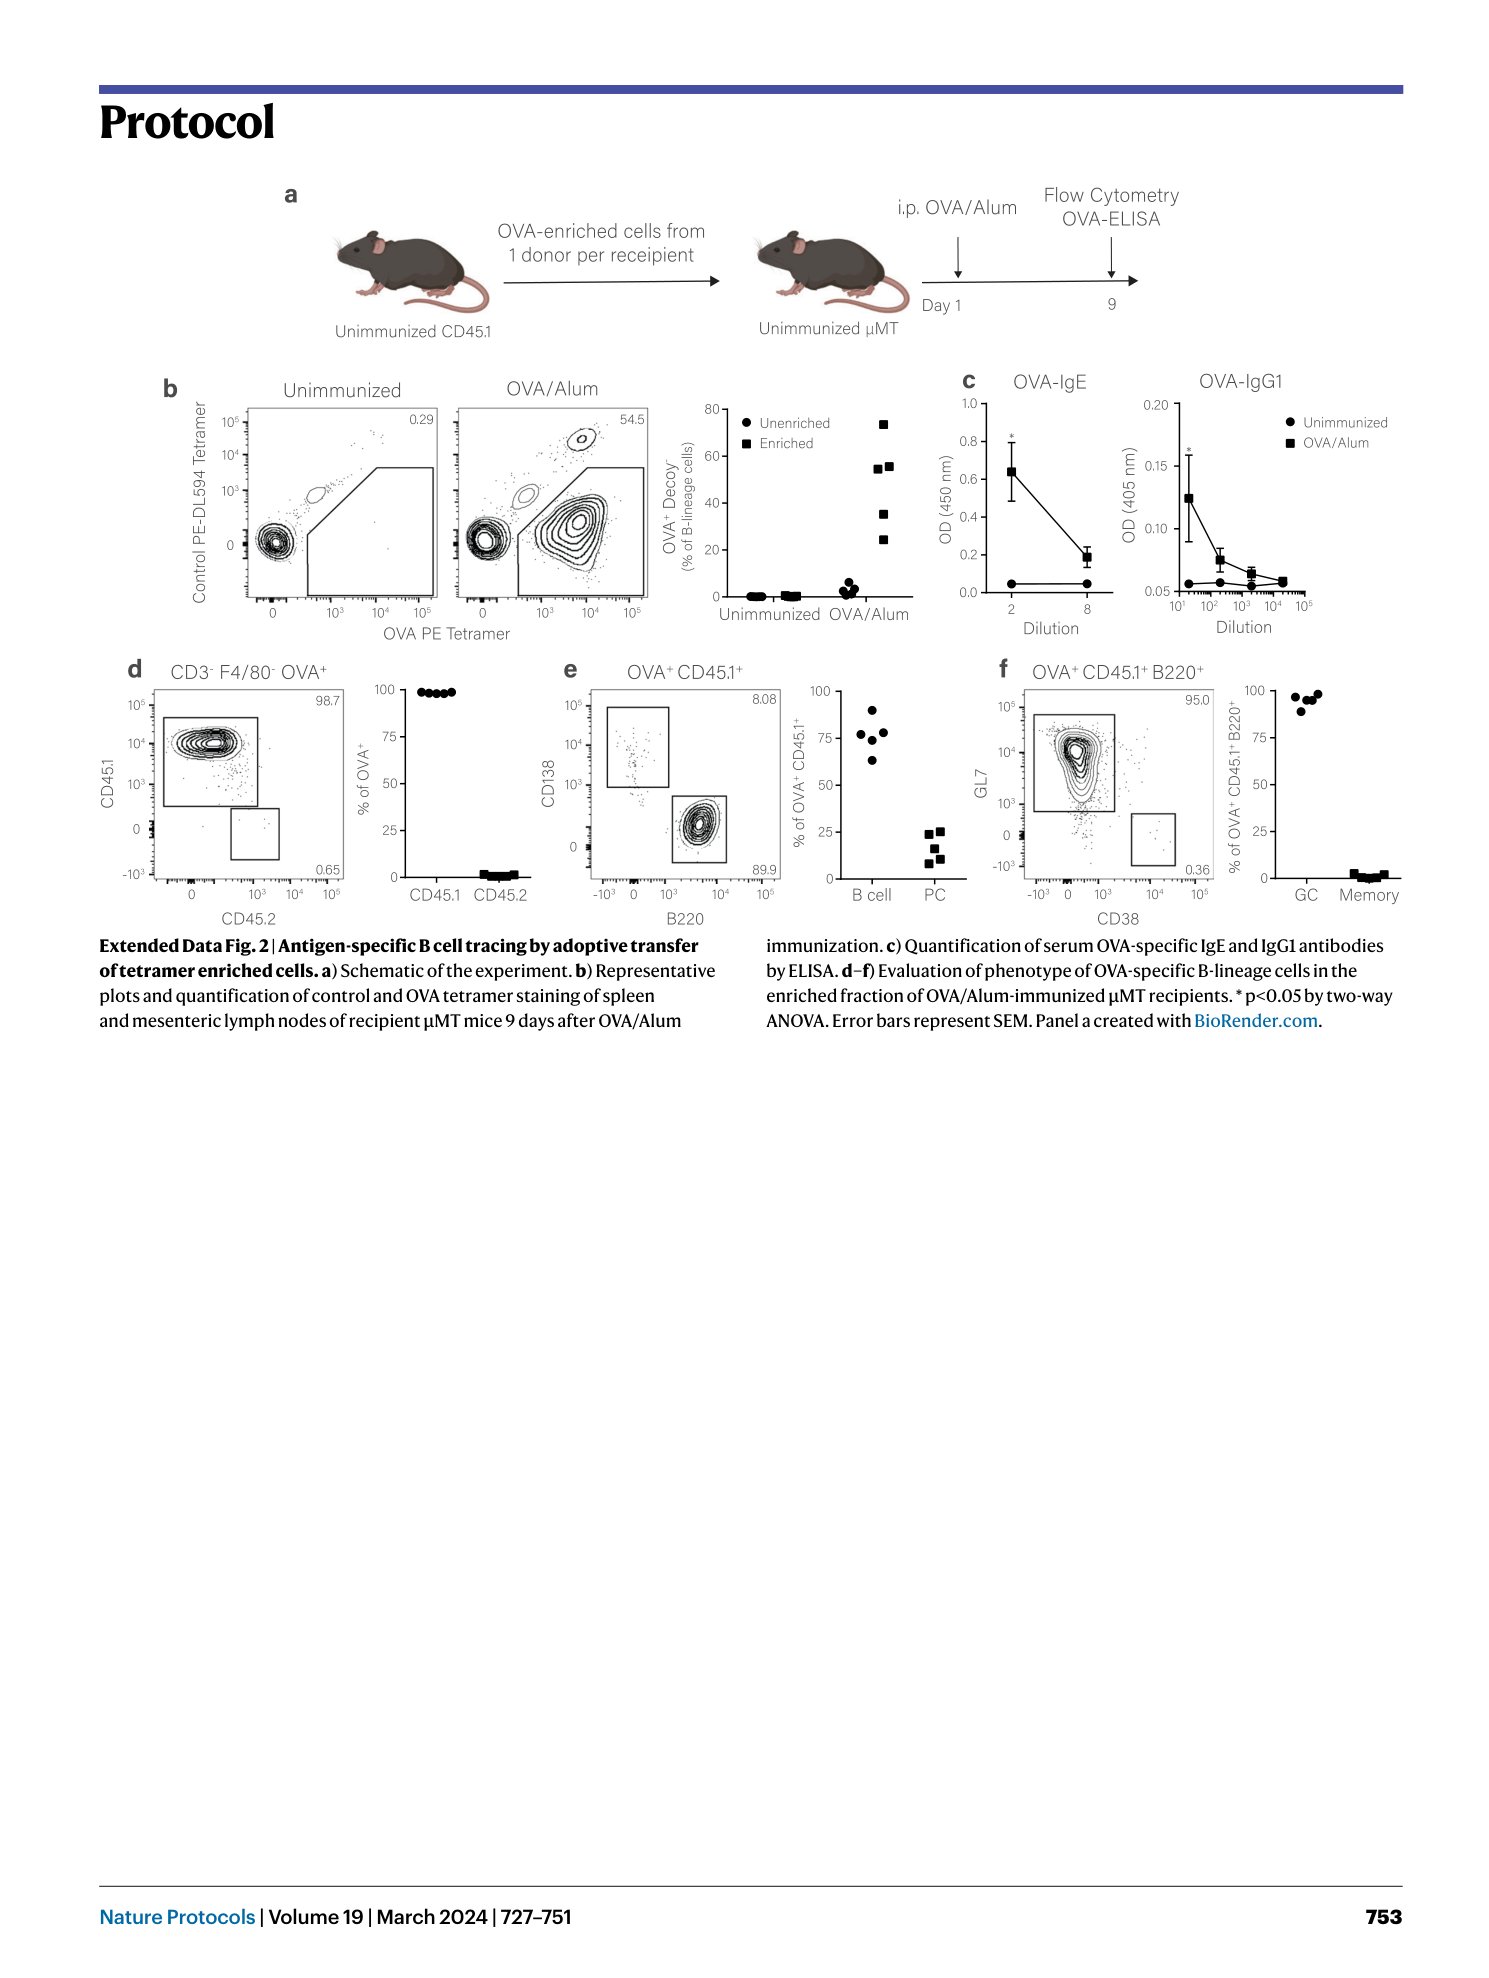
Extended Data Fig. 2 Antigen-specific B cell tracing by adoptive transfer of tetramer enriched cells.
a ) Schematic of the experiment. b ) Representative plots and quantification of control and OVA tetramer staining of spleen and mesenteric lymph nodes of recipient µMT mice 9 days after OVA/Alum immunization. c ) Quantification of serum OVA-specific IgE and IgG1 antibodies by ELISA. d–f ) Evaluation of phenotype of OVA-specific B-lineage cells in the enriched fraction of OVA/Alum-immunized µMT recipients. * p<0.05 by two-way ANOVA. Error bars represent SEM. Panel a created with BioRender.com .
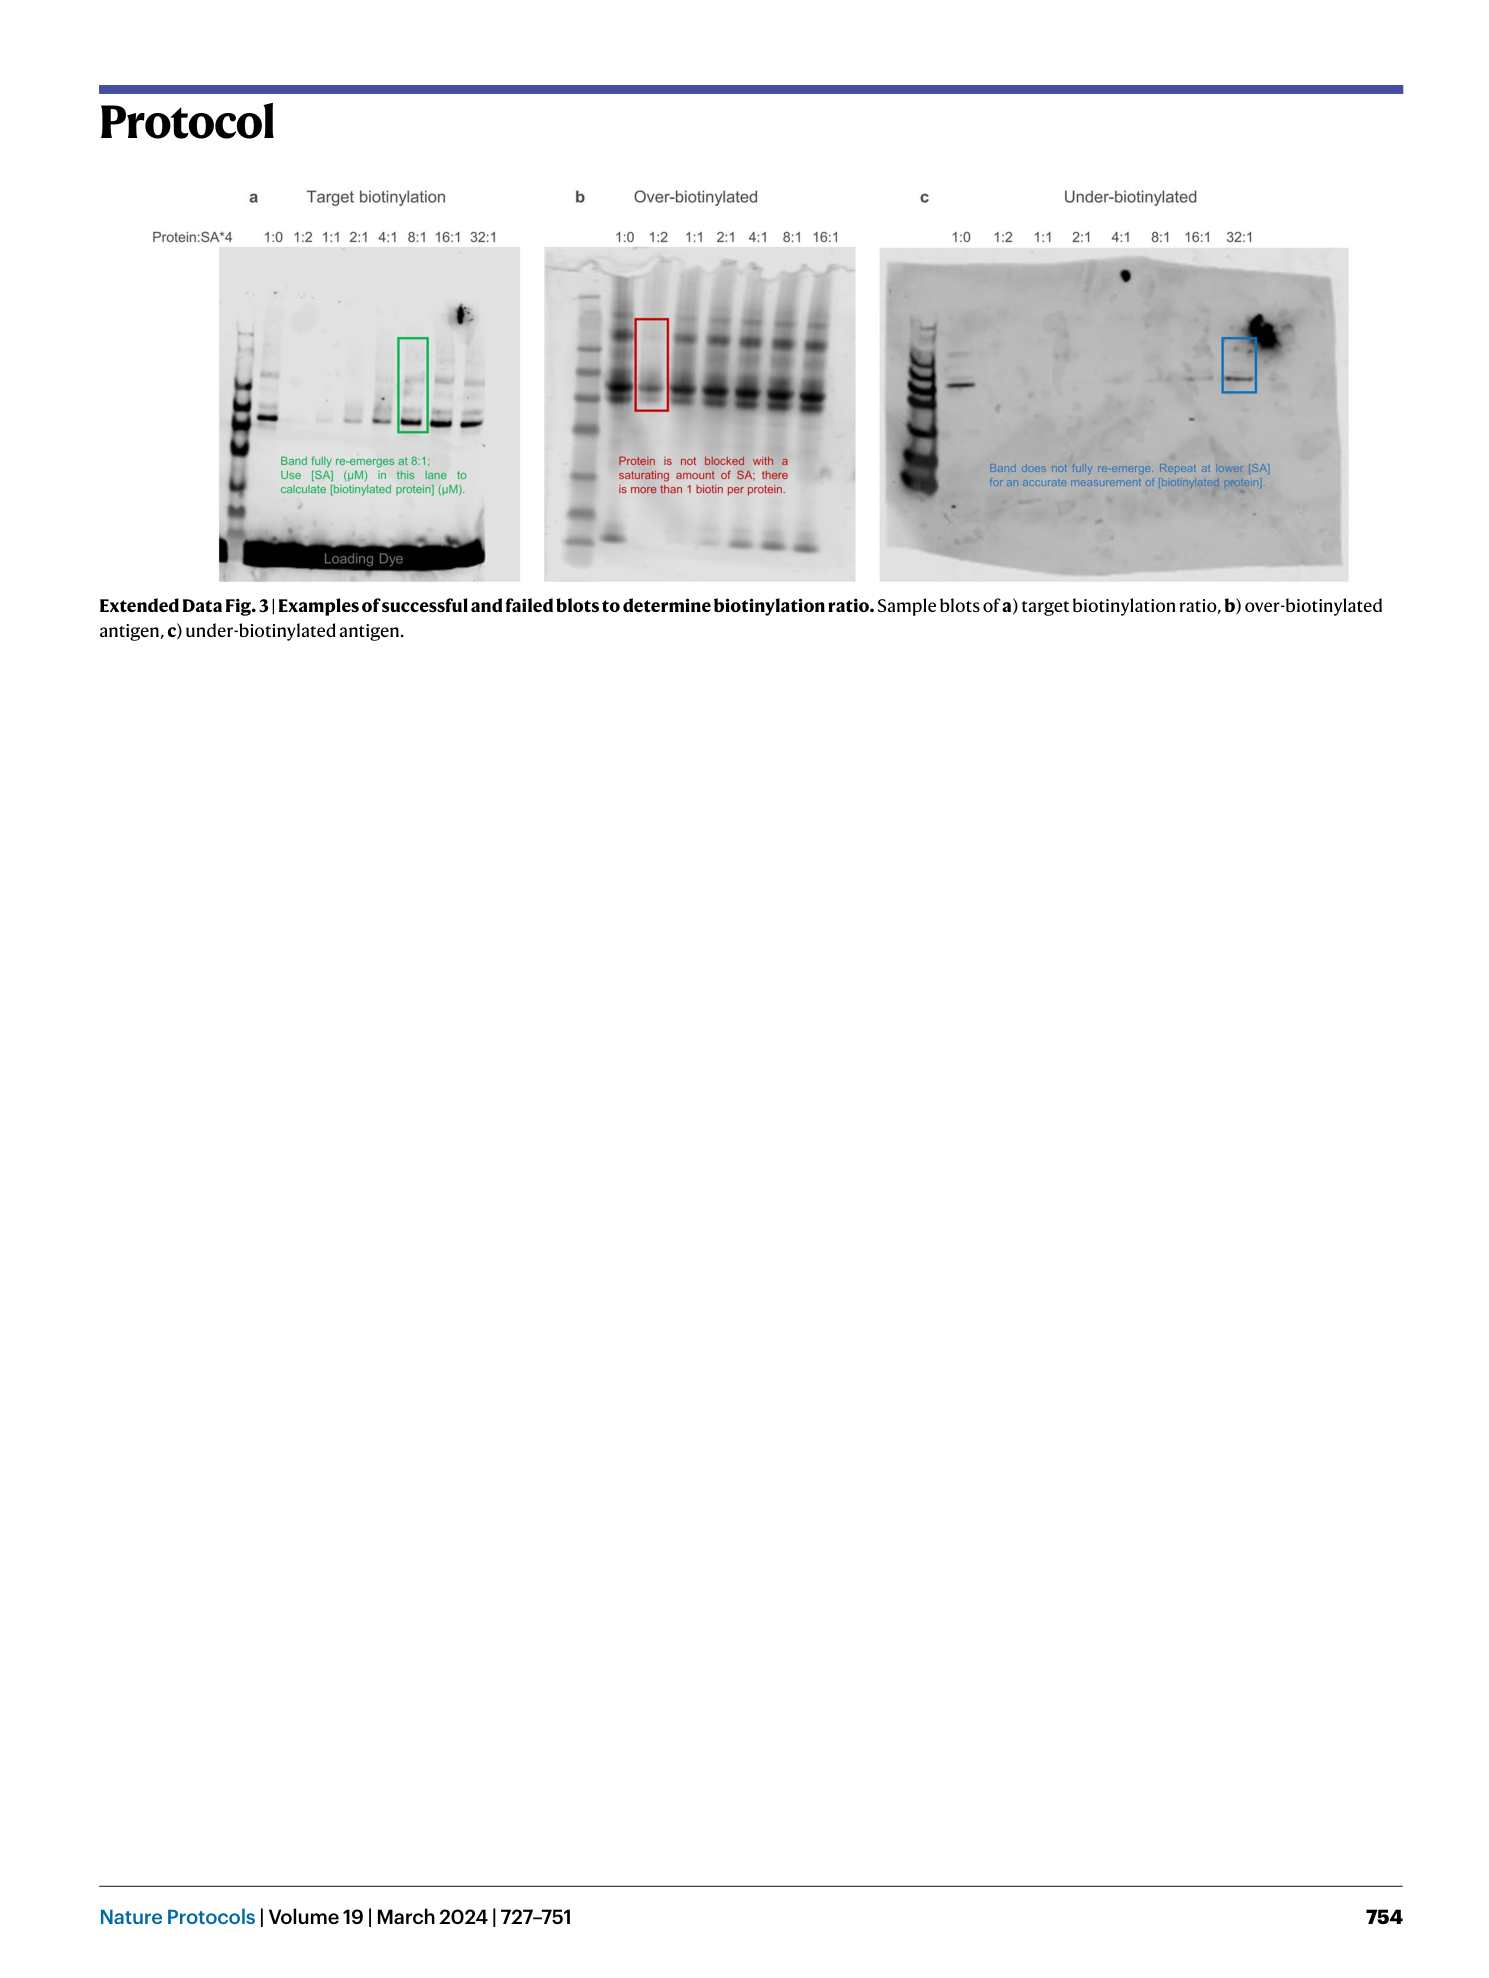
Extended Data Fig. 3 Examples of successful and failed blots to determine biotinylation ratio.
Sample blots of a ) target biotinylation ratio, b ) over-biotinylated antigen, c ) under-biotinylated antigen.
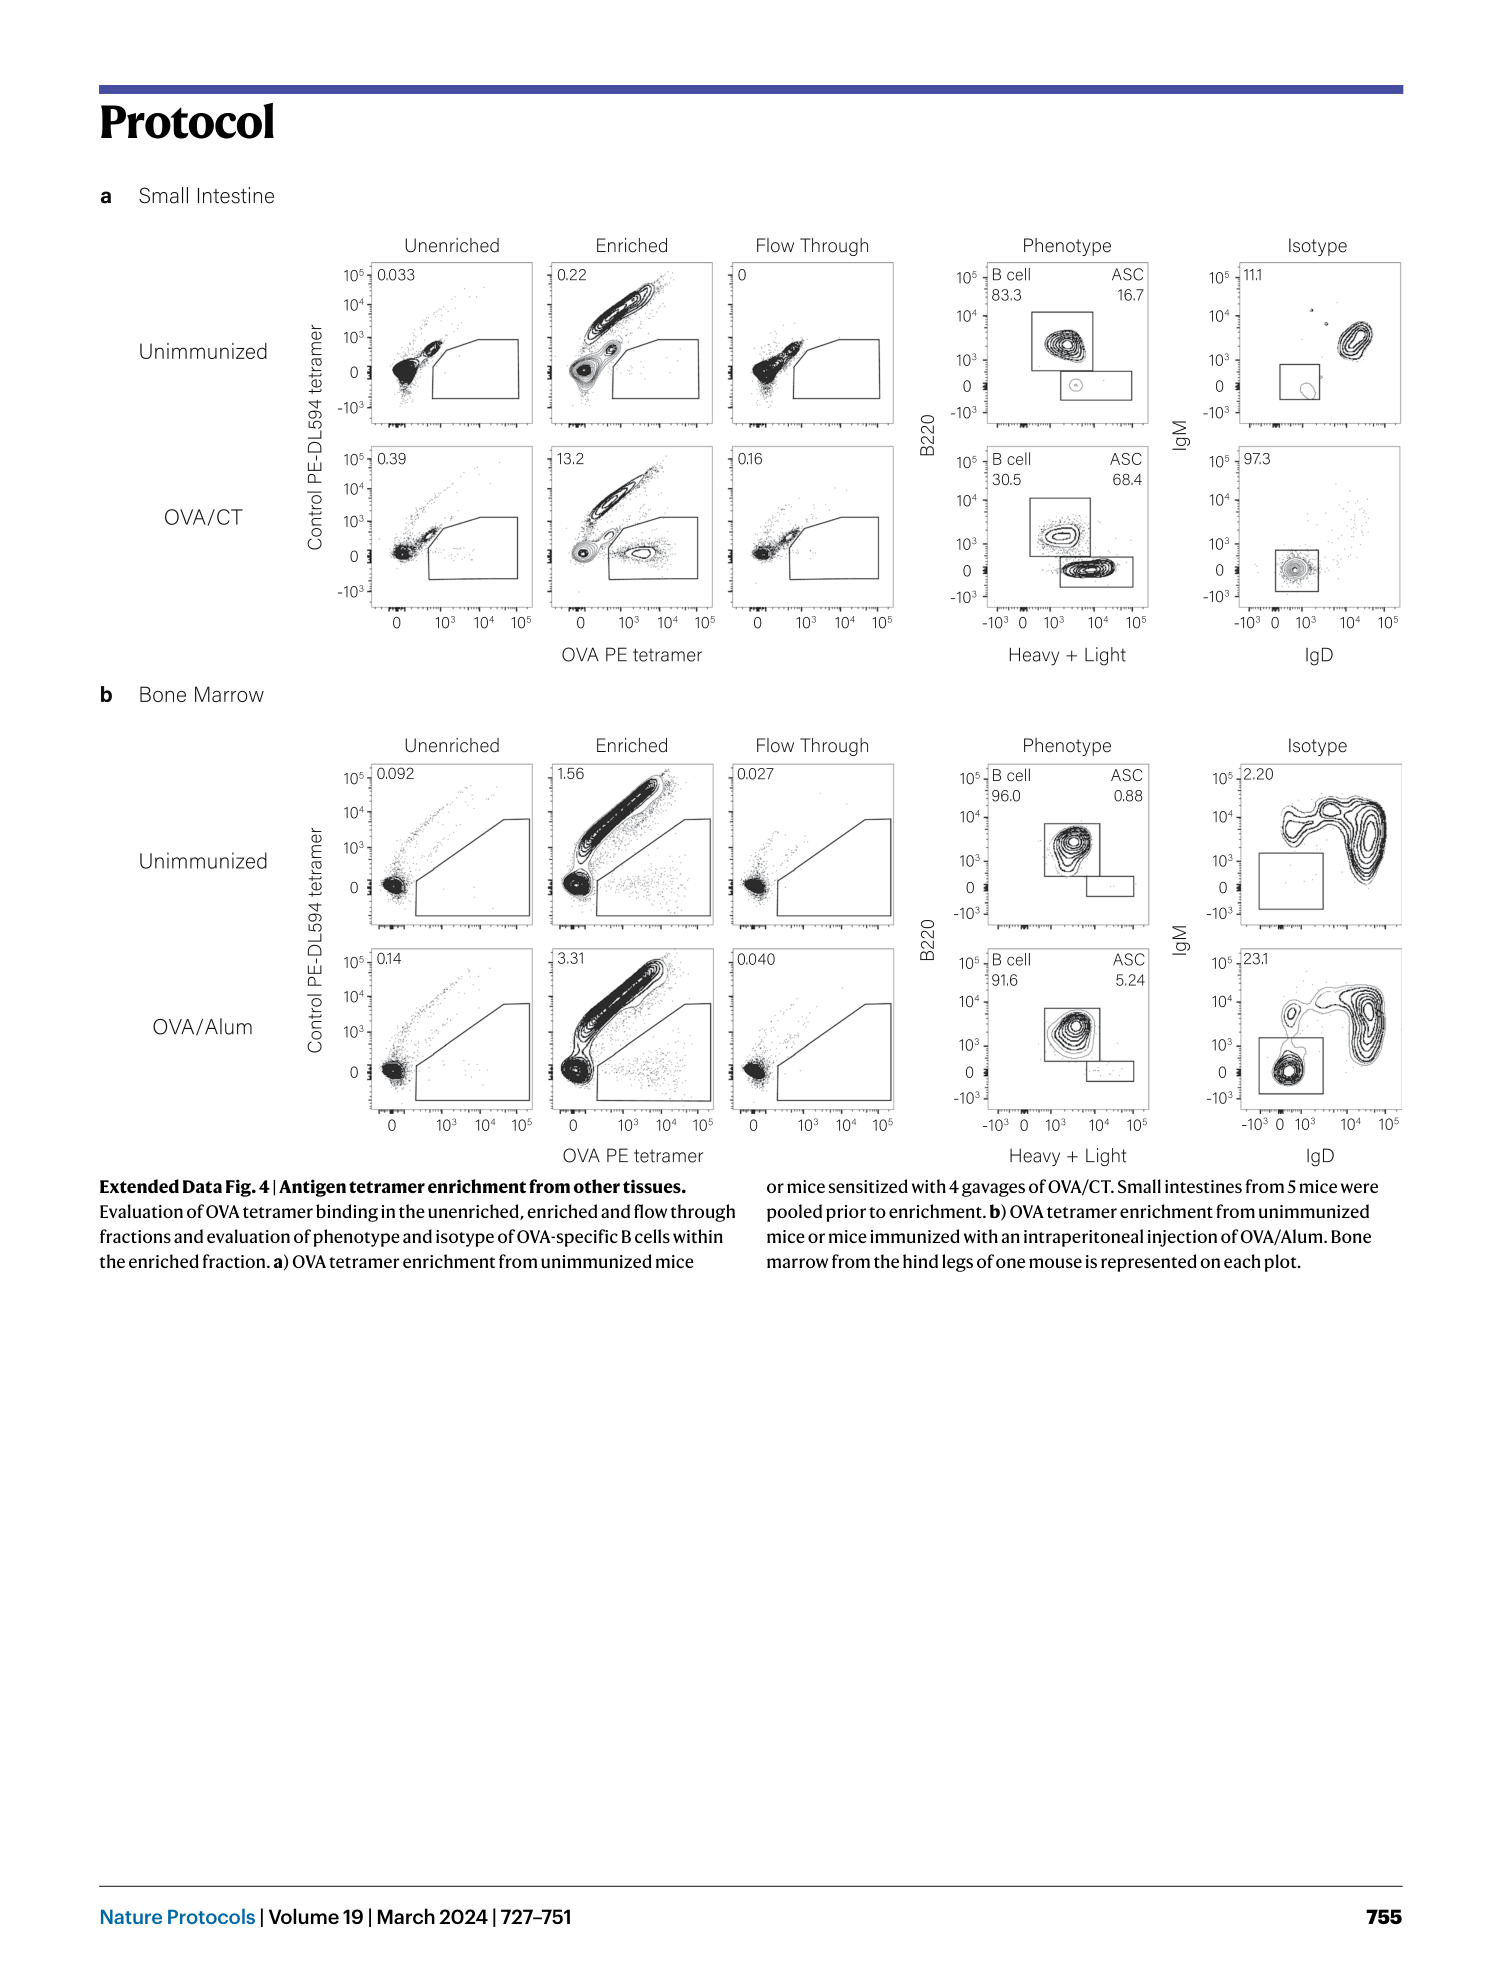
Extended Data Fig. 4 Antigen tetramer enrichment from other tissues.
Evaluation of OVA tetramer binding in the unenriched, enriched and flow through fractions and evaluation of phenotype and isotype of OVA-specific B cells within the enriched fraction. a ) OVA tetramer enrichment from unimmunized mice or mice sensitized with 4 gavages of OVA/CT. Small intestines from 5 mice were pooled prior to enrichment. b ) OVA tetramer enrichment from unimmunized mice or mice immunized with an intraperitoneal injection of OVA/Alum. Bone marrow from the hind legs of one mouse is represented on each plot.
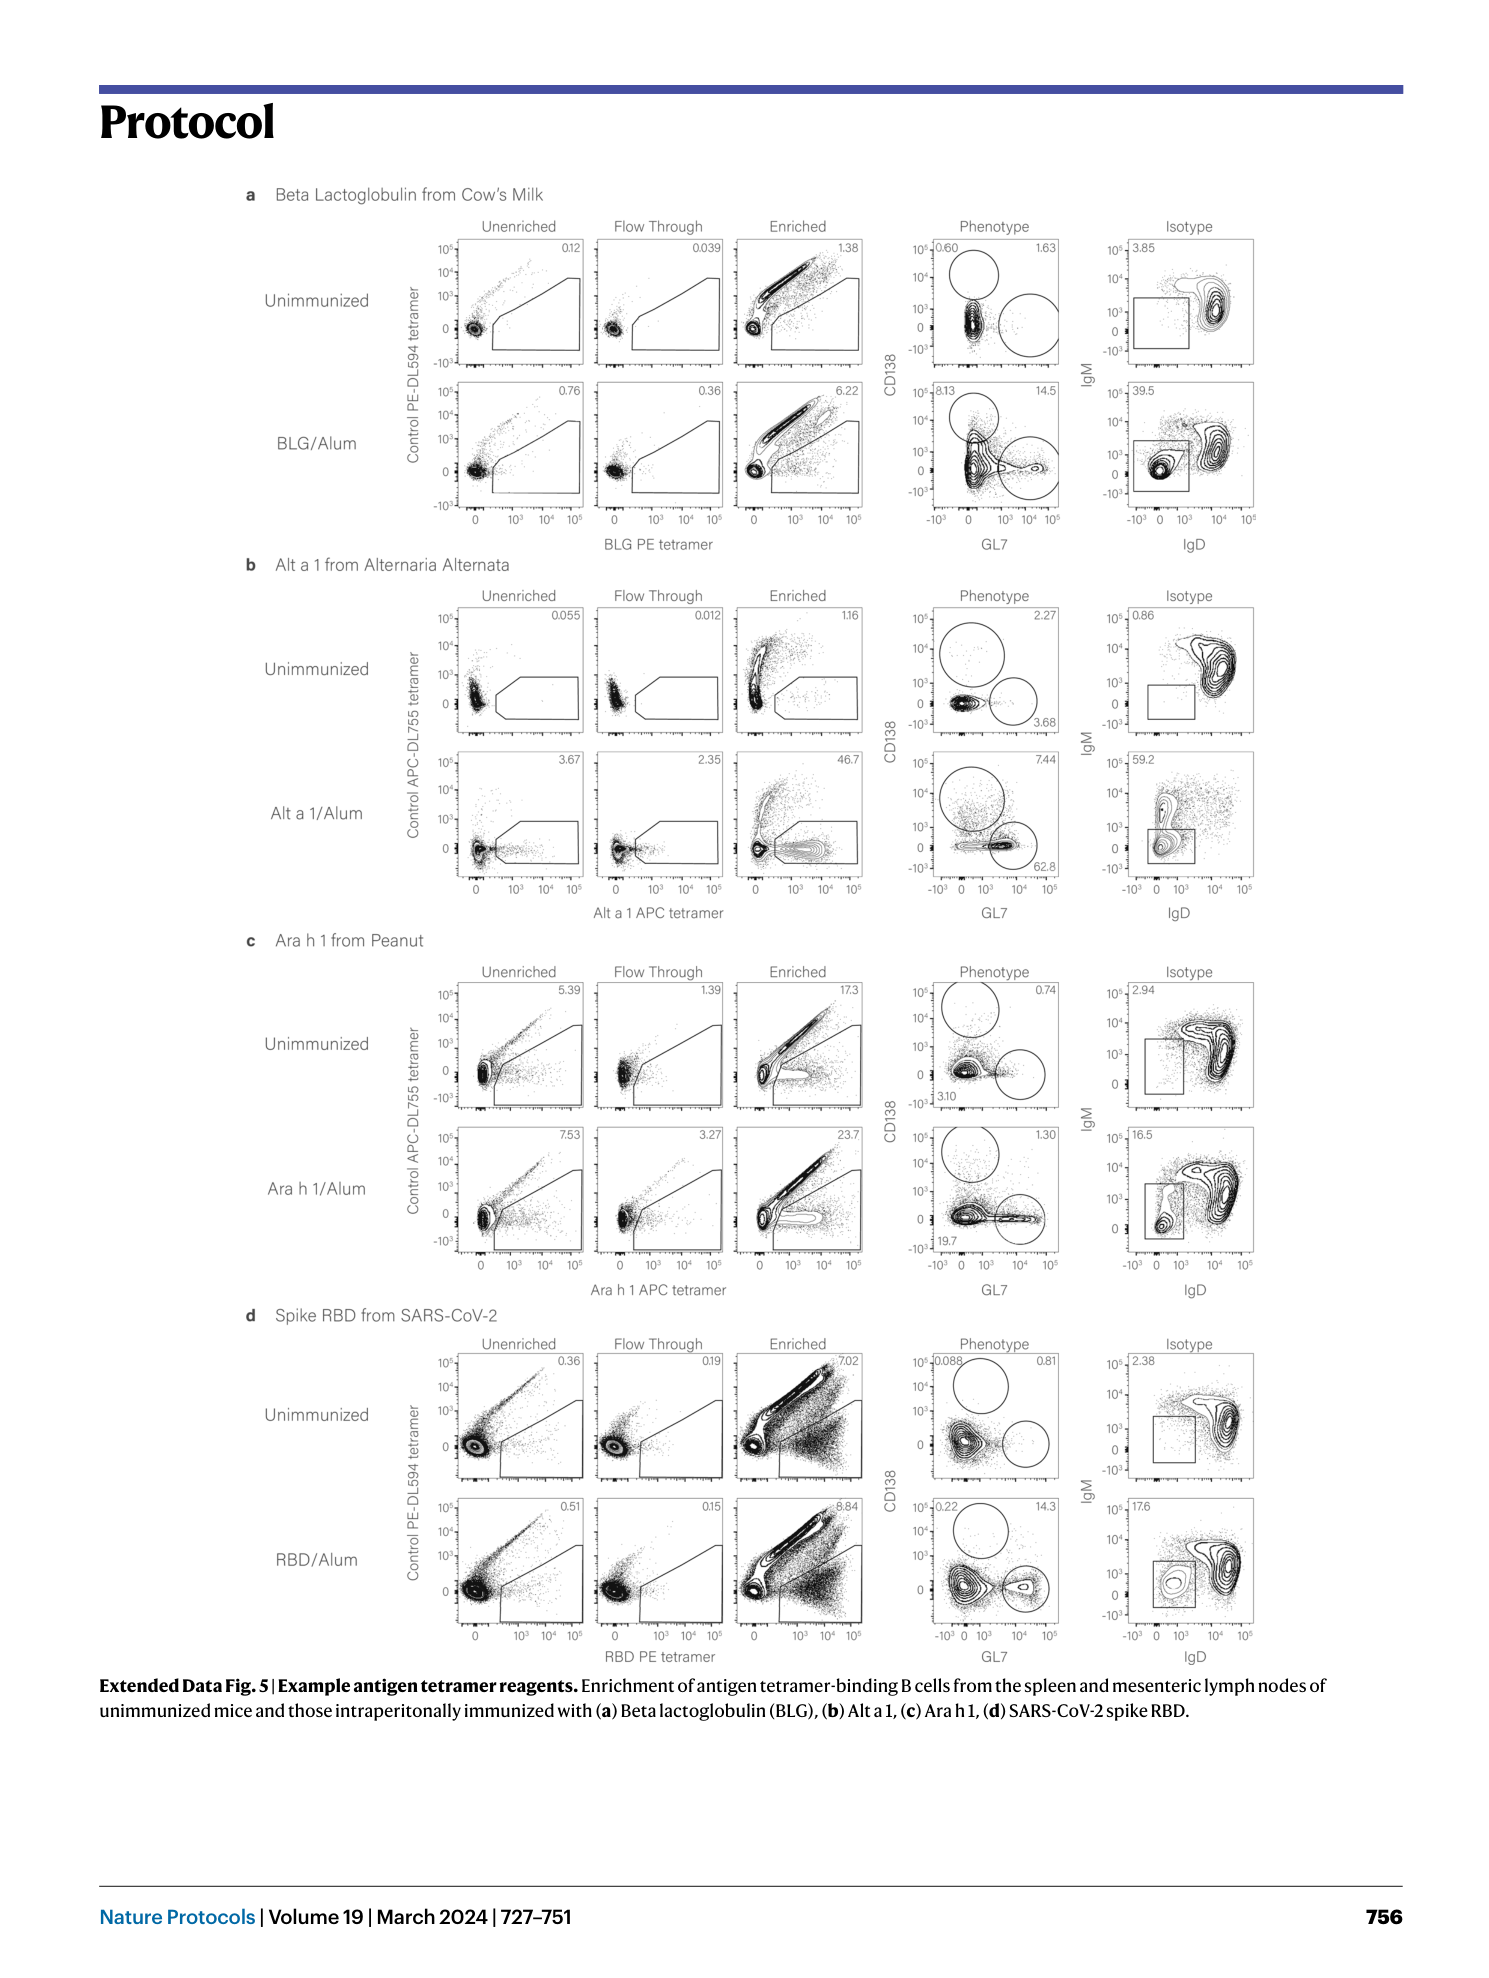
Extended Data Fig. 5 Example antigen tetramer reagents.
Enrichment of antigen tetramer-binding B cells from the spleen and mesenteric lymph nodes of unimmunized mice and those intraperitonally immunized with ( a ) Beta lactoglobulin (BLG), ( b ) Alt a 1, ( c ) Ara h 1, ( d ) SARS-CoV-2 spike RBD.
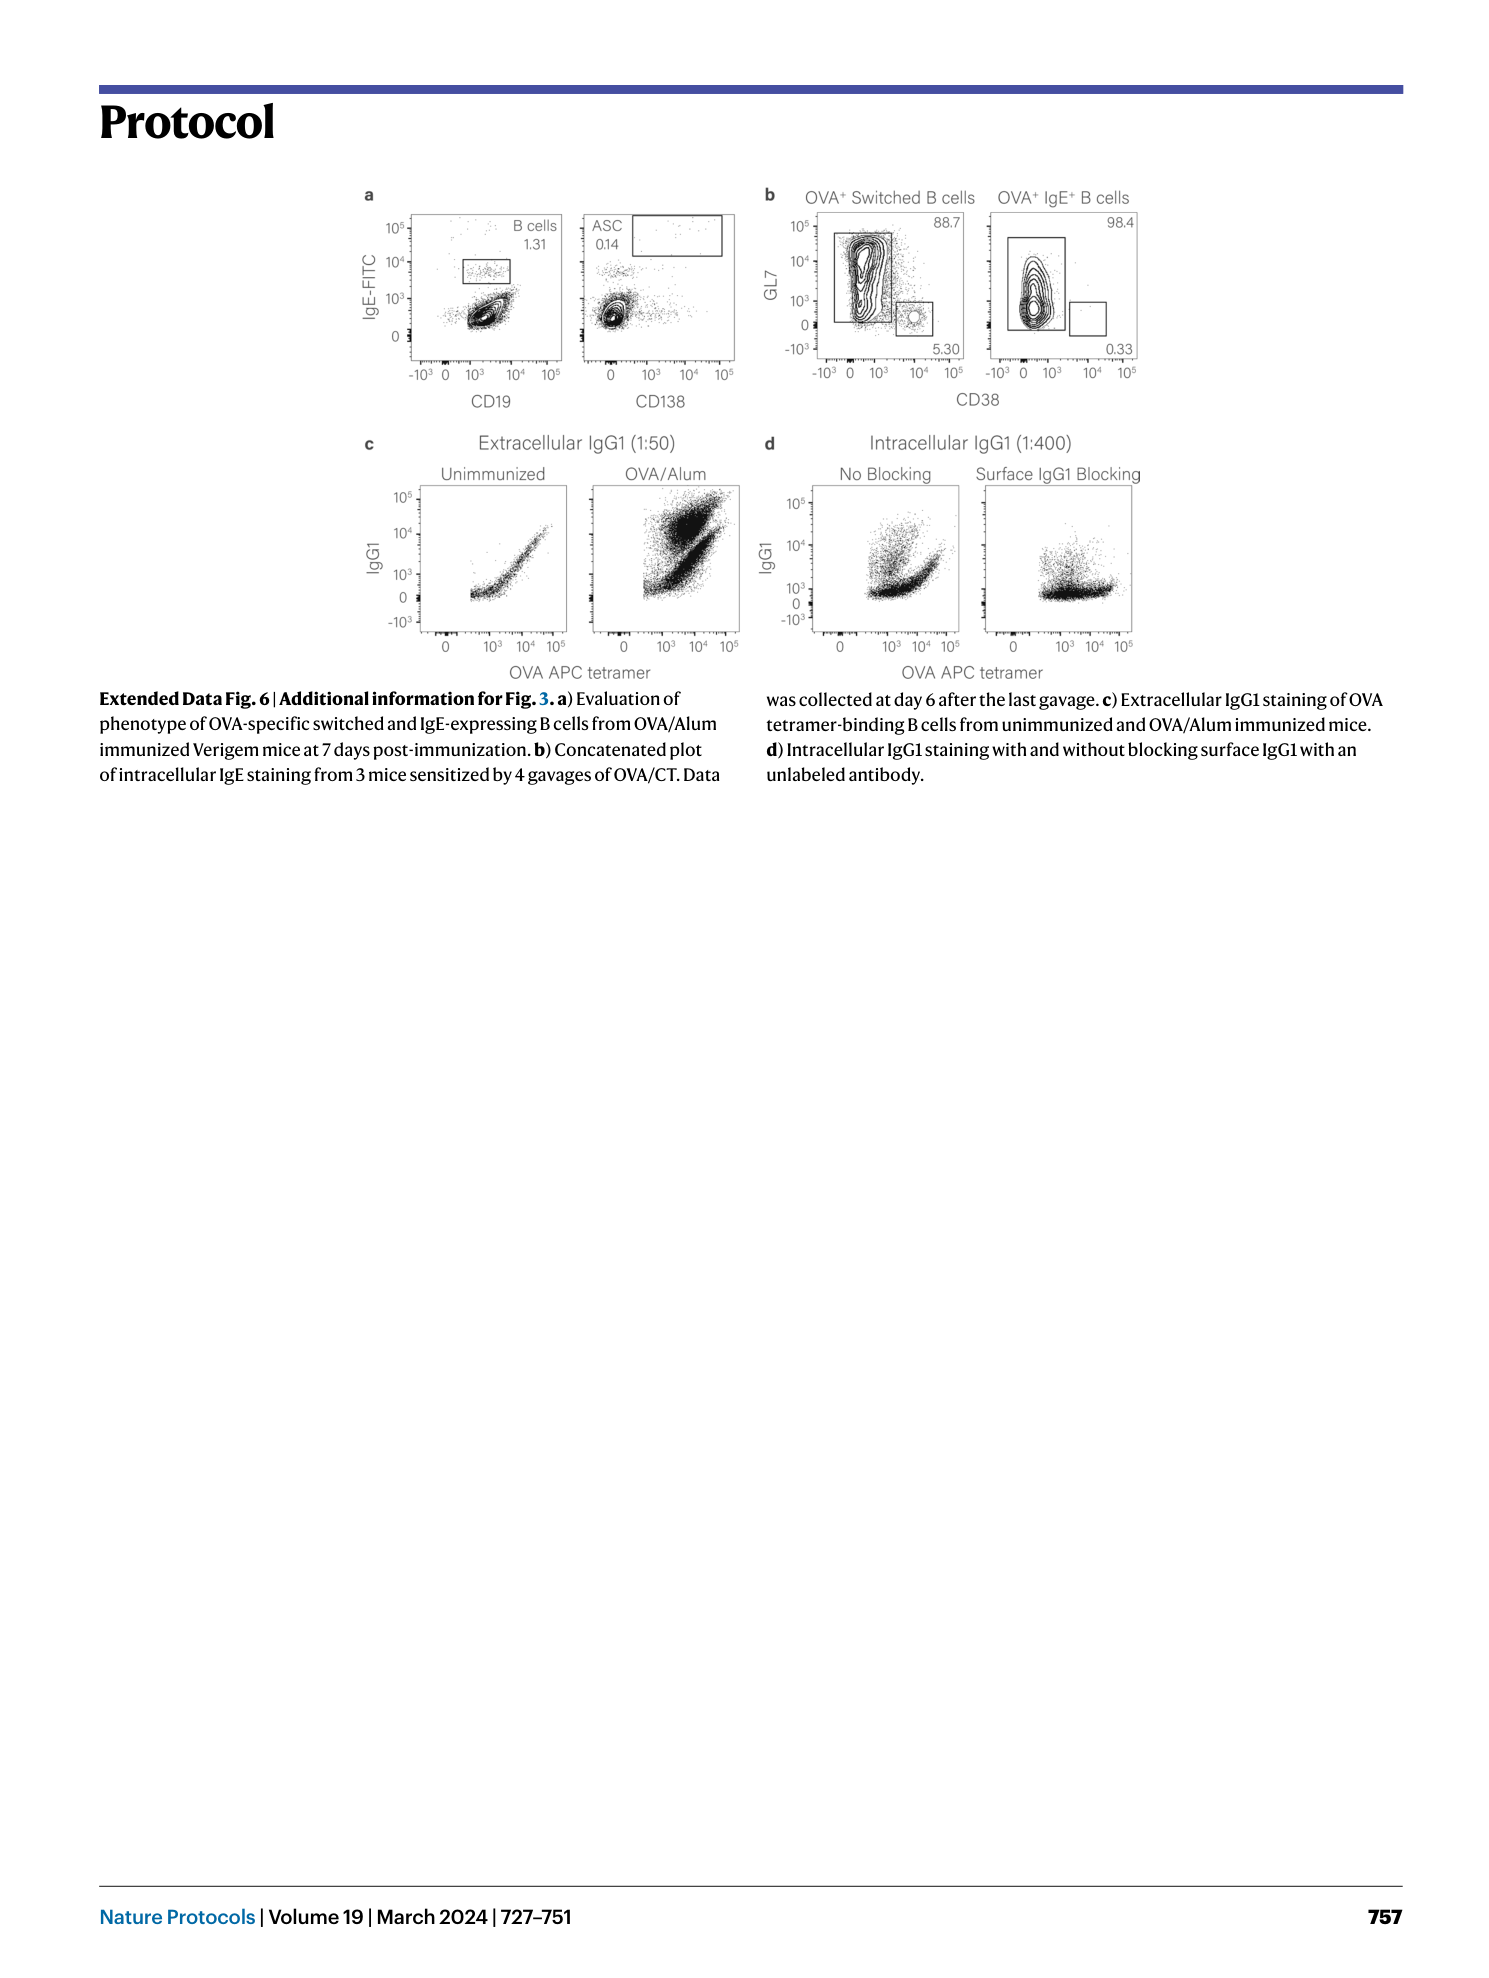
[ Extended Data Fig. 6 Additional information for Fig. 3 . ](https://www.nature.com/articles/s41596-023-00930-8/figures/11)
a ) Evaluation of phenotype of OVA-specific switched and IgE-expressing B cells from OVA/Alum immunized Verigem mice at 7 days post-immunization. b ) Concatenated plot of intracellular IgE staining from 3 mice sensitized by 4 gavages of OVA/CT. Data was collected at day 6 after the last gavage. c ) Extracellular IgG1 staining of OVA tetramer-binding B cells from unimmunized and OVA/Alum immunized mice. d ) Intracellular IgG1 staining with and without blocking surface IgG1 with an unlabeled antibody.
Supplementary information
Supplementary Information
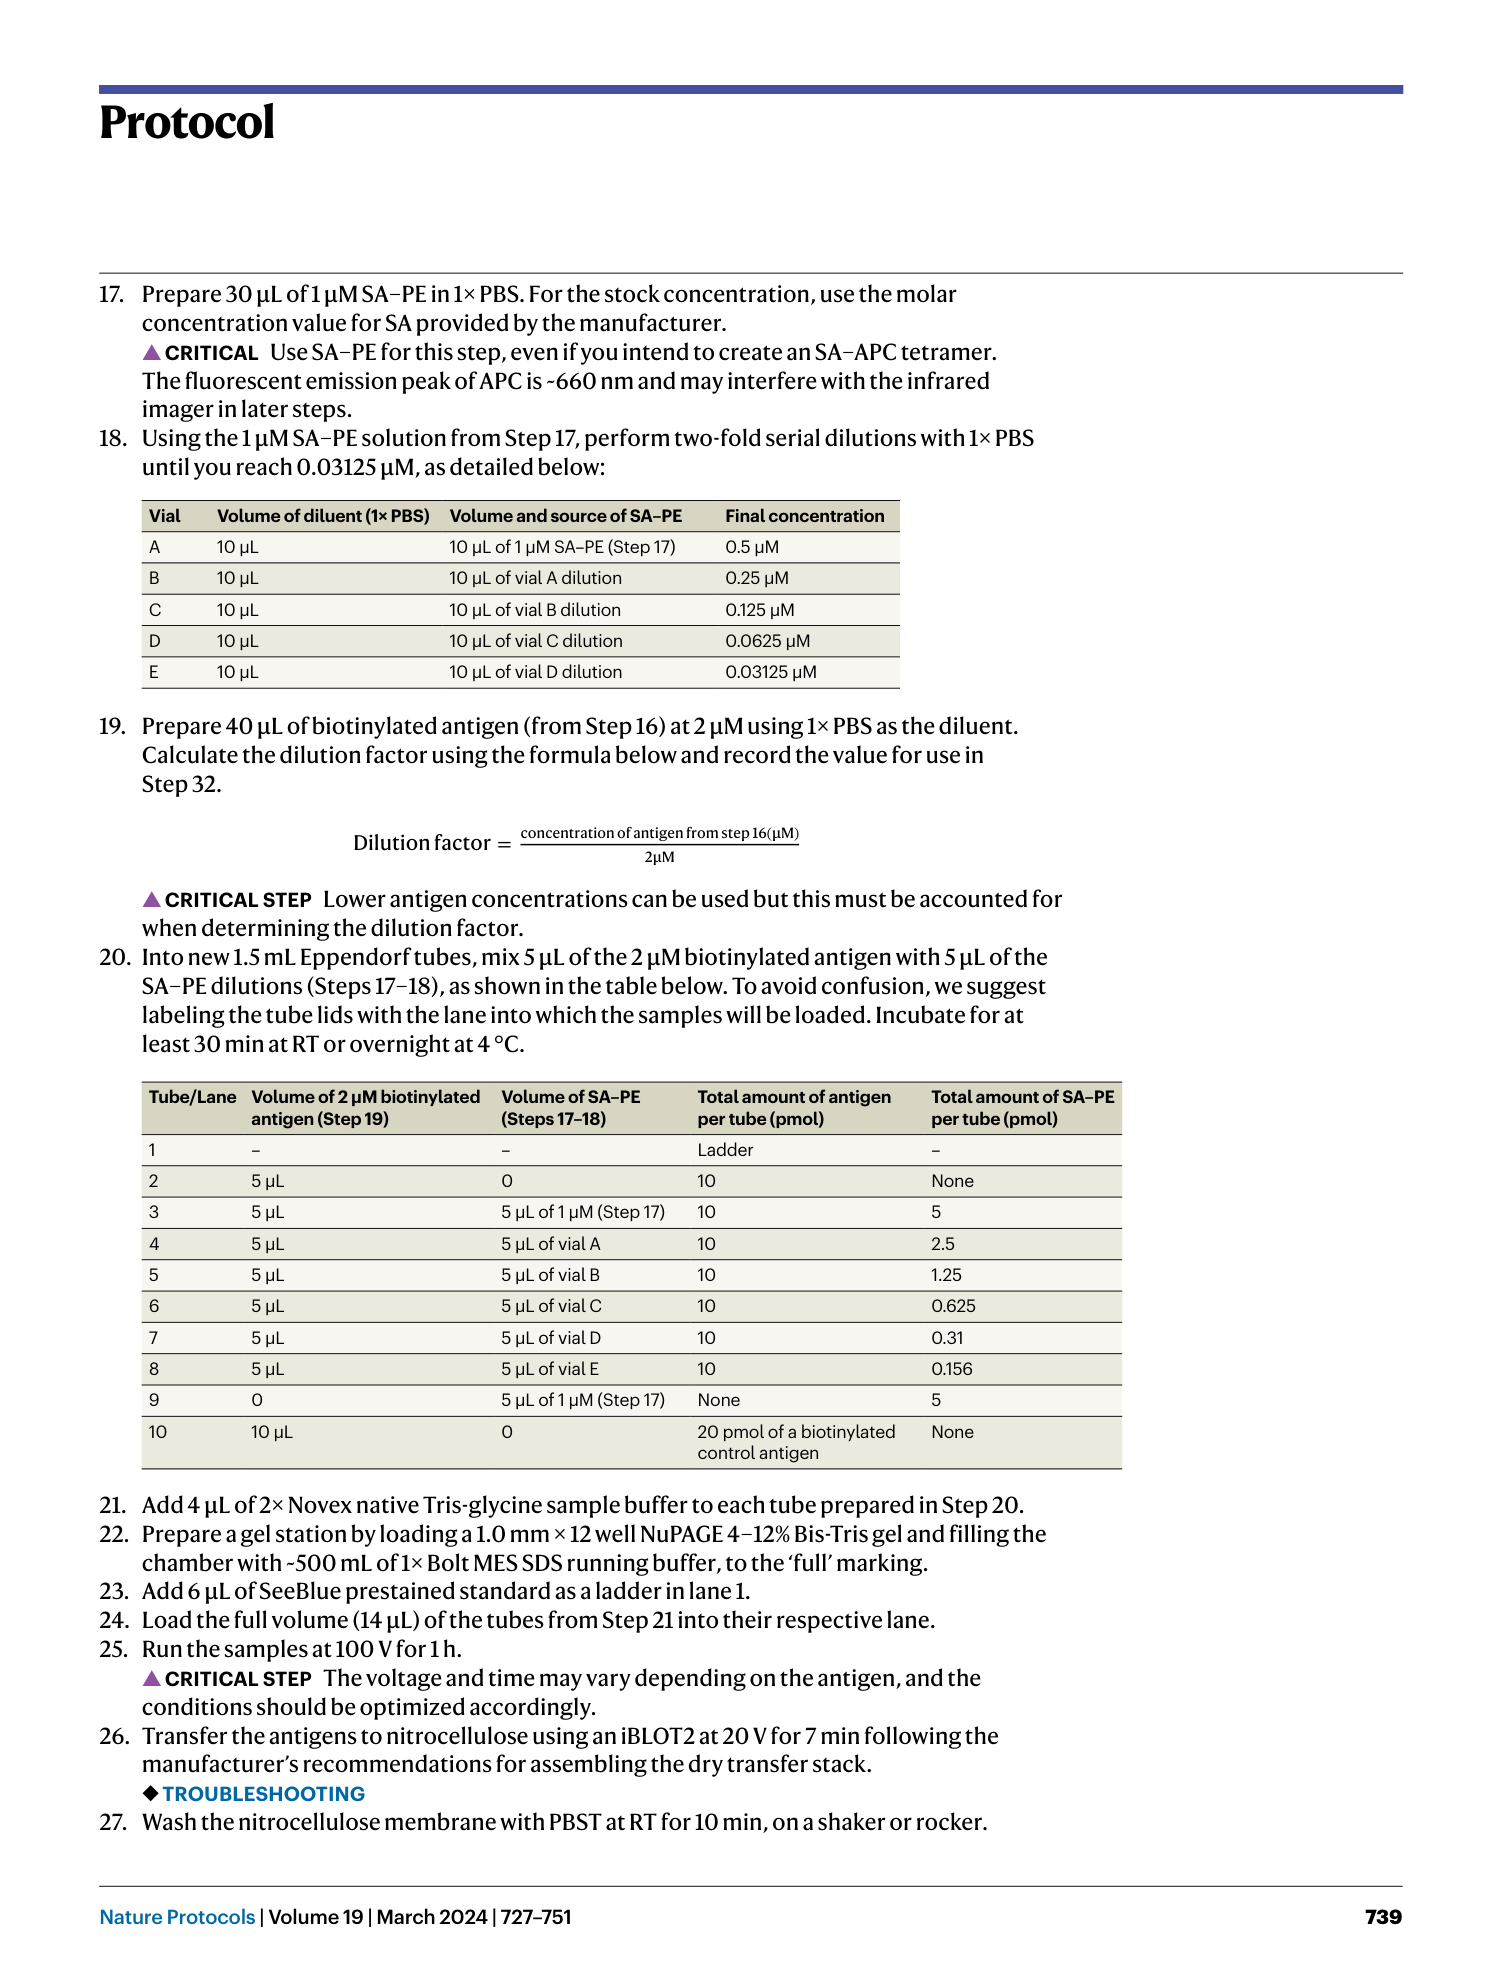
Supplementary Tables 1–3, Text and Methods.
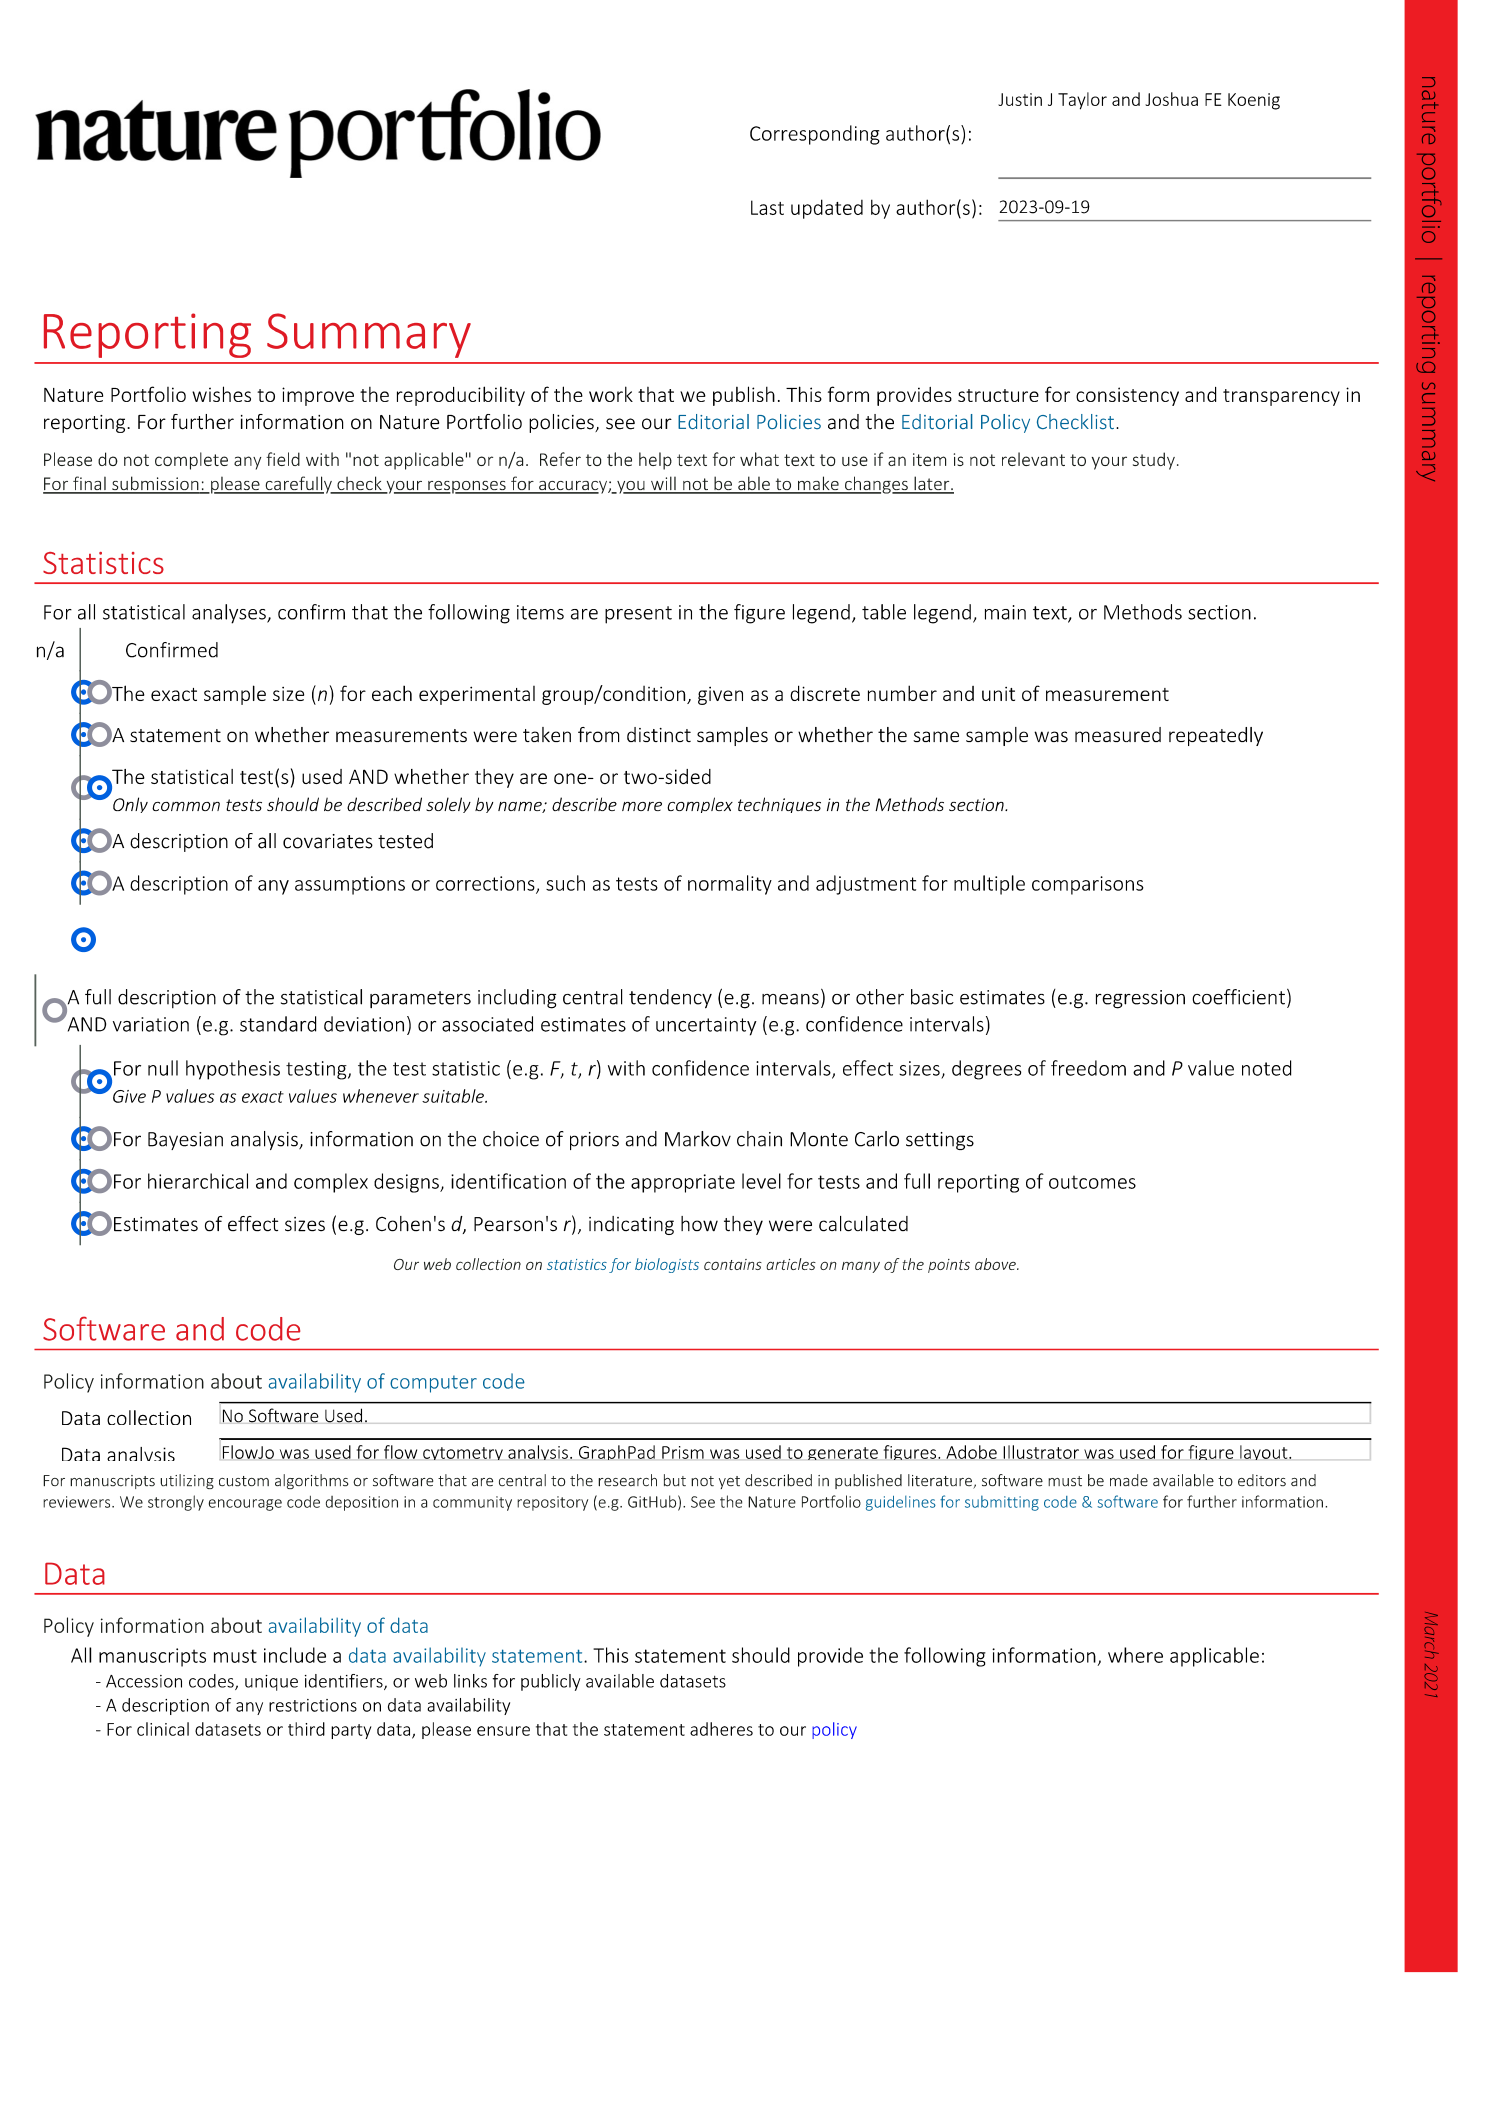
Reporting Summary
Supplementary Software
Programmed Excel worksheet that performs calculations for this protocol.
