IHC analysis of brain regions from PCB exposed rats
Hansjoachim Lehmler, Amanda Bullert, Morgan Linahon, Michael Dailey
Abstract
This protocol describes a method to analyze the effect of PCB52 inhalation on brain cells in adolescent rats. PCB52 (2,2’,5,5’-tetrachlorobiphenyl) was administered to adolescent rats via a nose-only apparatus with PCB52-laden air. The exposure was 4 hours a day for 28 consecutive days. Brains were collected, the cerebellum region was frozen, and tissue sections were cut and stained to label apoptotic cells using PSvue, microglia using anti-IBA1, and astrocytes using anti-GFAP. Using a Leica TCS SP8 confocal microscope, Z-Stack images were taken and analyzed for differences in cell density and apoptosis within the distinct cerebellar layers.
Before start
Note that this protocol involves work with experimental animals and requires prior approval by the users' Institutional Animal Care and Use Committee (IACUC) or equivalent ethics committee.
Steps
Extraction and preparation of cerebellum brain region
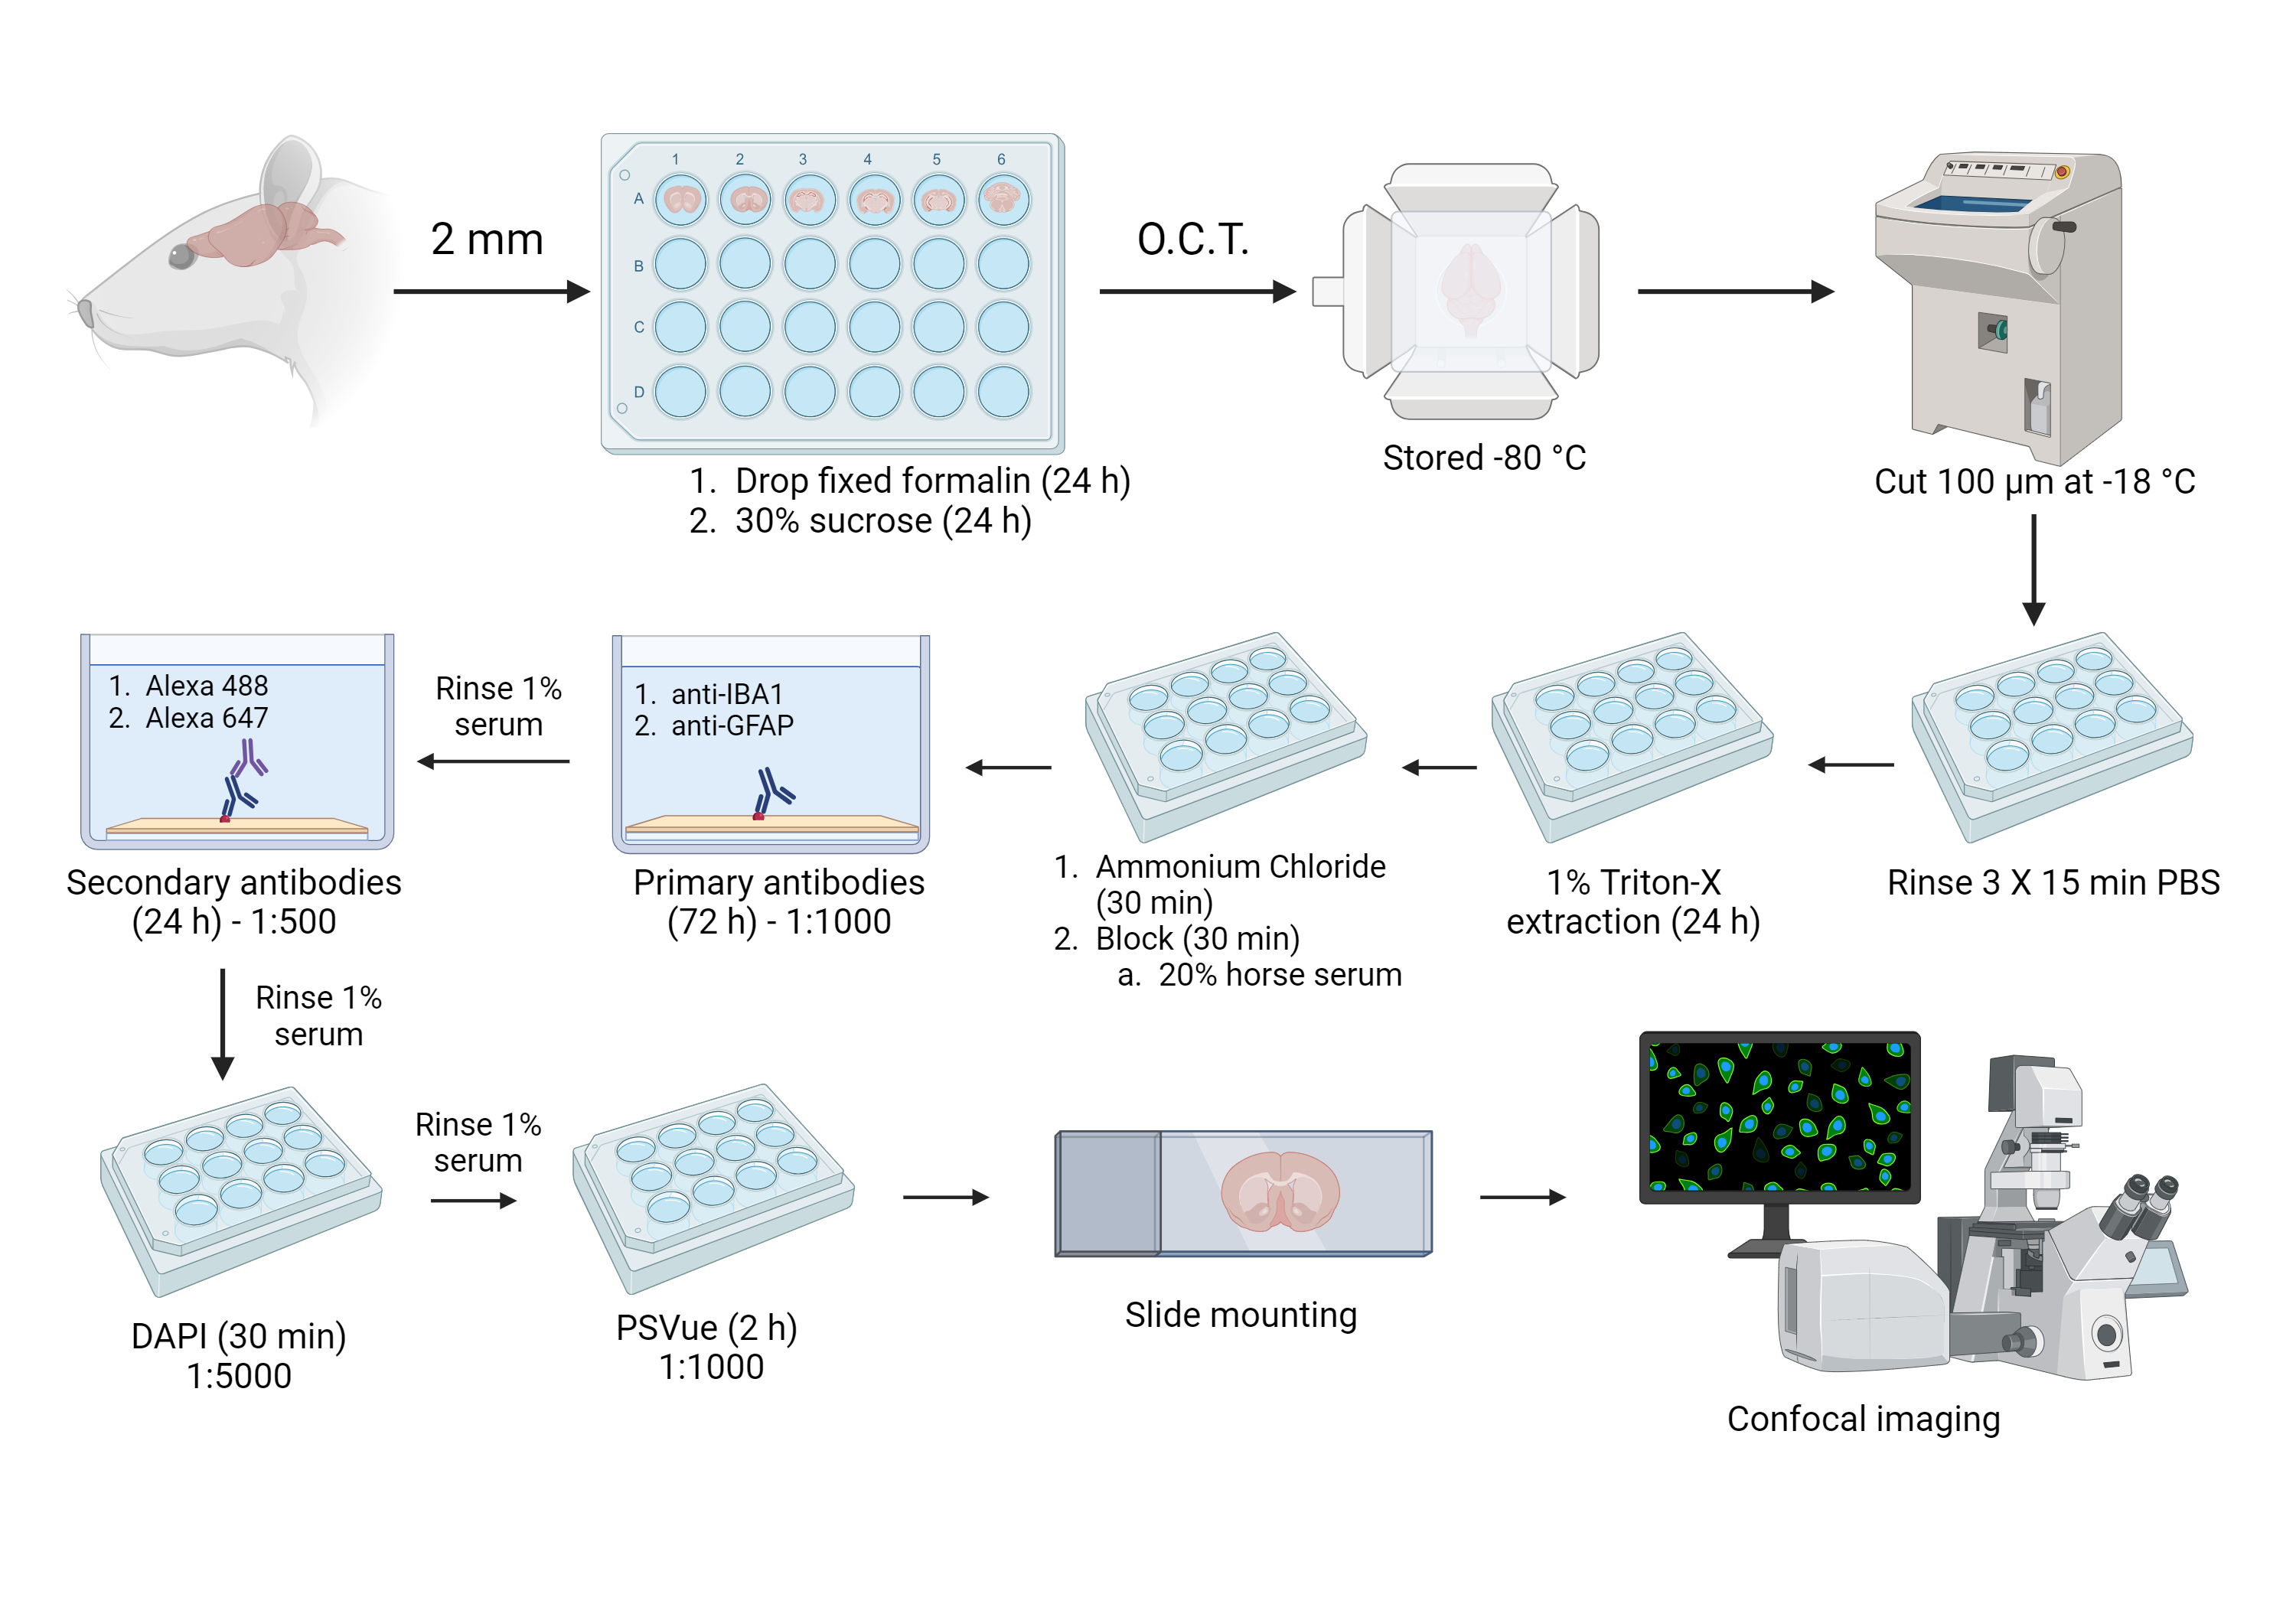
Using a rat brain matrix, the brain is cut into roughly 12 sections, each 2 mm thick
Drop fix the individual sections in 2 mL of 4% formalin per well for 24 hours at 4°C
Remove the formaldehyde and add 2 mL of 30% sucrose to each well for 24 hours at 4°C
Place a drop of O.C.T. compound in a disposable plastic cryomold (or any flat surface specimen block) and place the tissue flat on top of the O.C.T. compound
Fill the rest of the cryomold with O.C.T. compound so it completely covers the tissue
Place the mold on dry ice to freeze the O.C.T. compound
Store molds in a -80°C degree freezer
Cutting and staining
Set the temperature of the Leica CM3050 S Cryostat to -18°C and set to a thickness to 100 µm
Place O.C.T. tissue molds in the cryostat and wait at least 30 minutes for the blocks to acclimate to the new temperature
Preload 12-well plate with 1-2 mL of PBS solution (optional: prevent contamination by adding sodium azide)
Cut tissues using the cryostat and transfer slices to the 12-well plate, one slice per well (dispose of excess O.C.T. block as hazardous waste)
Wash with 2 mL of PBS solution 3 times for 15 min at room temp
(Washing includes switching the current solution for fresh PBS solution 3 times, waiting 15 mins in between, and being careful not to disturb the tissues in the wells. During each of the 15-minute intervals, place the well plate on a rotator at around 100 rpm)
In a new 12-well plate, add 0.5 mL of extraction solution to each labeled well
Transfer slices to the new 12-well plate containing extraction solution using a very fine paintbrush to pick up the tissue slices
Leave the tissue slices in the extraction solution for 1 hour on the rotator at around 100 rpm at room temp
Replace the extraction solution with 0.5 mL fresh extraction solution in each well
Incubate tissue slices overnight (approximately 16 hours) in a fridge at 4°C
Remove extraction solution by washing slices with 0.5 mL ammonium chloride solution for 30 min at room temp
Replace ammonium chloride solution with 0.5 mL of blocking solution for 30 min at room temp
Replace blocking solution with 0.5 mL antibody incubation solution (1% serum) for 5 min
Switch the 1% serum solution for ~300 μL of the primary antibody solution (enough to submerge the tissue; make fresh with each batch)
Primary antibody solution (1 mL total)
-
1 μL anti-IBA1 (1:1000)
-
1 μL anti-GFAP (1:1000)
-
9993 μL antibody incubation solution (1% serum)
Wrap the plate with parafilm
Incubate the 12-well plates with the tissue slices for 3 nights in a fridge at 4°C
Wash with antibody incubation solution (1% serum) 3 times for 15 min at room temp
(Washing includes switching the current solution for fresh antibody incubation solution 3 times, waiting 15 mins in between, and being careful not to disturb the tissues in the wells. During each of the 15-minute intervals, place the well plate on a rotator at around 100 rpm)
Switch the 1% serum solution for ~300 μL secondary antibody solution (enough to submerge tissue; make fresh with each batch)
Secondary antibody solution (1 mL total)
-
2 μL Alexa 488 (Goat anti Rabbit) (1:500)
-
2 μL Alexa 647 (Mouse anti Rat) (1:500)
-
9996 μL antibody incubation solution (1% serum)
Wrap the 12-well plate with parafilm, followed by aluminum foil to avoid exposure of the fluorescent probe to light
Incubate tissue slices overnight (approximately 16 hours) in a fridge at 4°C
Wash with 1% serum 3 times for 15 min at room temp
(Washing includes switching the current solution for fresh 1% serum solution 3 times, waiting 15 mins in between, and being careful not to disturb the tissues in the wells. During each of the 15-minute intervals, place the well plate on a rotator at around 100 rpm)
Switch the 1% serum solution for 300 μL of DAPI solution (make fresh with each batch)
DAPI solution (5 mL total)
-
1 μL DAPI (1:5000)
-
4999 μL antibody incubation solution (1% serum)
Incubate tissue slices on a rotator for 30 min at room temp
Wash with 1% serum 3 times for 15 min at room temp
(Washing includes switching the current solution for fresh 1% serum solution 3 times, waiting 15 mins in between, and being careful not to disturb the tissues in the wells. During each of the 15-minute intervals, place the well plate on a rotator at around 100 rpm)
Switch the 1% serum solution for 300 μL of PSVue solution (make fresh with each batch)
PSVue solution (1 mL total)
-
1 μL PSVue550(1:1000)
-
9999 μL antibody incubation solution (1% serum)
Incubate tissue slices for at least 2 hours in a fridge at 4°C
Mount on microscope slide with 1-2 drops of PBS with 0.02% sodium azide, flattening the tissue as much as possible before applying the coverslip
Secure the coverslip with 2 layers of clear nail polish
Imaging and analyzing
Place the microscope slide face down on the inverted Leica TCS SP8 Confocal Microscope
Using the bright field setting, manually focus the microscope
Adjust the settings, which include: 20x scanning objective, line averaging set to 16 (or as needed), and 1024 x 1024 scan format
Once focused, take a full overview image to find the area of interest
Create a sequential setting that includes channels corresponding to the stains used
Pan through each channel and adjust the lasers and detectors so the cells are not fluorescently oversaturated but just bright enough for analysis
Once the Z stacks are saved, open them in ImageJ
Looking at each channel individually, analyze cell density and % area counts for each stain. The following criteria are to be followed for each stain:
-IBA1: particle size of 15 μm2-infinity, threshold set from 50-60 to 255
-GFAP: particle size of 10 μm2-infinity, threshold set from 50 to 255
-DAPI: particle size of 5 μm2-infinity, threshold set from 50 to 255
-PSVue: particle size of 2 μm2-infinity, threshold set from 100 to 255
(If desired, these parameters can be analyzed for both the molecular and granular layers within the cerebellum)
Record the measurements and transfer data to an Excel spreadsheet for analysis and data visualization
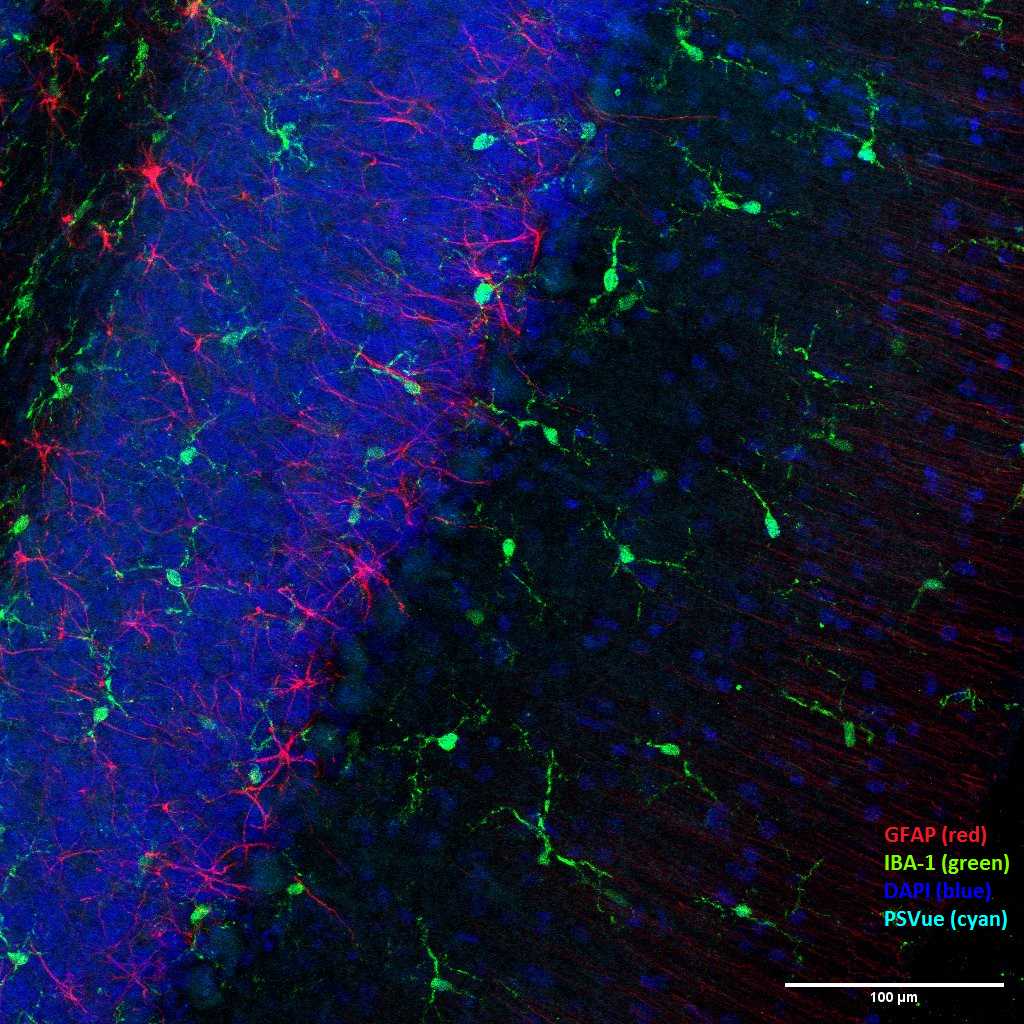
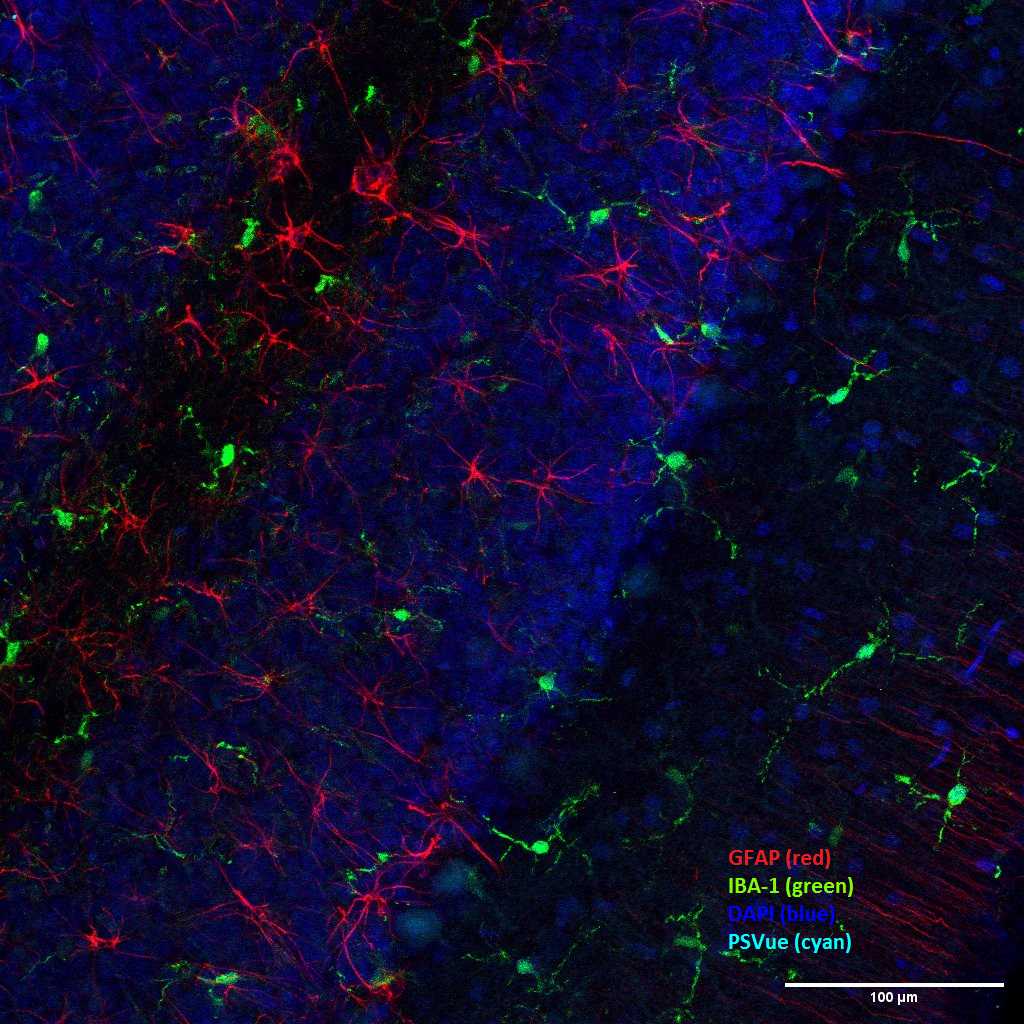
Channels can be combined to create an overlapping image showing all cell types. Brightness and contrast may need to be adjusted to properly see all of the stains. Representative images are shown below:


