Ex vivo immunocapture and functional characterization of cell-type-specific mitochondria using MitoTag mice
Natalia Prudente de Mello, Caroline Fecher, Adrian Marti Pastor, Fabiana Perocchi, Thomas Misgeld
functional characterization
MitoTag mice
ex vivo immunocapture
cell-type-specific mitochondria
tissue heterogeneity


Extended
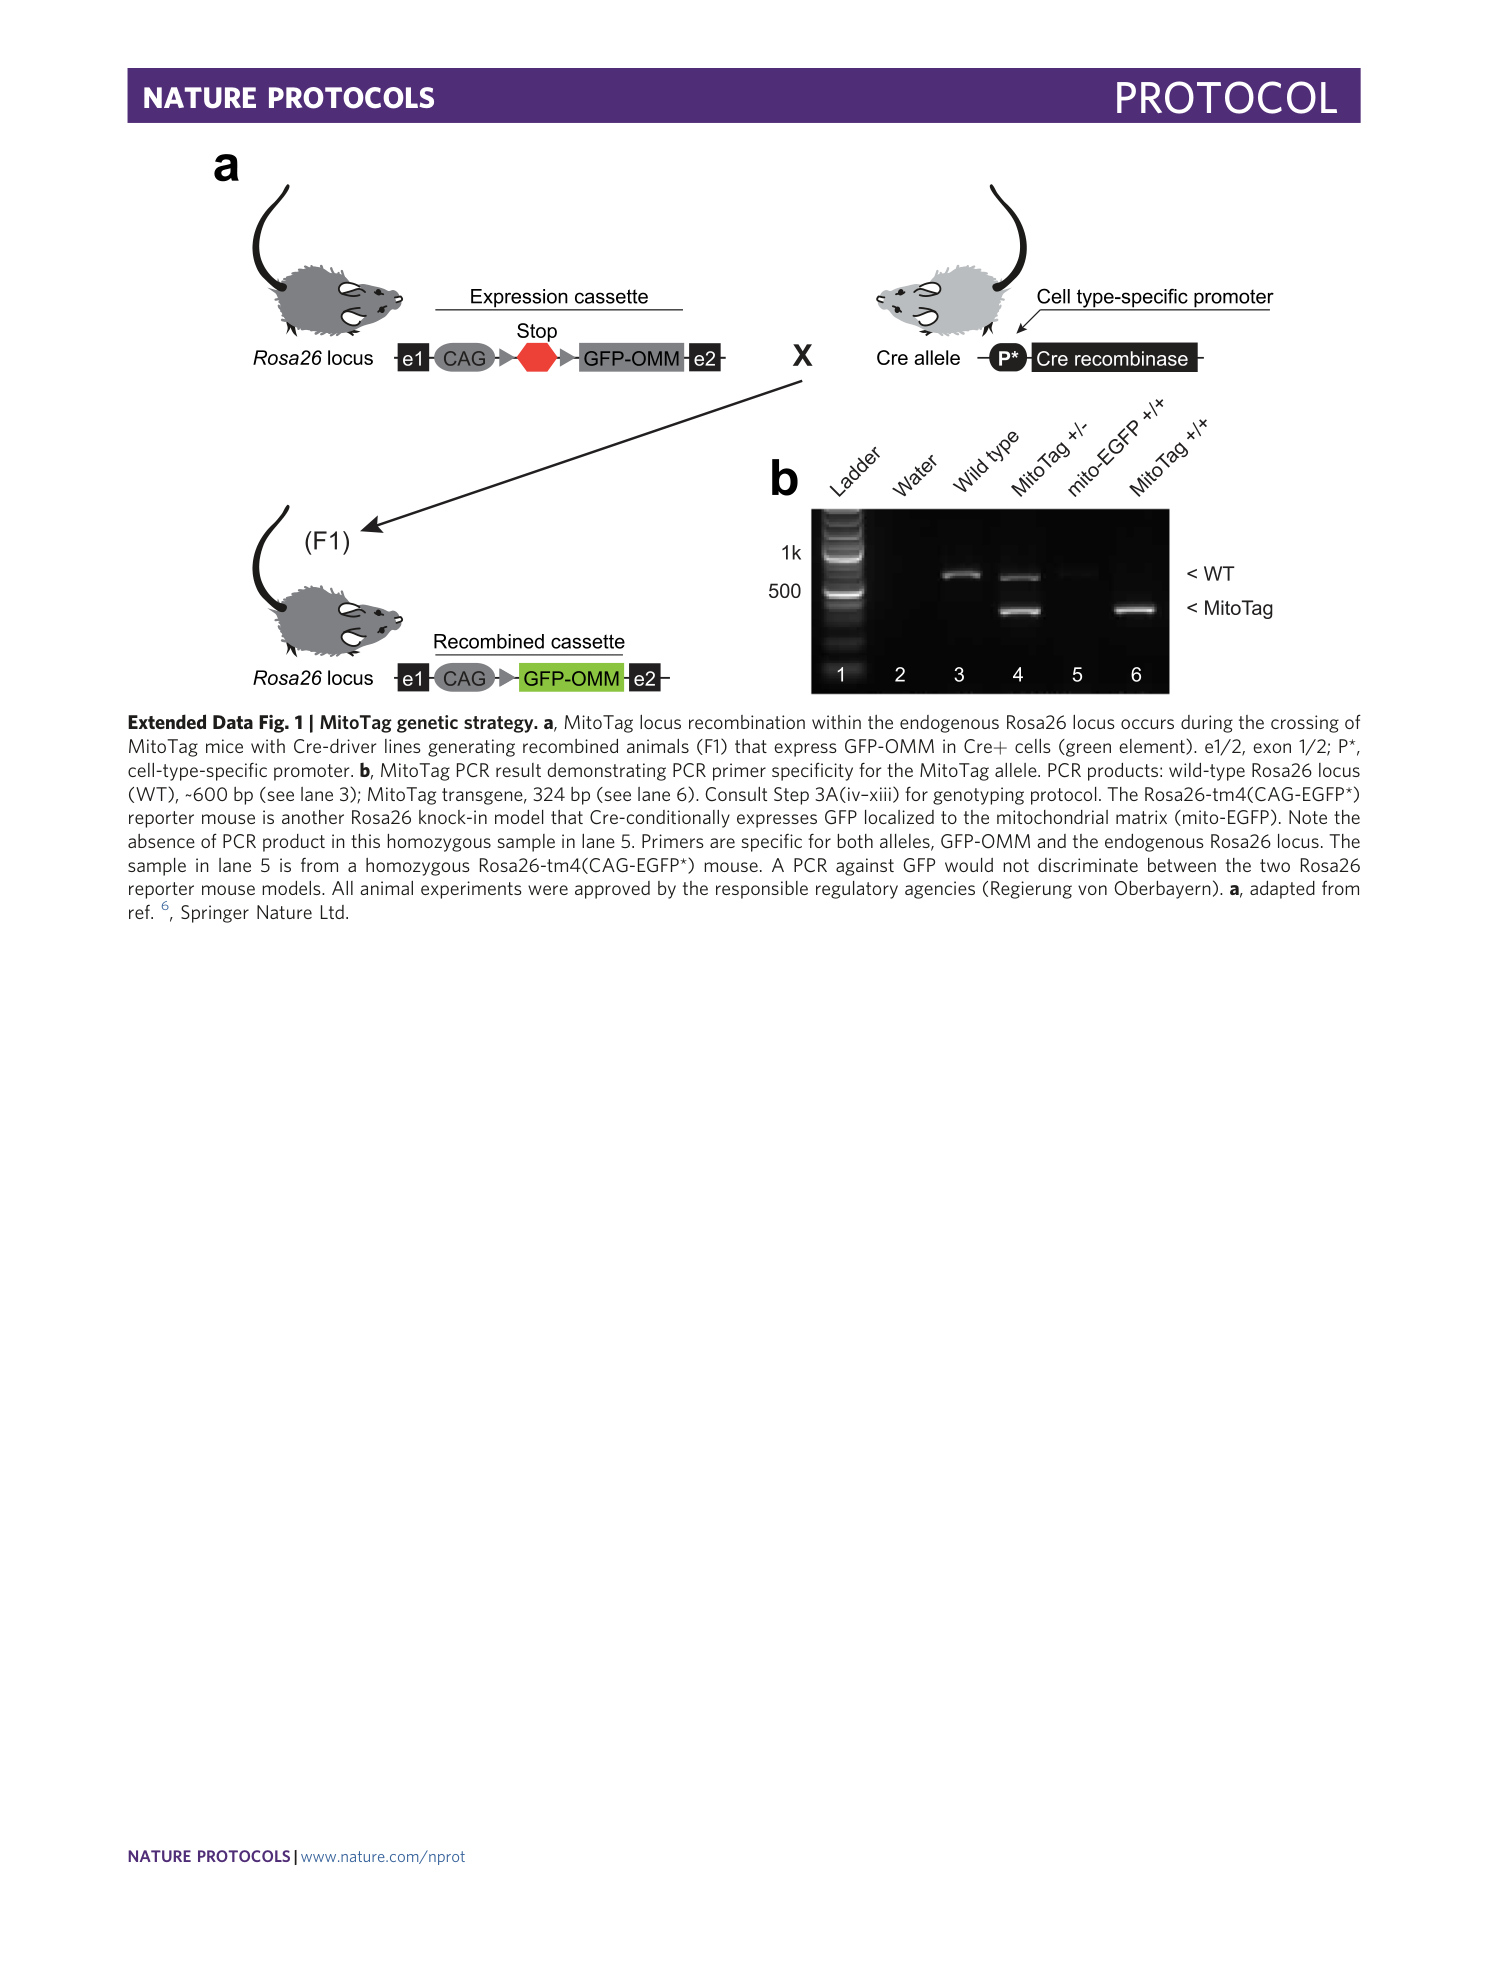
Extended Data Fig. 1 MitoTag genetic strategy.
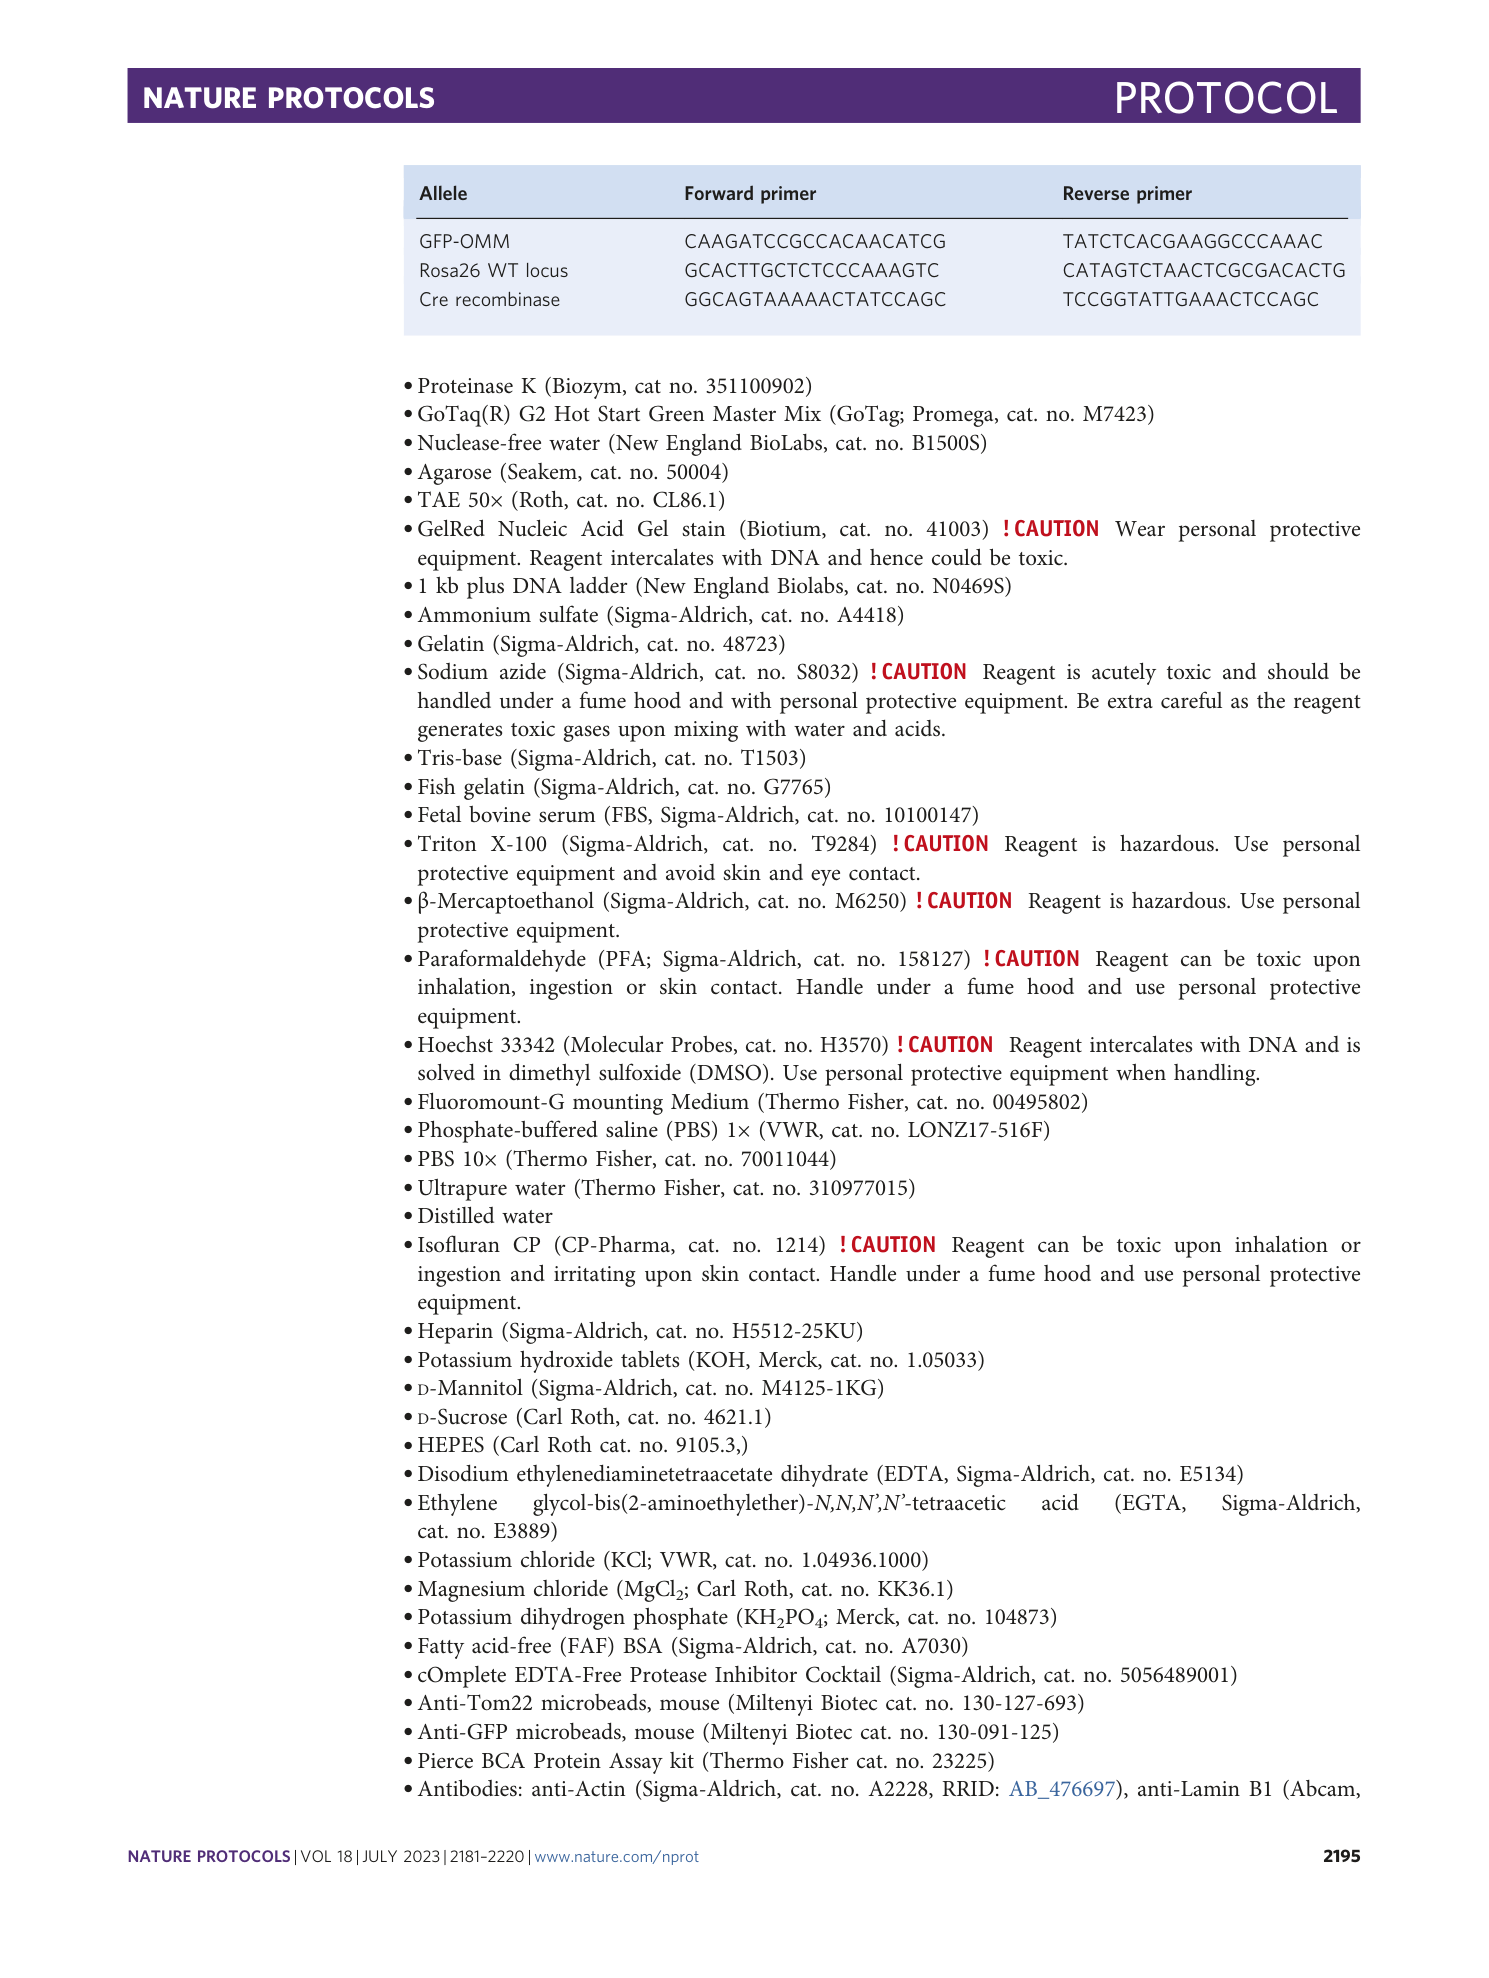
a , MitoTag locus recombination within the endogenous Rosa26 locus occurs during the crossing of MitoTag mice with Cre-driver lines generating recombined animals (F1) that express GFP-OMM in Cre+ cells (green element). e1/2, exon 1/2; P*, cell-type-specific promoter. b , MitoTag PCR result demonstrating PCR primer specificity for the MitoTag allele. PCR products: wild-type Rosa26 locus (WT), ~600 bp (see lane 3); MitoTag transgene, 324 bp (see lane 6). Consult Step 3A(iv–xiii) for genotyping protocol. The Rosa26-tm4(CAG-EGFP*) reporter mouse is another Rosa26 knock-in model that Cre-conditionally expresses GFP localized to the mitochondrial matrix (mito-EGFP). Note the absence of PCR product in this homozygous sample in lane 5. Primers are specific for both alleles, GFP-OMM and the endogenous Rosa26 locus. The sample in lane 5 is from a homozygous Rosa26-tm4(CAG-EGFP*) mouse. A PCR against GFP would not discriminate between the two Rosa26 reporter mouse models. All animal experiments were approved by the responsible regulatory agencies (Regierung von Oberbayern). a , adapted from ref. 6 , Springer Nature Ltd.
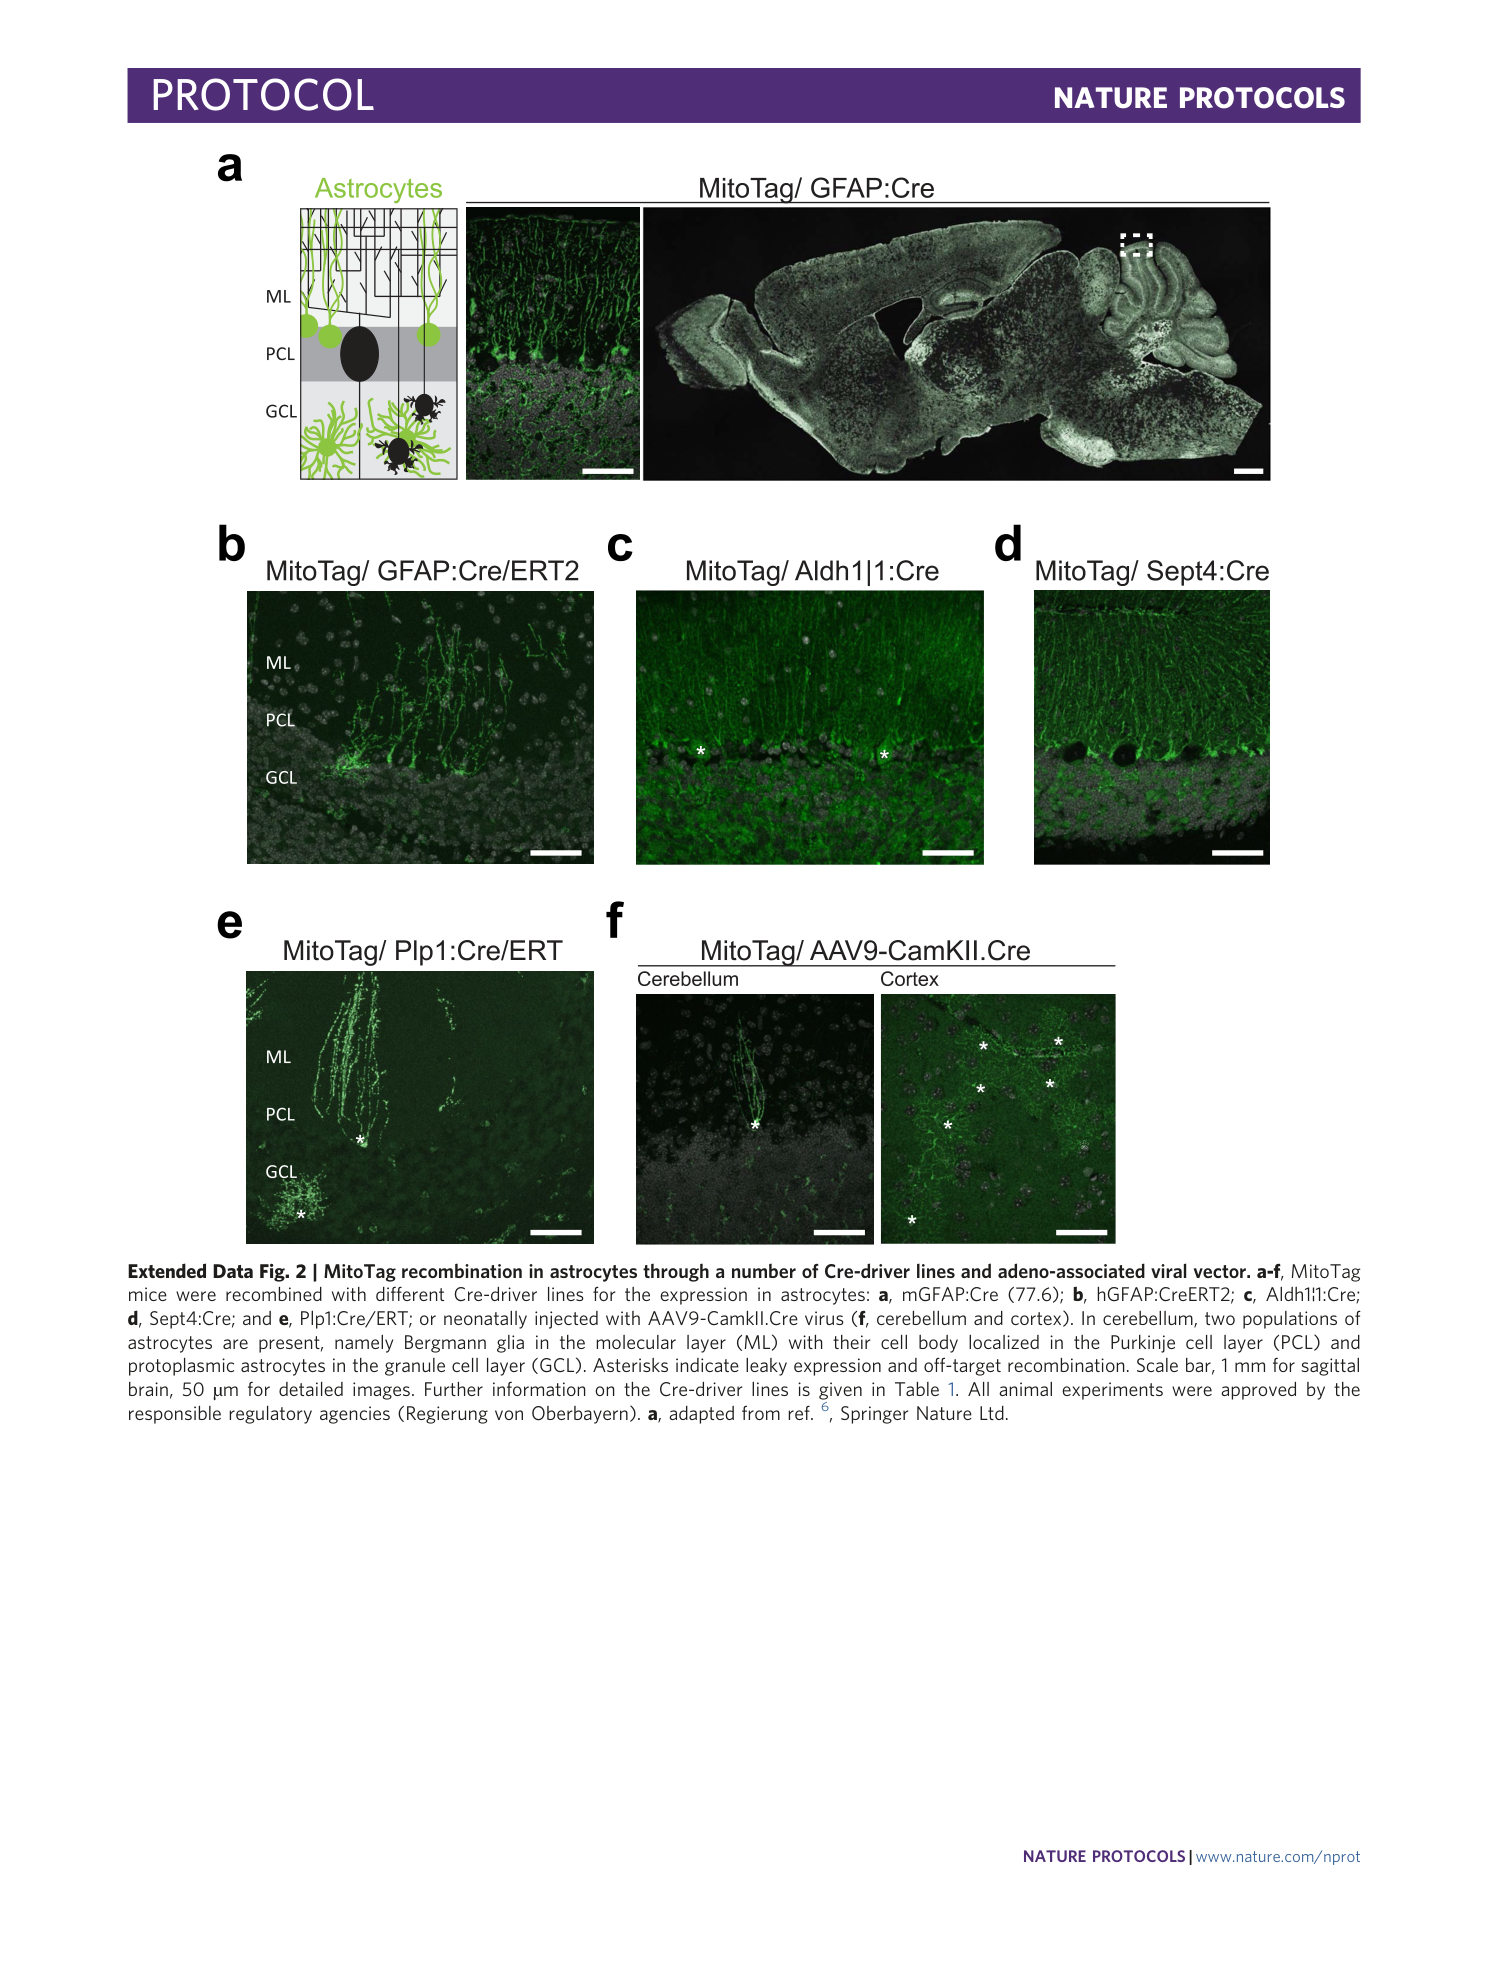
Extended Data Fig. 2 MitoTag recombination in astrocytes through a number of Cre-driver lines and adeno-associated viral vector.
a-f , MitoTag mice were recombined with different Cre-driver lines for the expression in astrocytes: a , mGFAP:Cre (77.6); b , hGFAP:CreERT2; c , Aldh1¦1:Cre; d , Sept4:Cre; and e , Plp1:Cre/ERT; or neonatally injected with AAV9-CamkII.Cre virus ( f , cerebellum and cortex). In cerebellum, two populations of astrocytes are present, namely Bergmann glia in the molecular layer (ML) with their cell body localized in the Purkinje cell layer (PCL) and protoplasmic astrocytes in the granule cell layer (GCL). Asterisks indicate leaky expression and off-target recombination. Scale bar, 1 mm for sagittal brain, 50 µm for detailed images. Further information on the Cre-driver lines is given in Table 1 . All animal experiments were approved by the responsible regulatory agencies (Regierung von Oberbayern). a , adapted from ref. 6 , Springer Nature Ltd.
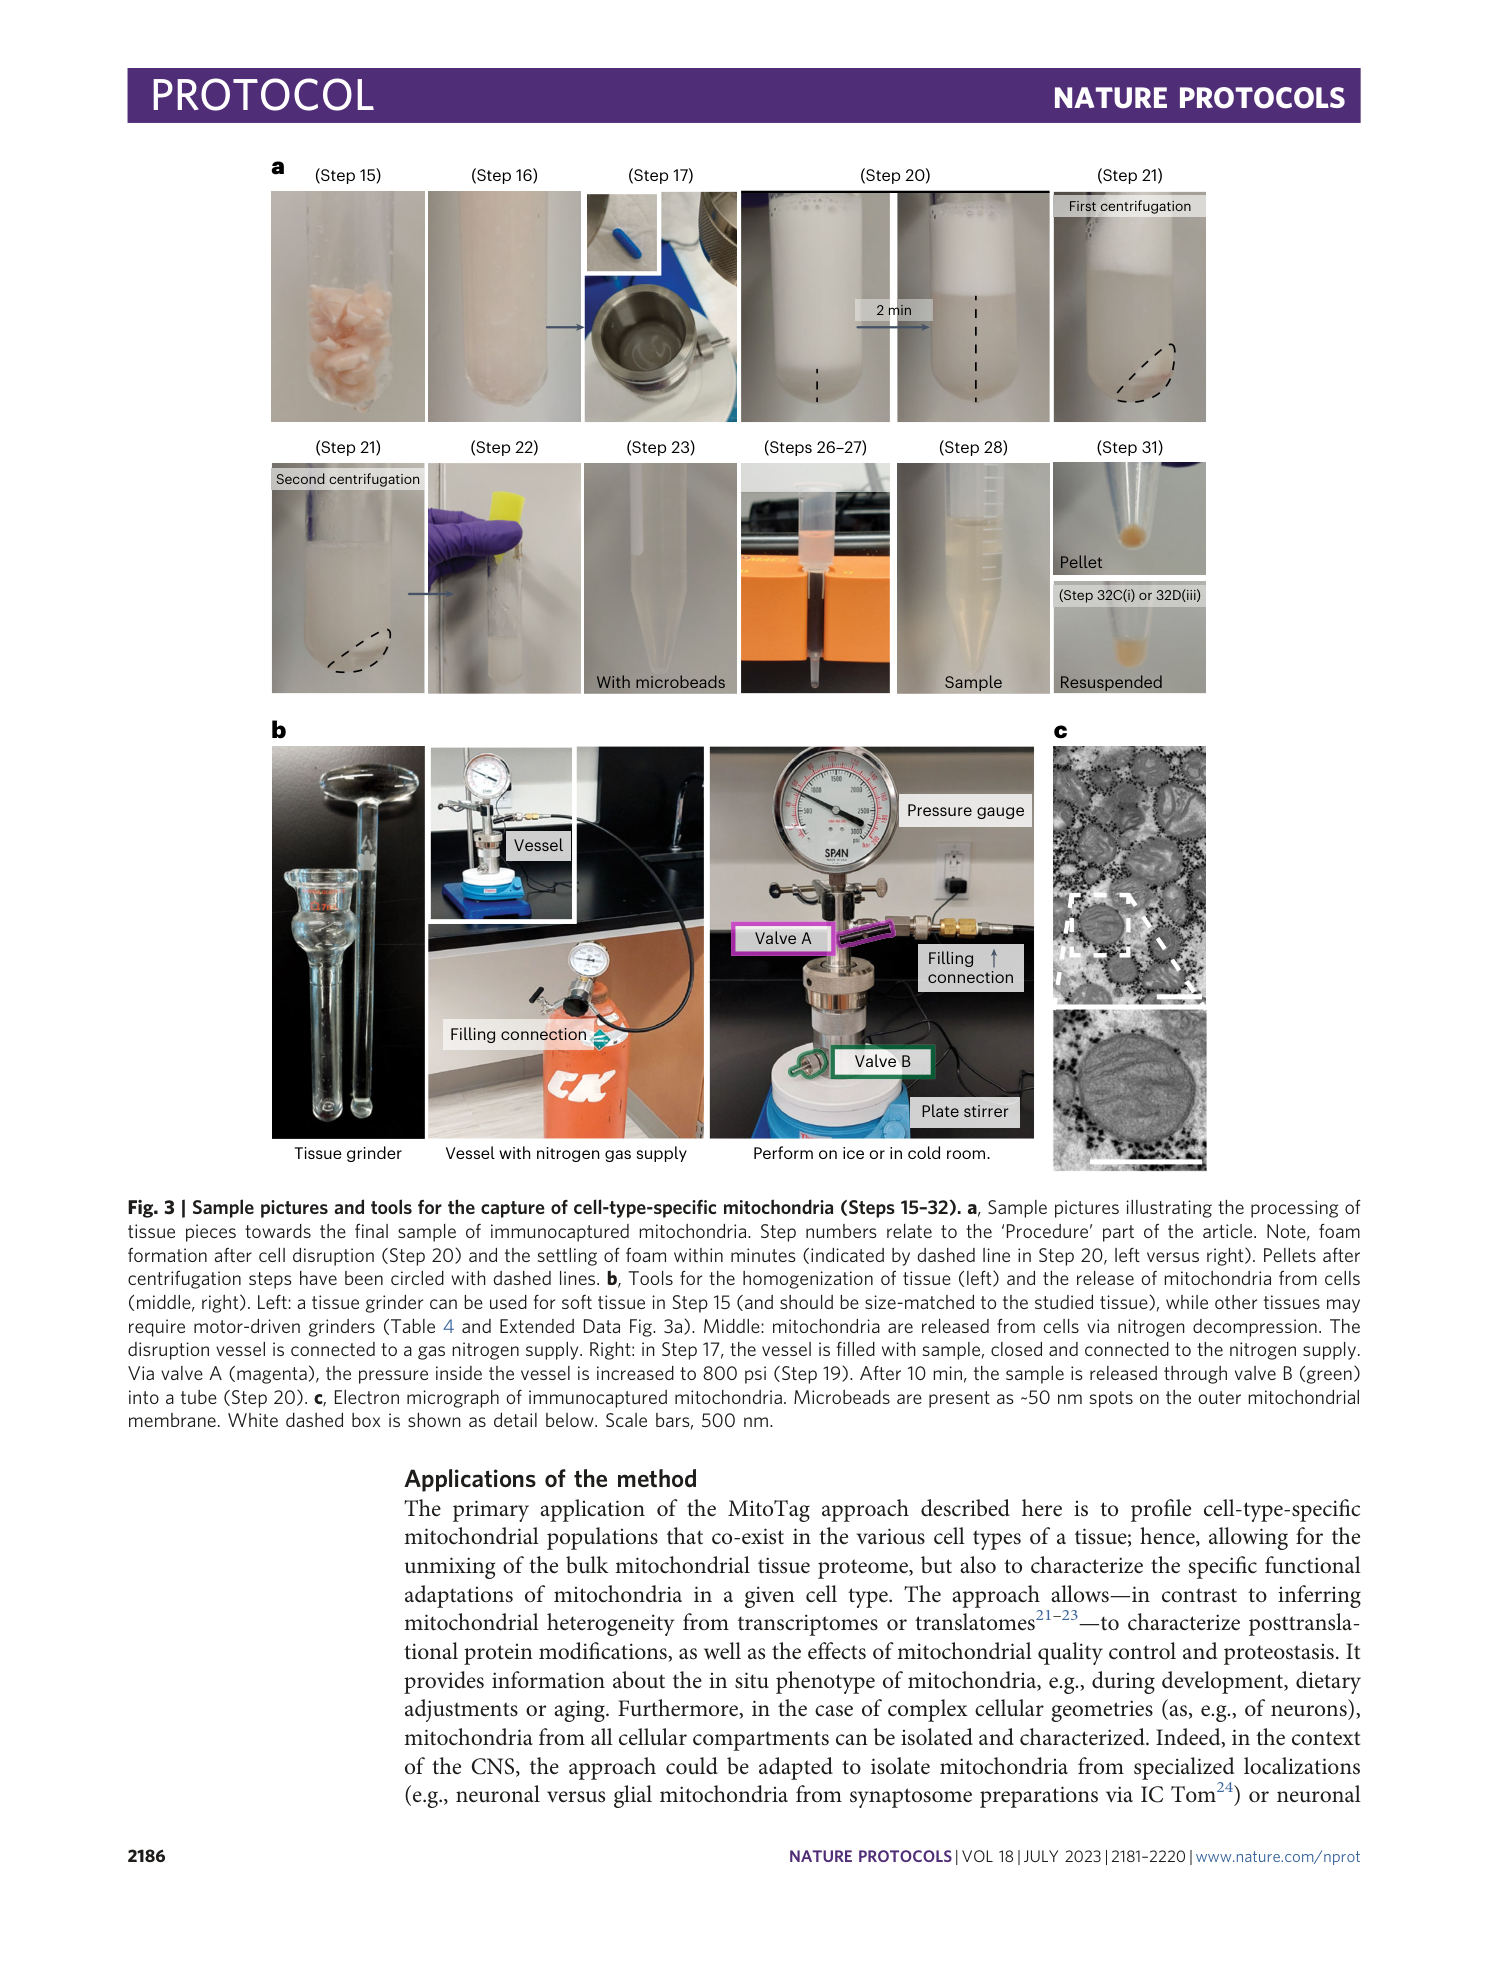
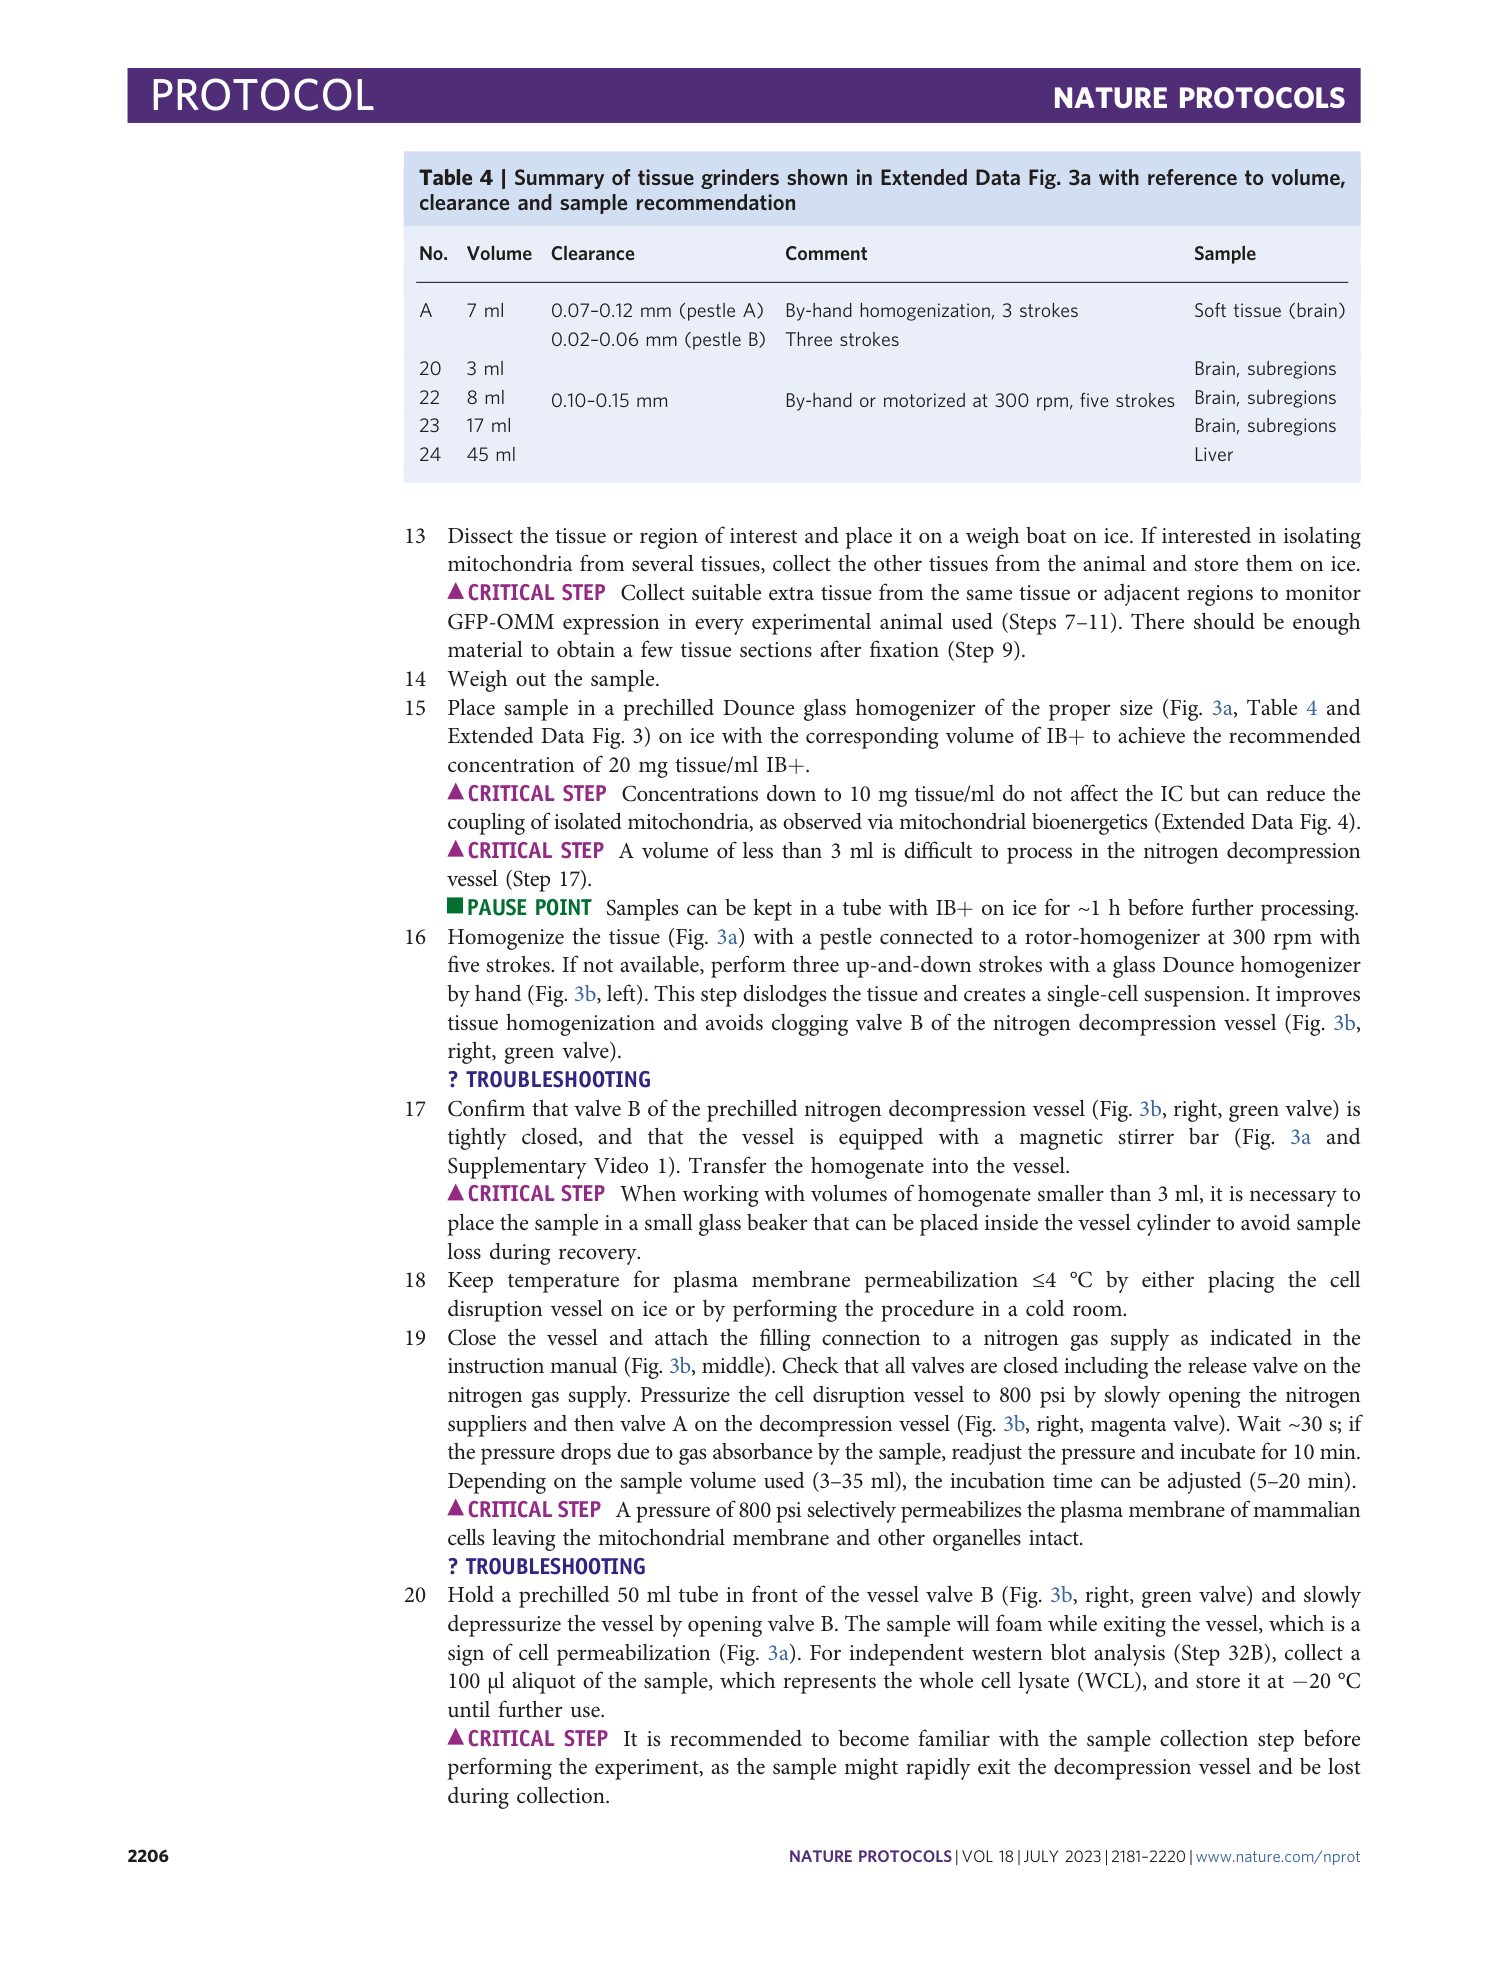
Extended Data Fig. 3 Essential equipment for the tissue homogenization Step 16.
a , Dounce glass tissue homogenizers of different sizes (volume and clearance, see Table 4 ). #A can be used for soft tissue and homogenization by hand, while #20, 22-24 are used in combination with a motorized rotor (300 rpm for the present protocol) and for different tissue sources (brain, liver, muscle tissue). b , Sample pictures illustrating the final immunocapture in Step 29 and 31. Note, final samples can vary in size and color between IC Tom and IC GFP dependent on the abundance of GFP-OMM tagged mitochondria in tissue lysate and the amount of microbeads used. Microbeads are present as dark central spot within the sample pellet and we have not observed adverse effects due to their presence in functional downstream assays. All animal experiments were approved by the responsible regulatory agencies (Regierung von Oberbayern).
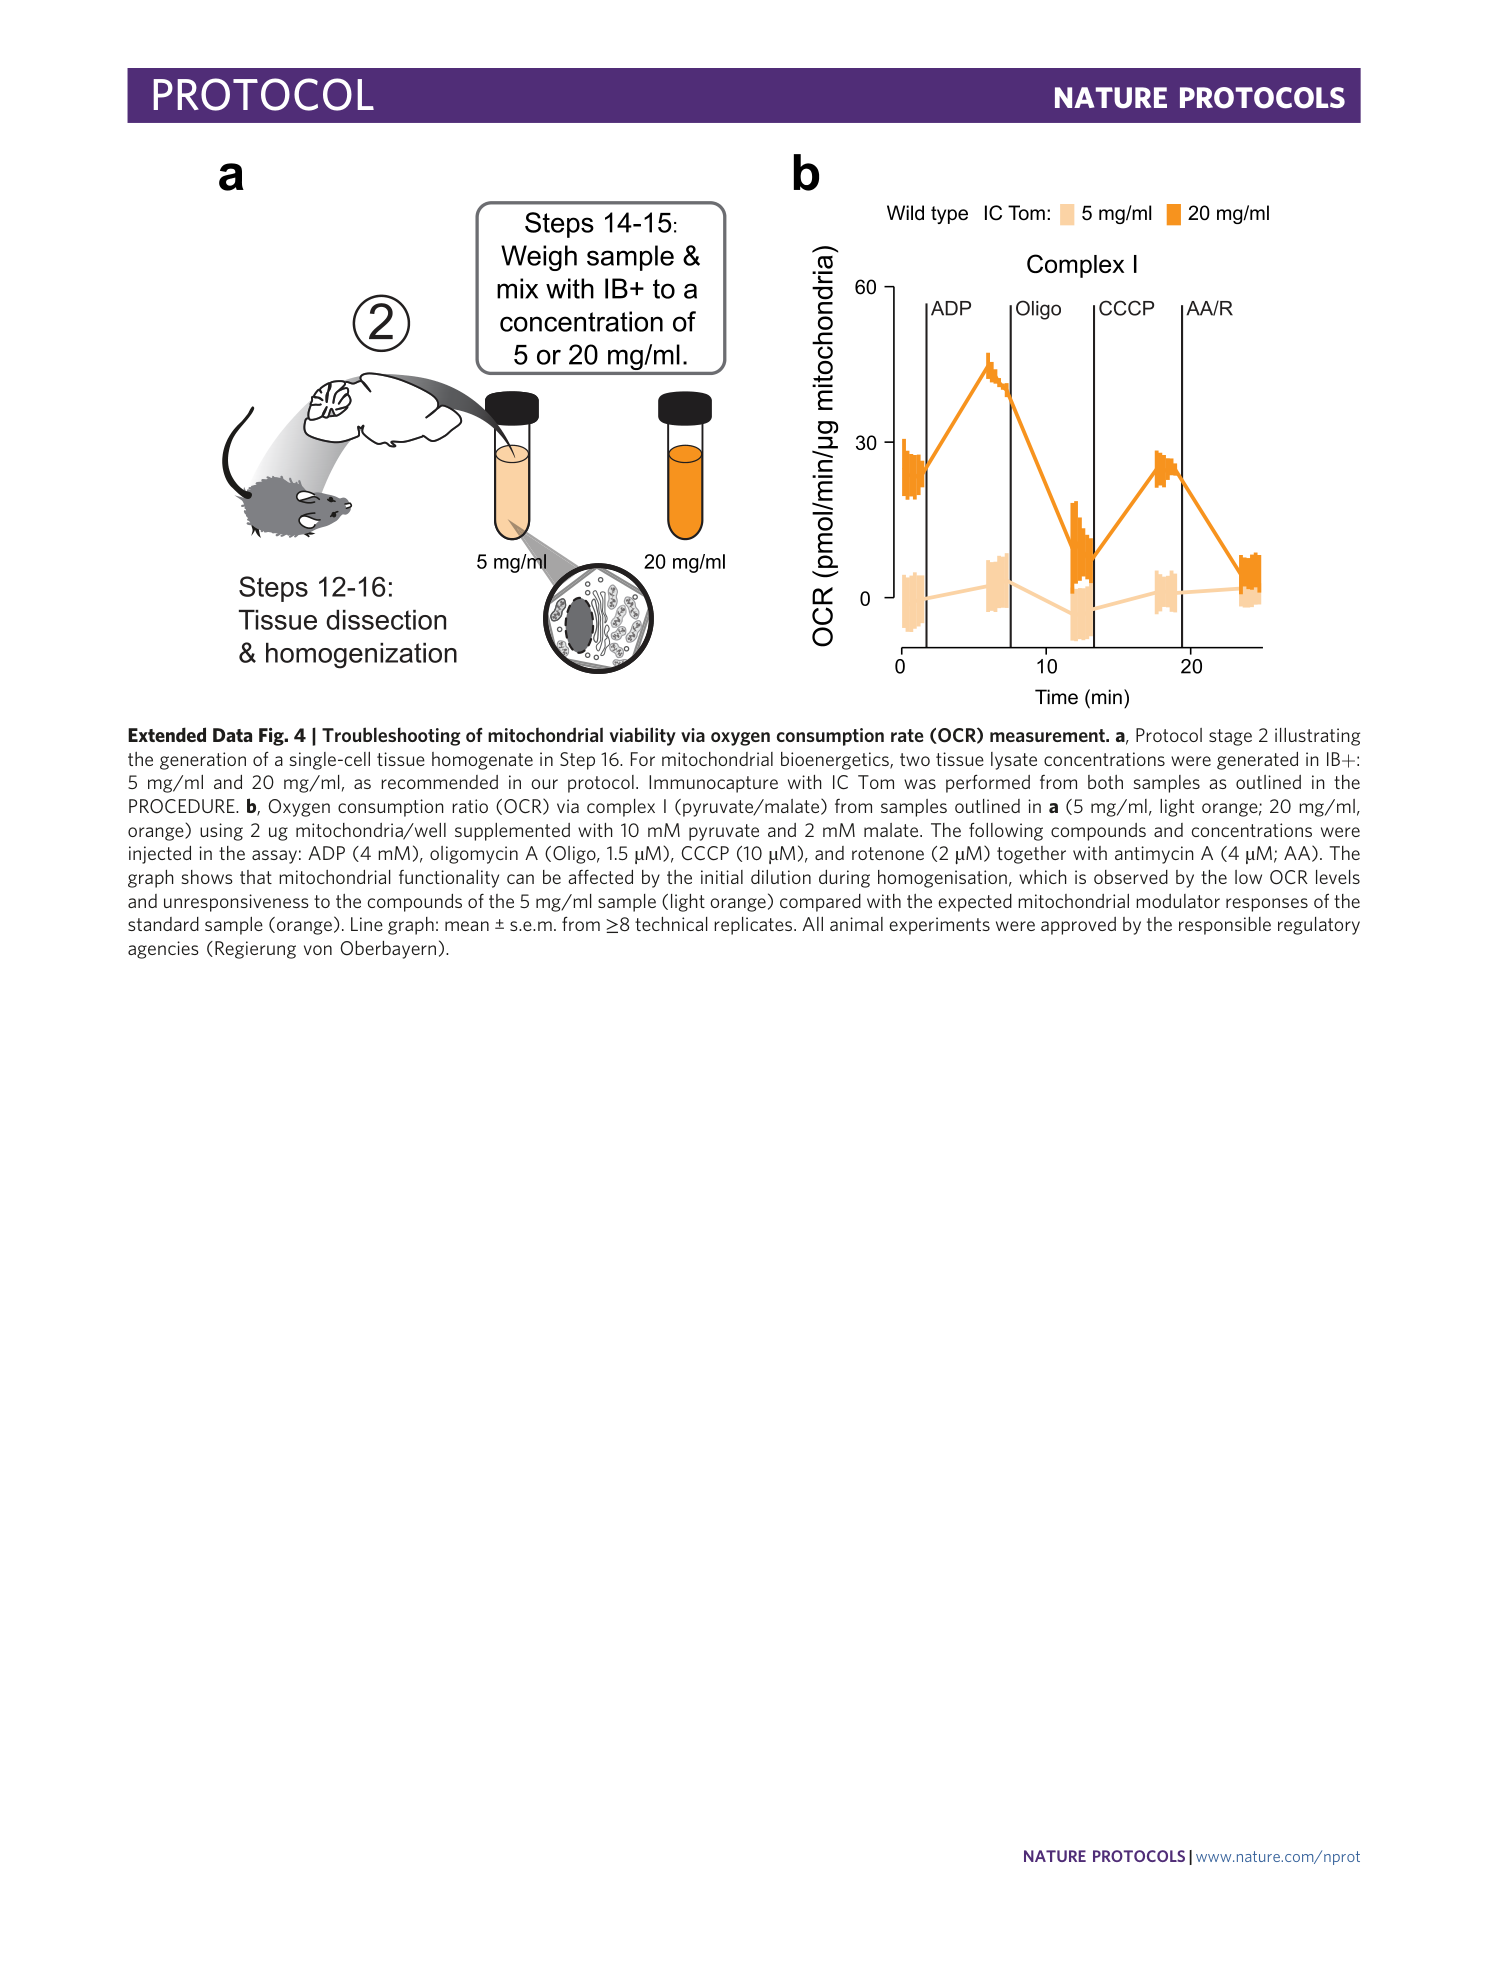
Extended Data Fig. 4 Troubleshooting of mitochondrial viability via oxygen consumption rate (OCR) measurement.
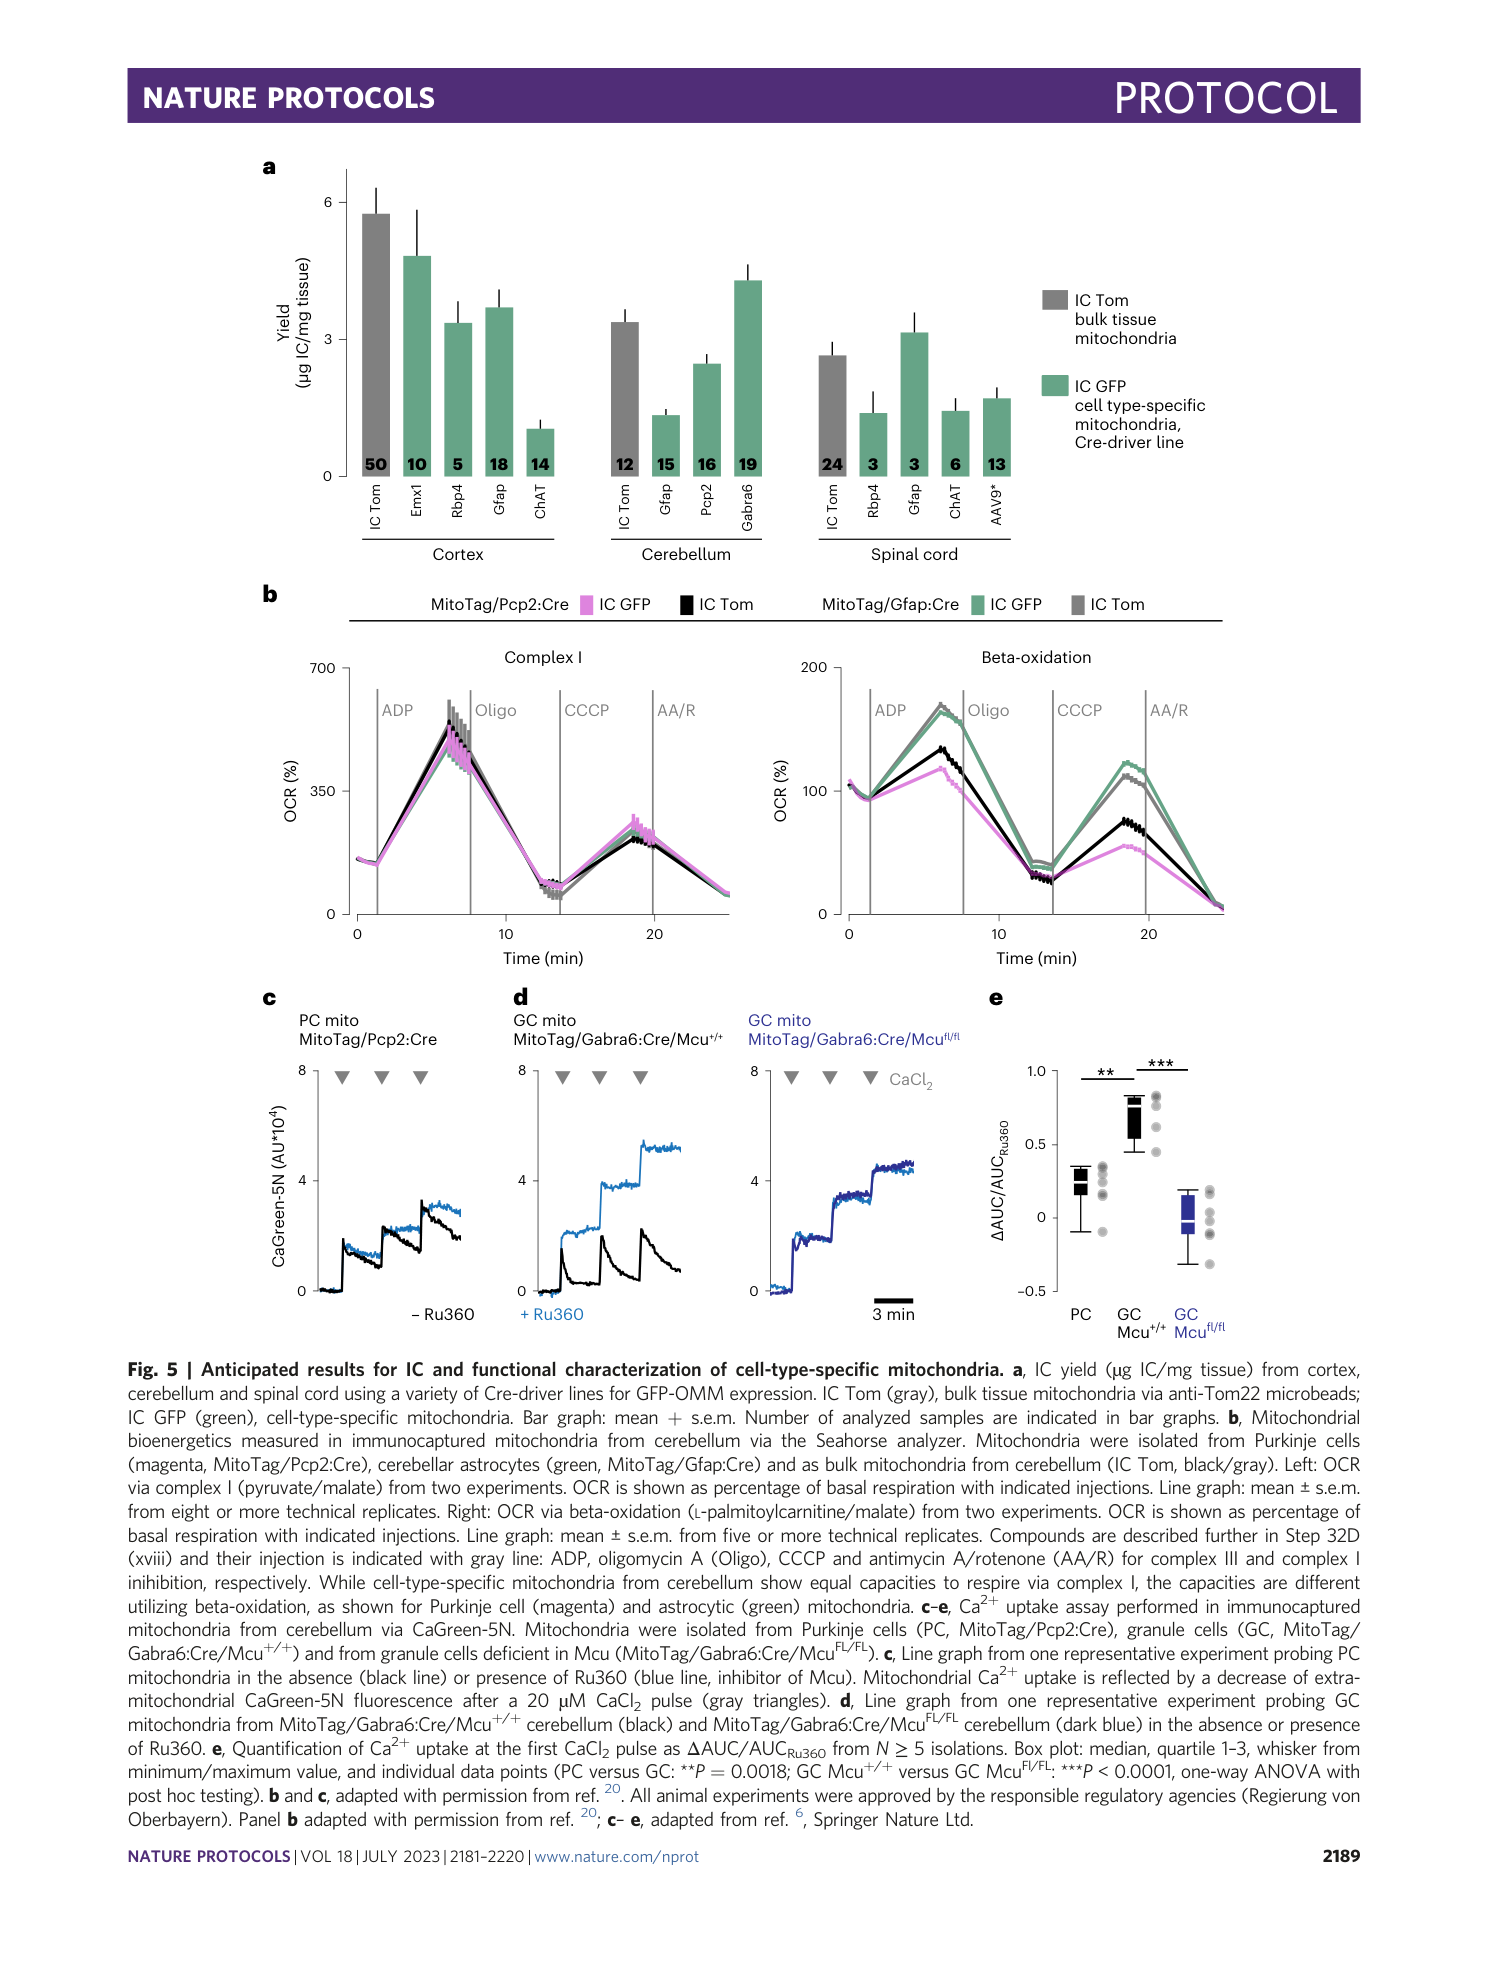
a , Protocol stage 2 illustrating the generation of a single-cell tissue homogenate in Step 16. For mitochondrial bioenergetics, two tissue lysate concentrations were generated in IB+: 5 mg/ml and 20 mg/ml, as recommended in our protocol. Immunocapture with IC Tom was performed from both samples as outlined in the PROCEDURE. b , Oxygen consumption ratio (OCR) via complex I (pyruvate/malate) from samples outlined in a (5 mg/ml, light orange; 20 mg/ml, orange) using 2 ug mitochondria/well supplemented with 10 mM pyruvate and 2 mM malate. The following compounds and concentrations were injected in the assay: ADP (4 mM), oligomycin A (Oligo, 1.5 µM), CCCP (10 µM), and rotenone (2 µM) together with antimycin A (4 µM; AA). The graph shows that mitochondrial functionality can be affected by the initial dilution during homogenisation, which is observed by the low OCR levels and unresponsiveness to the compounds of the 5 mg/ml sample (light orange) compared with the expected mitochondrial modulator responses of the standard sample (orange). Line graph: mean ± s.e.m. from ≥8 technical replicates. All animal experiments were approved by the responsible regulatory agencies (Regierung von Oberbayern).
[ Extended Data Fig. 5 Single-channel information from MitoTag/Gfap:Cre/Thy1:mitoRFP image represented in Fig. 4d . ](https://www.nature.com/articles/s41596-023-00831-w/figures/12)
Cortex from MitoTag/Gfap:Cre/Thy1:mitoRFP animals used as tissue source in the ‘spike-in’ experiment. a , Merged image shown in Fig. 4d and corresponding single channels. b , Detail from a . Scale bar, 20 µm for a , 10 µm for b .
Supplementary information
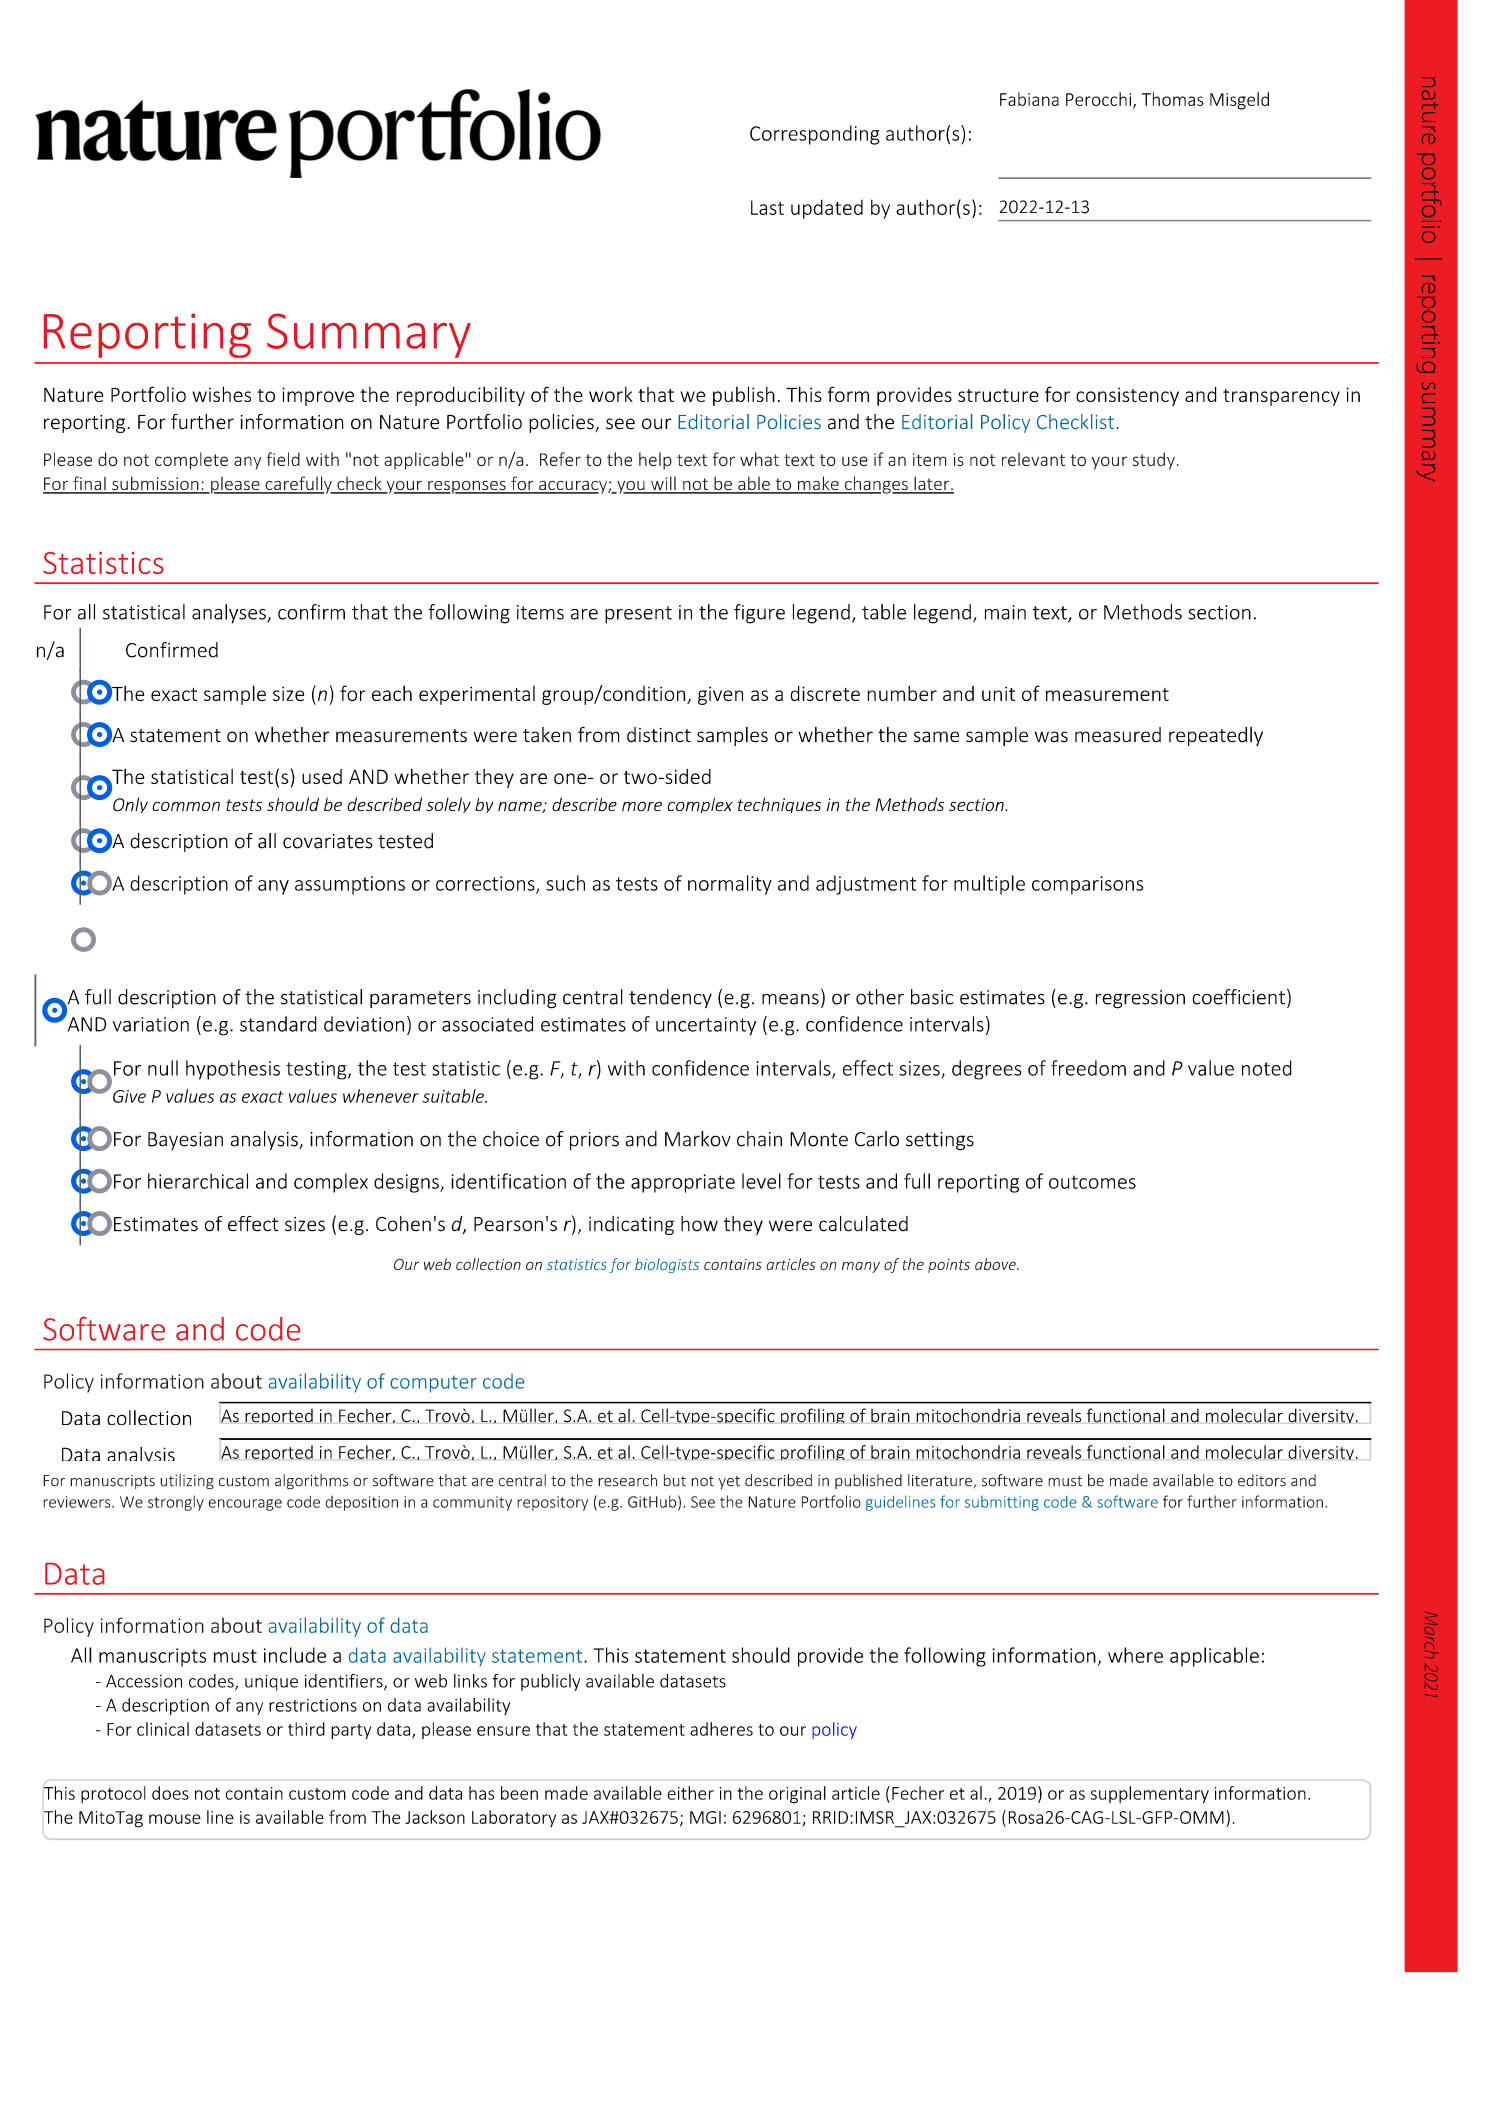
Reporting Summary
Supplementary Video 1
Description of how to perform Steps 17–20 corresponding to plasma membrane permeabilization using nitrogen cavitation.
