Engineered human blood–brain barrier microfluidic model for vascular permeability analyses
Cynthia Hajal, Giovanni S. Offeddu, Yoojin Shin, Shun Zhang, Olga Morozova, Dean Hickman, Charles G. Knutson, Roger D. Kamm
blood–brain barrier
microfluidic model
vascular permeability
stem-cell-derived endothelial cells
targeted therapies


Extended
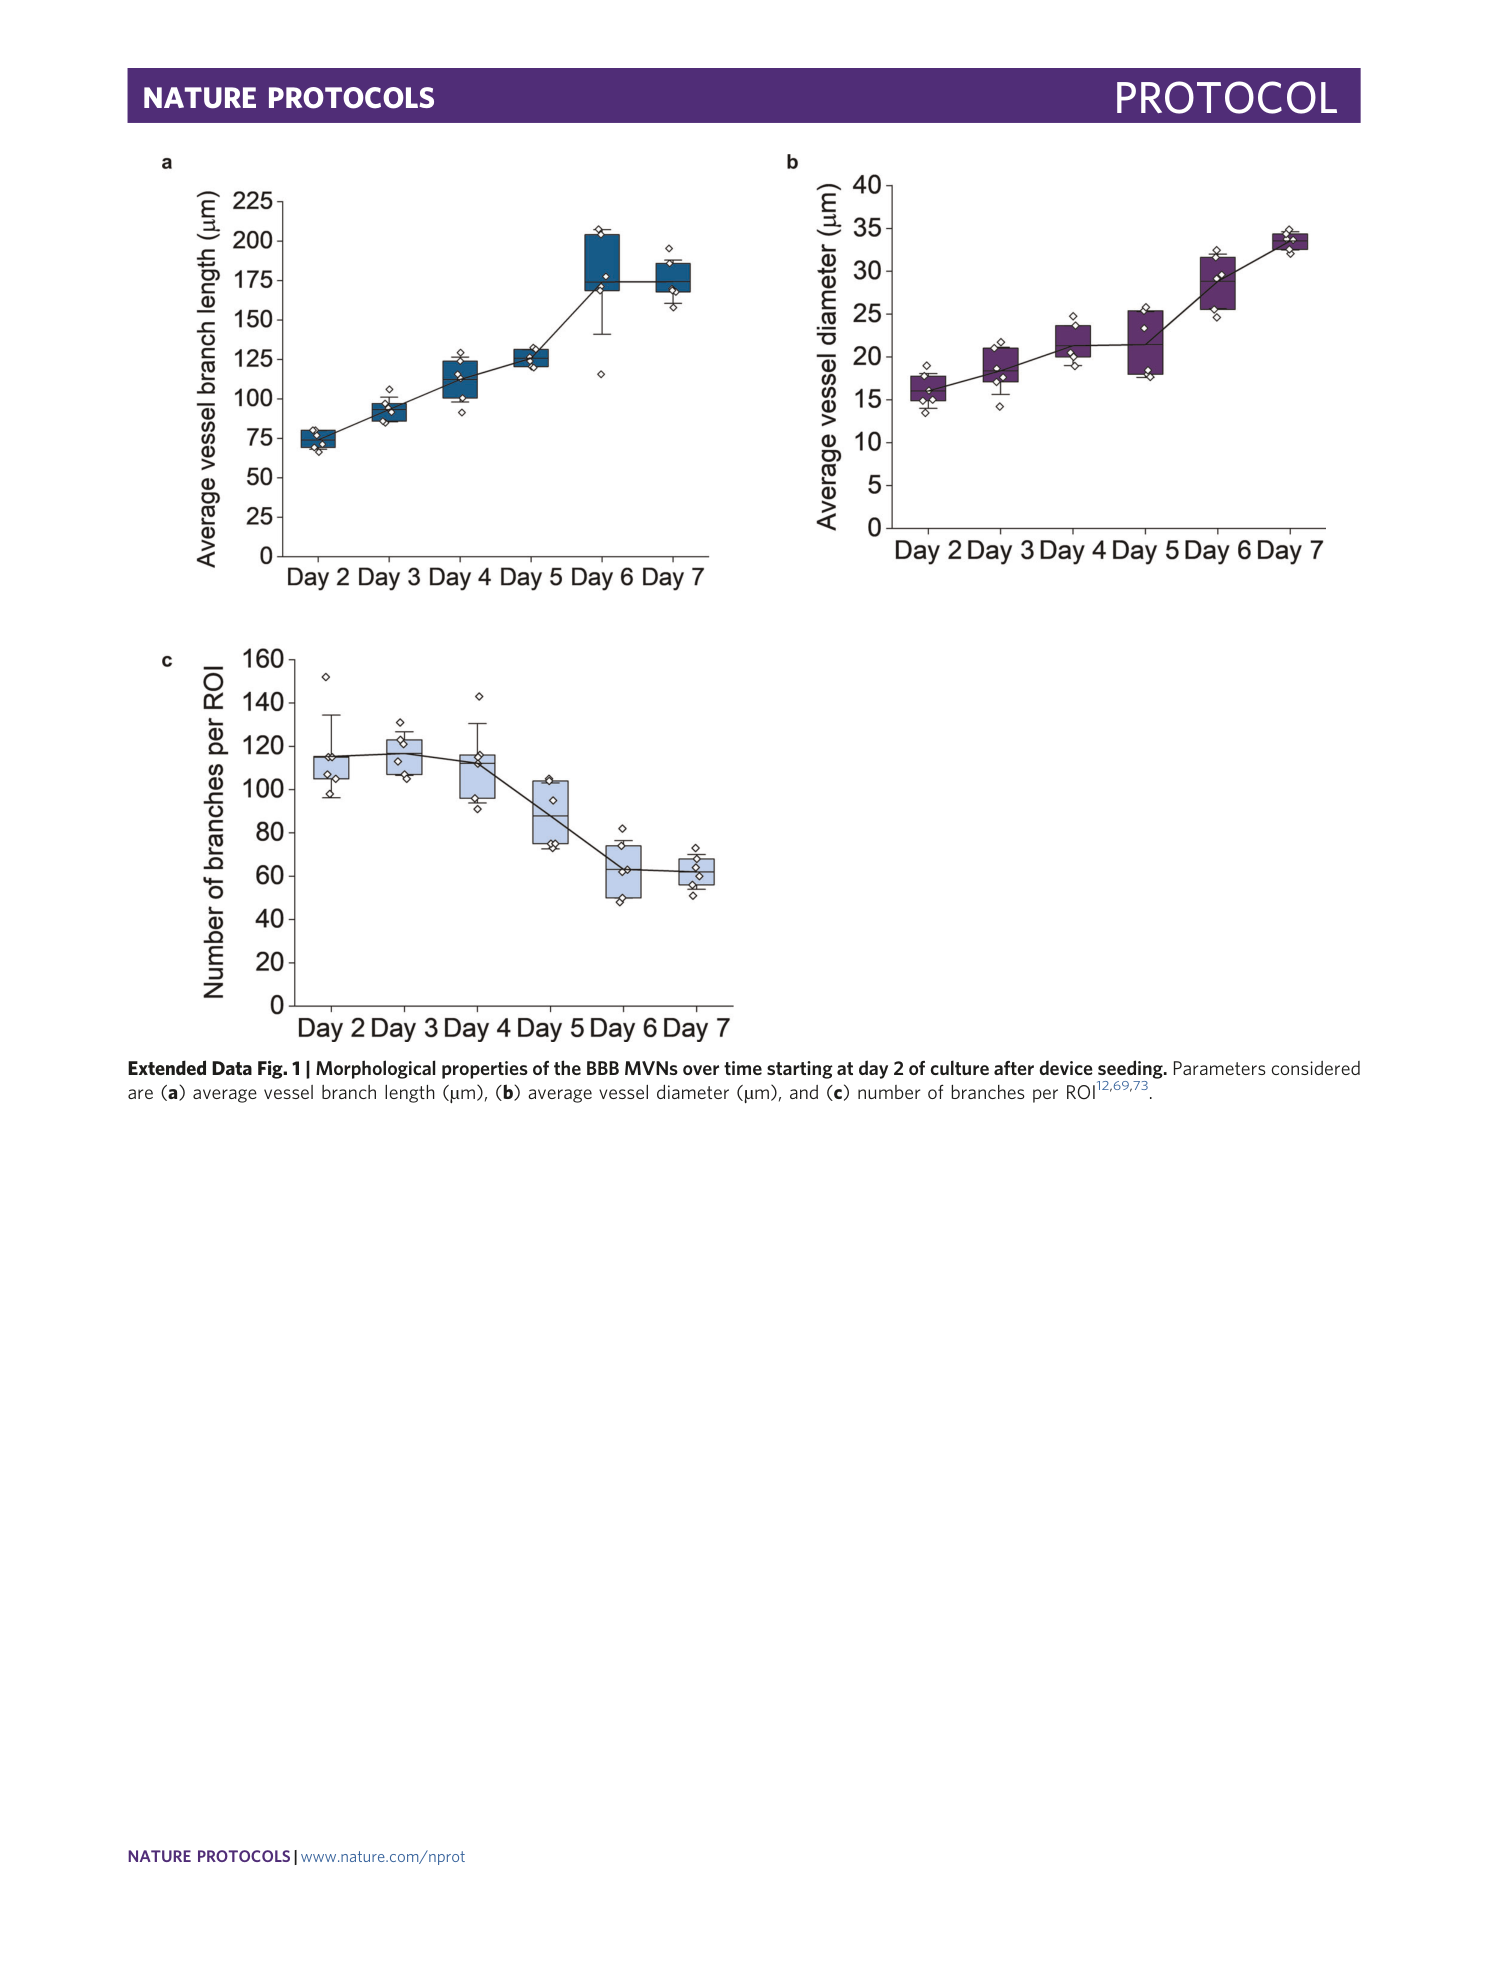
Extended Data Fig. 1 Morphological properties of the BBB MVNs over time starting at day 2 of culture after device seeding.
Parameters considered are ( a ) average vessel branch length (µm), ( b ) average vessel diameter (µm), and ( c ) number of branches per ROI 12 , 69 , 73 .
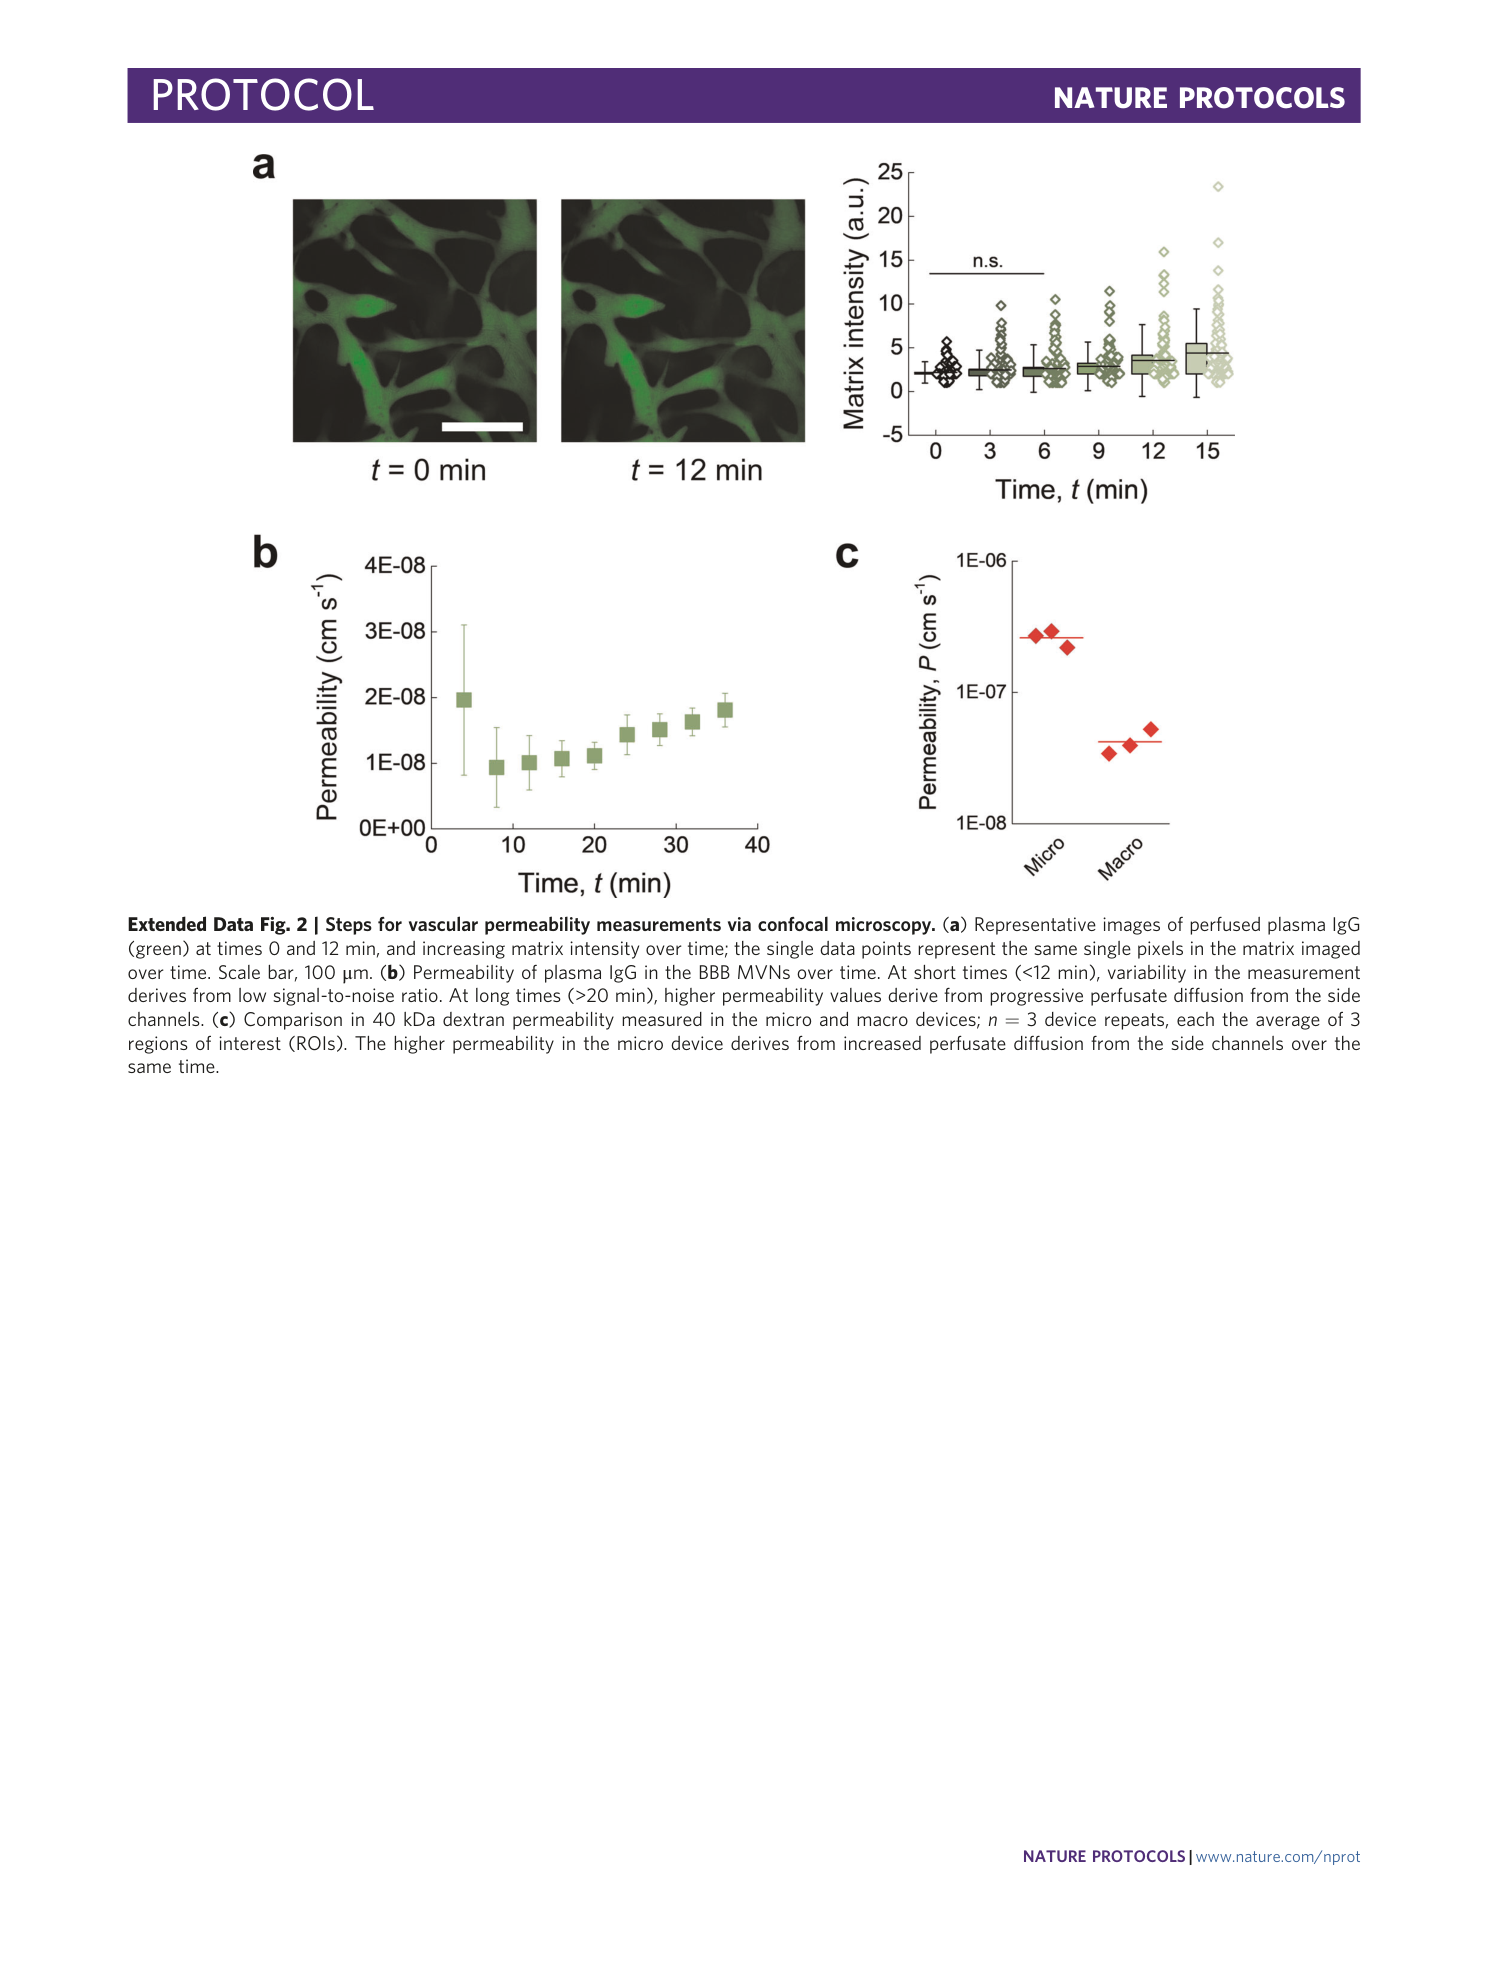
Extended Data Fig. 2 Steps for vascular permeability measurements via confocal microscopy.
( a ) Representative images of perfused plasma IgG (green) at times 0 and 12 min, and increasing matrix intensity over time; the single data points represent the same single pixels in the matrix imaged over time. Scale bar, 100 μm. ( b ) Permeability of plasma IgG in the BBB MVNs over time. At short times (<12 min), variability in the measurement derives from low signal-to-noise ratio. At long times (>20 min), higher permeability values derive from progressive perfusate diffusion from the side channels. ( c ) Comparison in 40 kDa dextran permeability measured in the micro and macro devices; n = 3 device repeats, each the average of 3 regions of interest (ROIs). The higher permeability in the micro device derives from increased perfusate diffusion from the side channels over the same time.
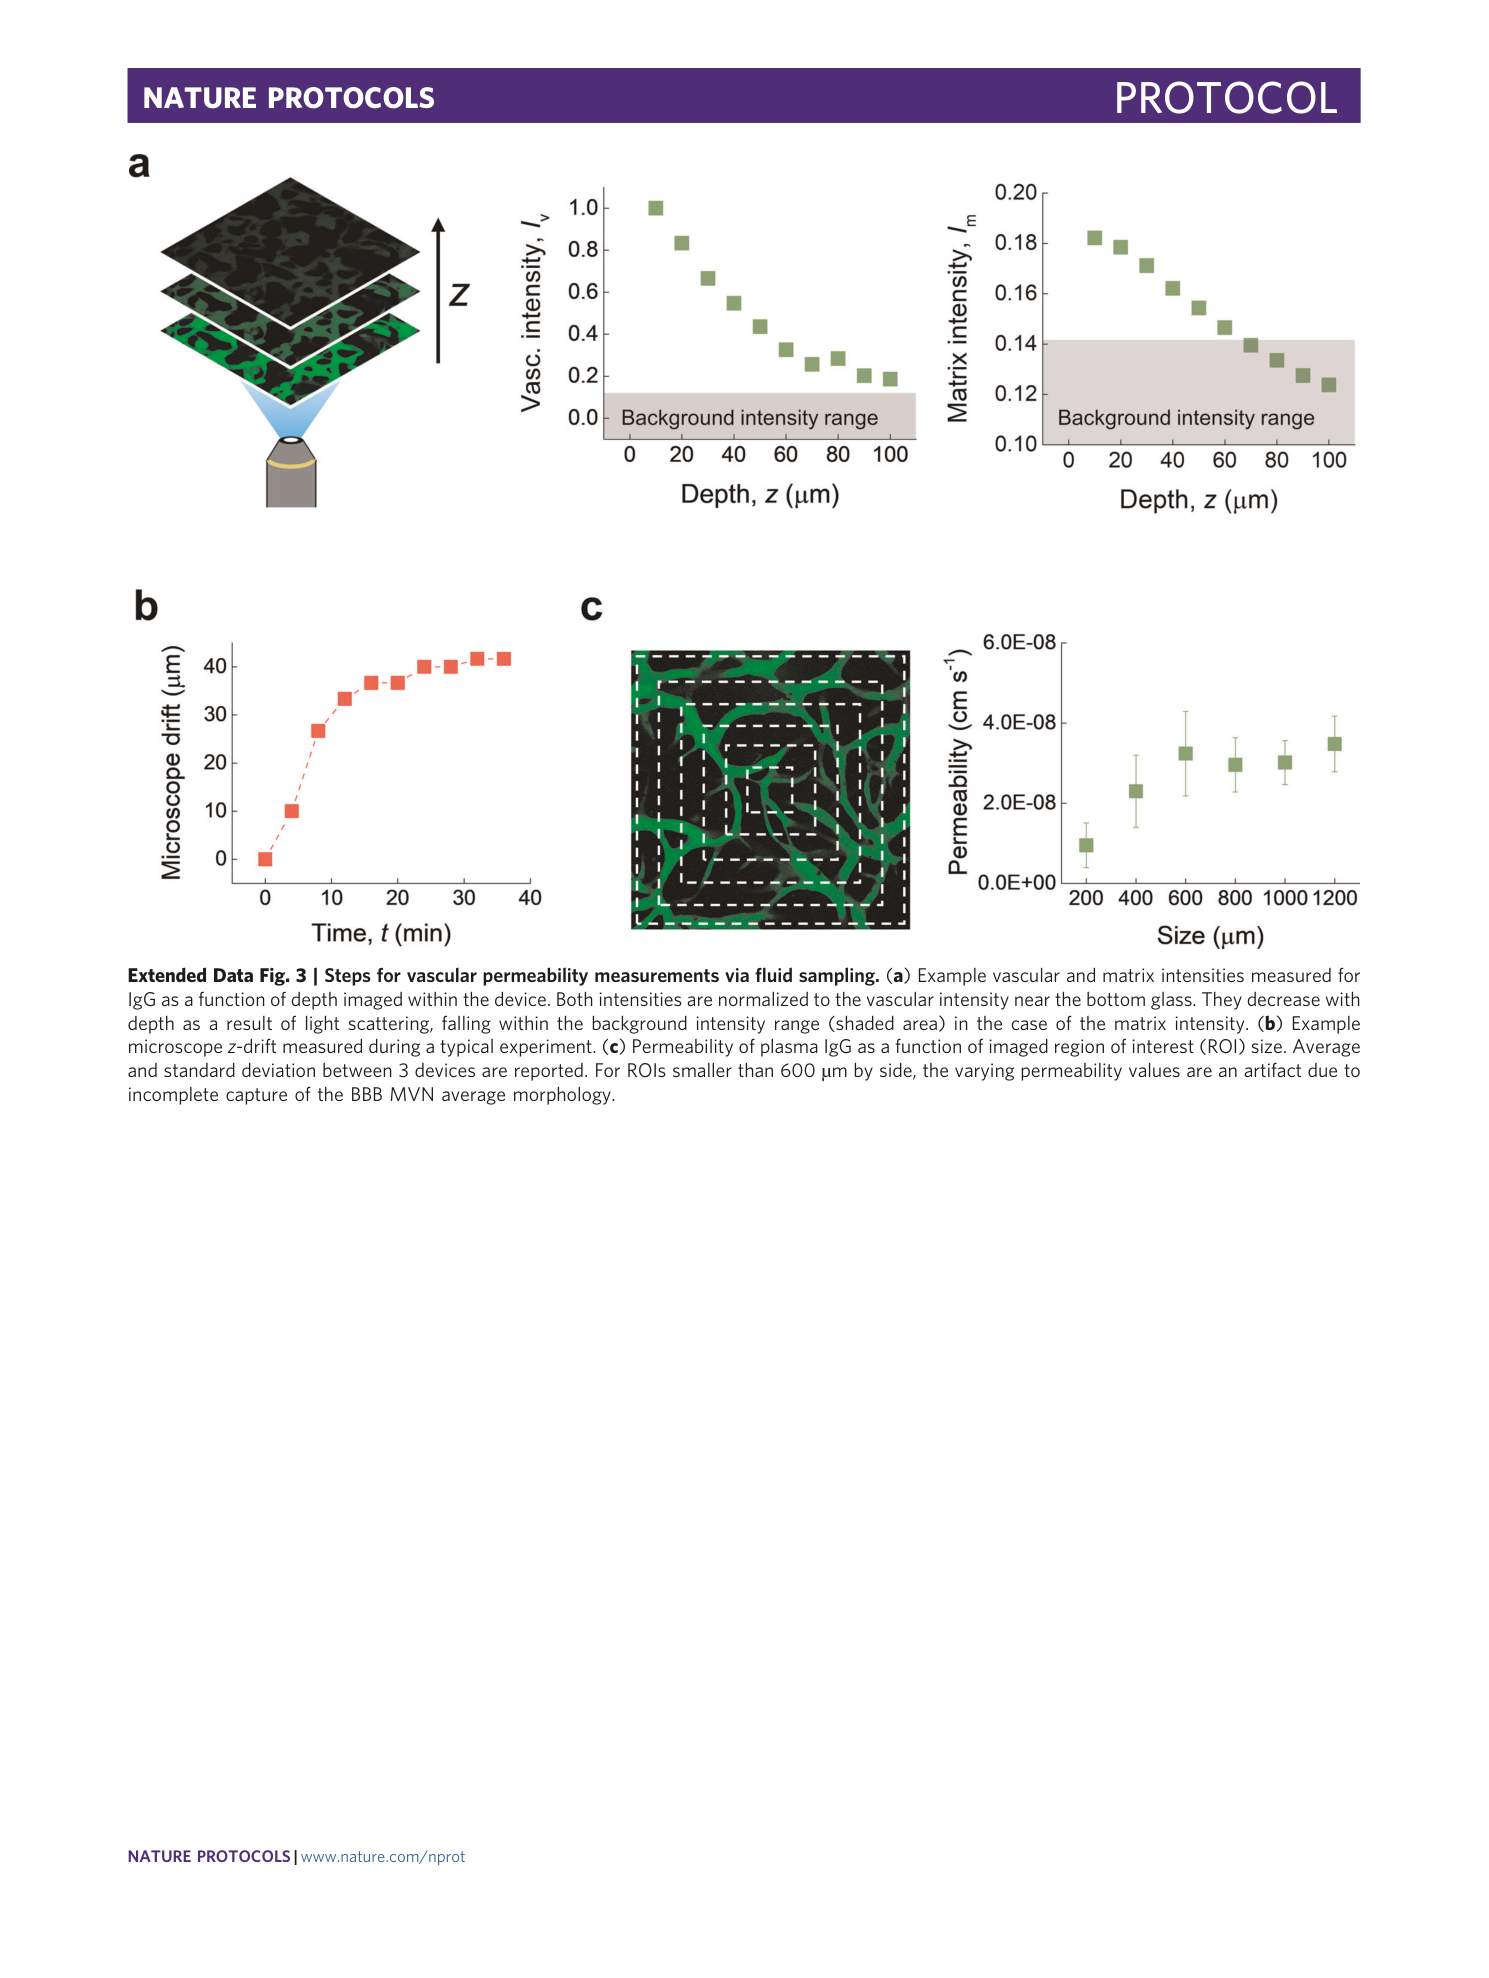
Extended Data Fig. 3 Steps for vascular permeability measurements via fluid sampling.
( a ) Example vascular and matrix intensities measured for IgG as a function of depth imaged within the device. Both intensities are normalized to the vascular intensity near the bottom glass. They decrease with depth as a result of light scattering, falling within the background intensity range (shaded area) in the case of the matrix intensity. ( b ) Example microscope z -drift measured during a typical experiment. ( c ) Permeability of plasma IgG as a function of imaged region of interest (ROI) size. Average and standard deviation between 3 devices are reported. For ROIs smaller than 600 µm by side, the varying permeability values are an artifact due to incomplete capture of the BBB MVN average morphology.
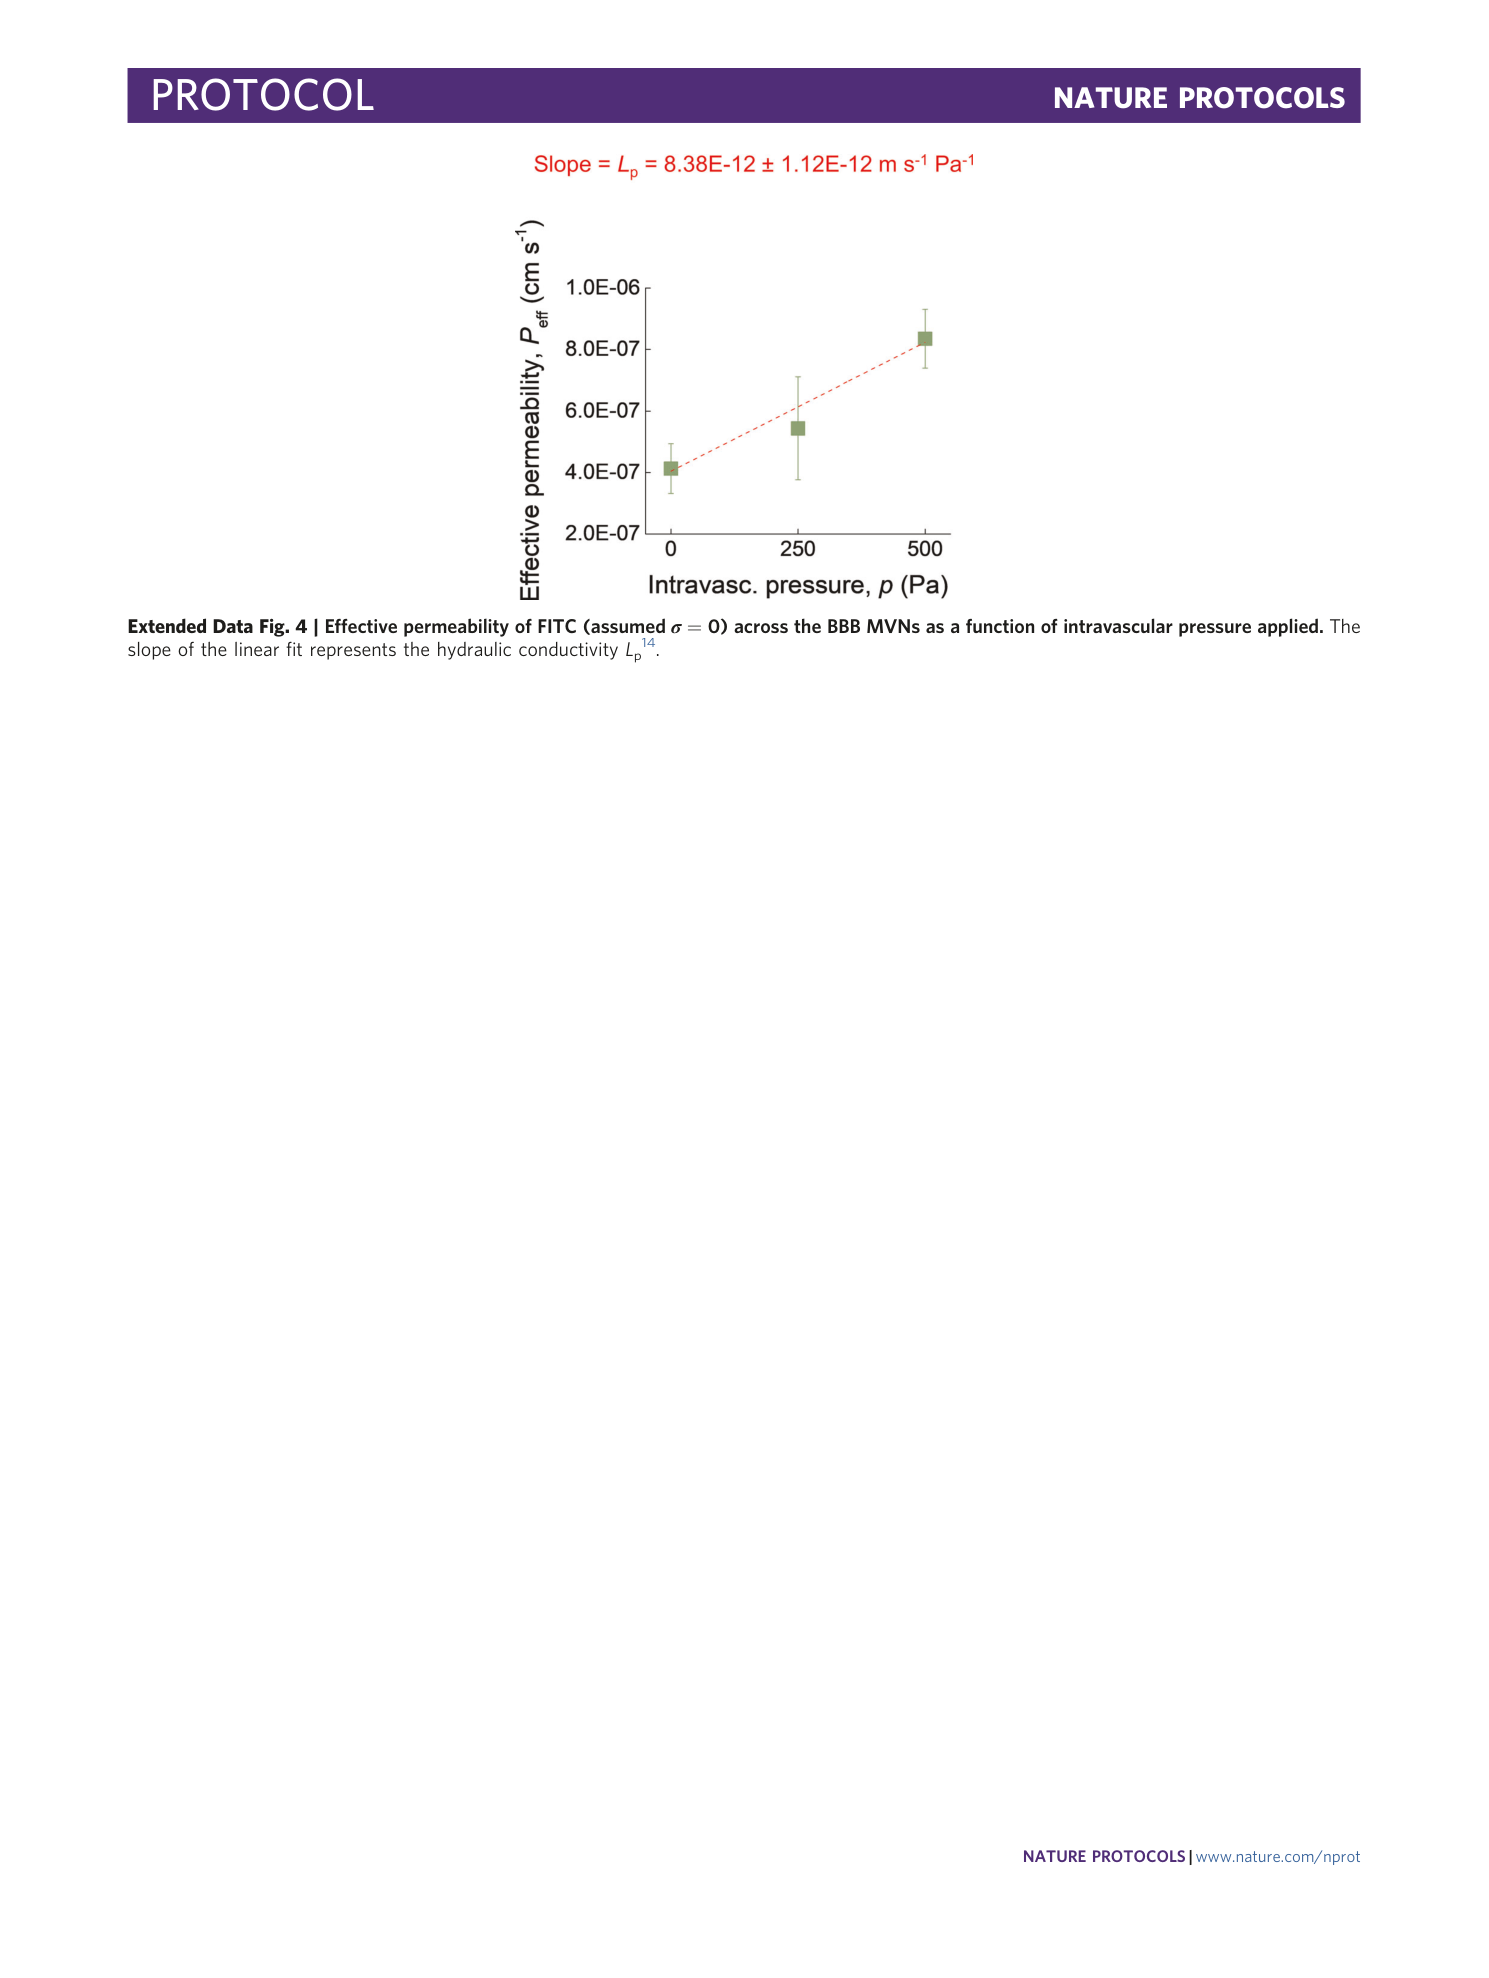
Extended Data Fig. 4 Effective permeability of FITC (assumed σ = 0) across the BBB MVNs as a function of intravascular pressure applied.
The slope of the linear fit represents the hydraulic conductivity L p 14 .
Extended Data Fig. 5 Immunofluorescence staining for various proteins of interest in the BBB MVNs with iPS-ECs (steps 52-59 in the protocol).
( a ) Staining of water channel protein (aquaporin 4) in ACs in the BBB MVNs. ( b ) Staining of glycocalyx protein (hyaluronic acid) in the BBB MVNs. ( c ) Staining of tight junction protein (claudin-5) in the BBB MVNs. Scale bars are 100 µm for (a-b) and 50 µm for (c).
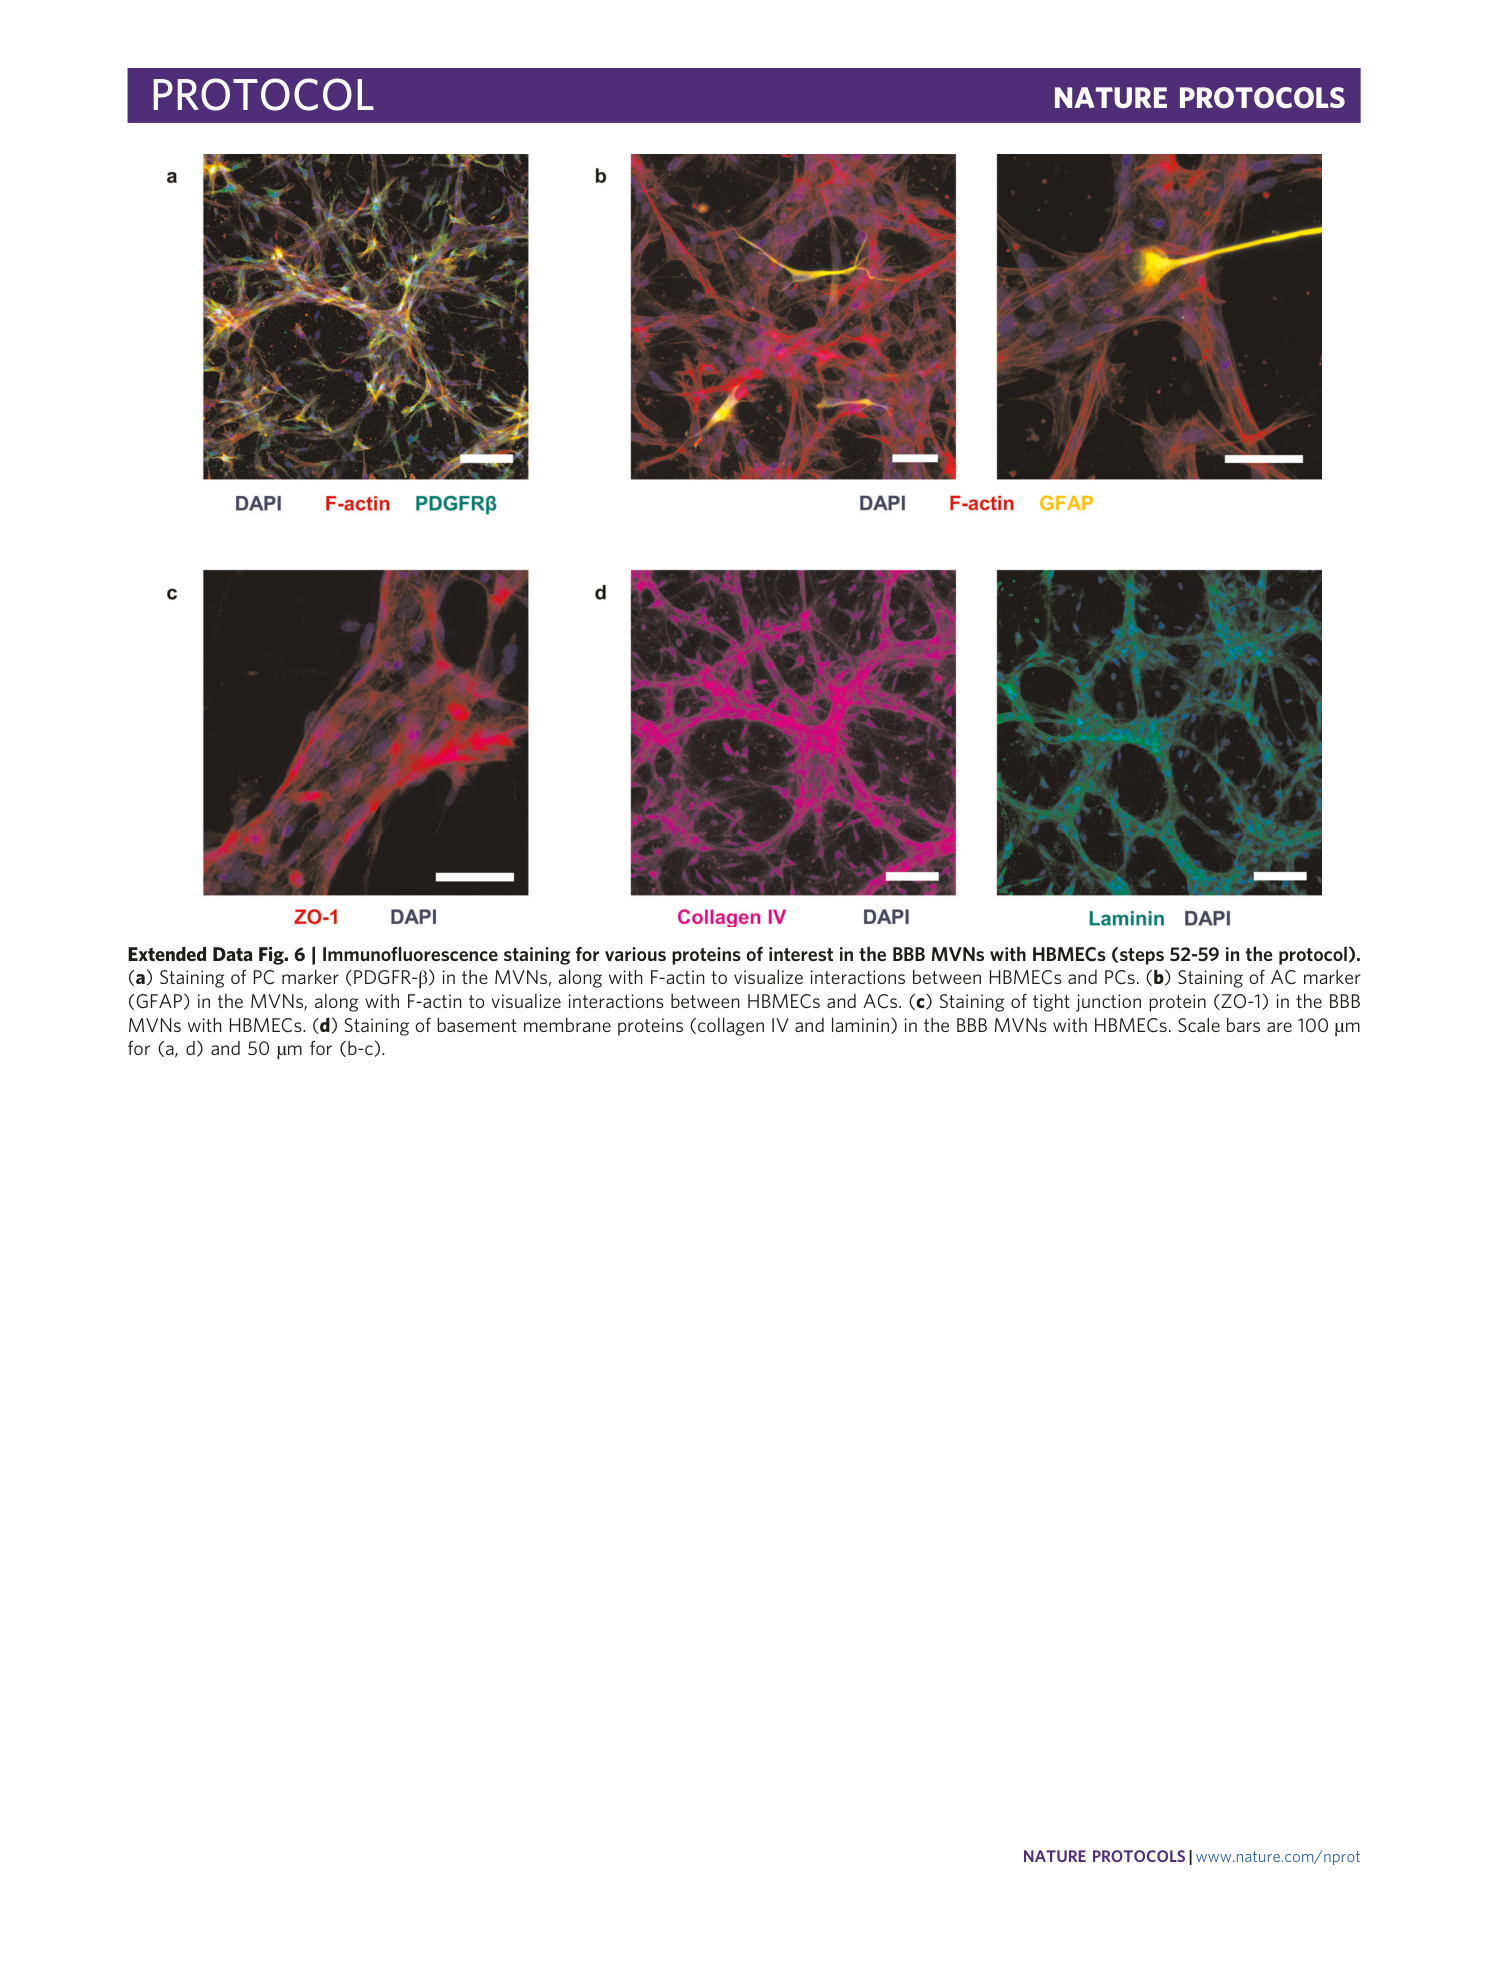
Extended Data Fig. 6 Immunofluorescence staining for various proteins of interest in the BBB MVNs with HBMECs (steps 52-59 in the protocol).
( a ) Staining of PC marker (PDGFR-β) in the MVNs, along with F-actin to visualize interactions between HBMECs and PCs. ( b ) Staining of AC marker (GFAP) in the MVNs, along with F-actin to visualize interactions between HBMECs and ACs. ( c ) Staining of tight junction protein (ZO-1) in the BBB MVNs with HBMECs. ( d ) Staining of basement membrane proteins (collagen IV and laminin) in the BBB MVNs with HBMECs. Scale bars are 100 µm for (a, d) and 50 µm for (b-c).
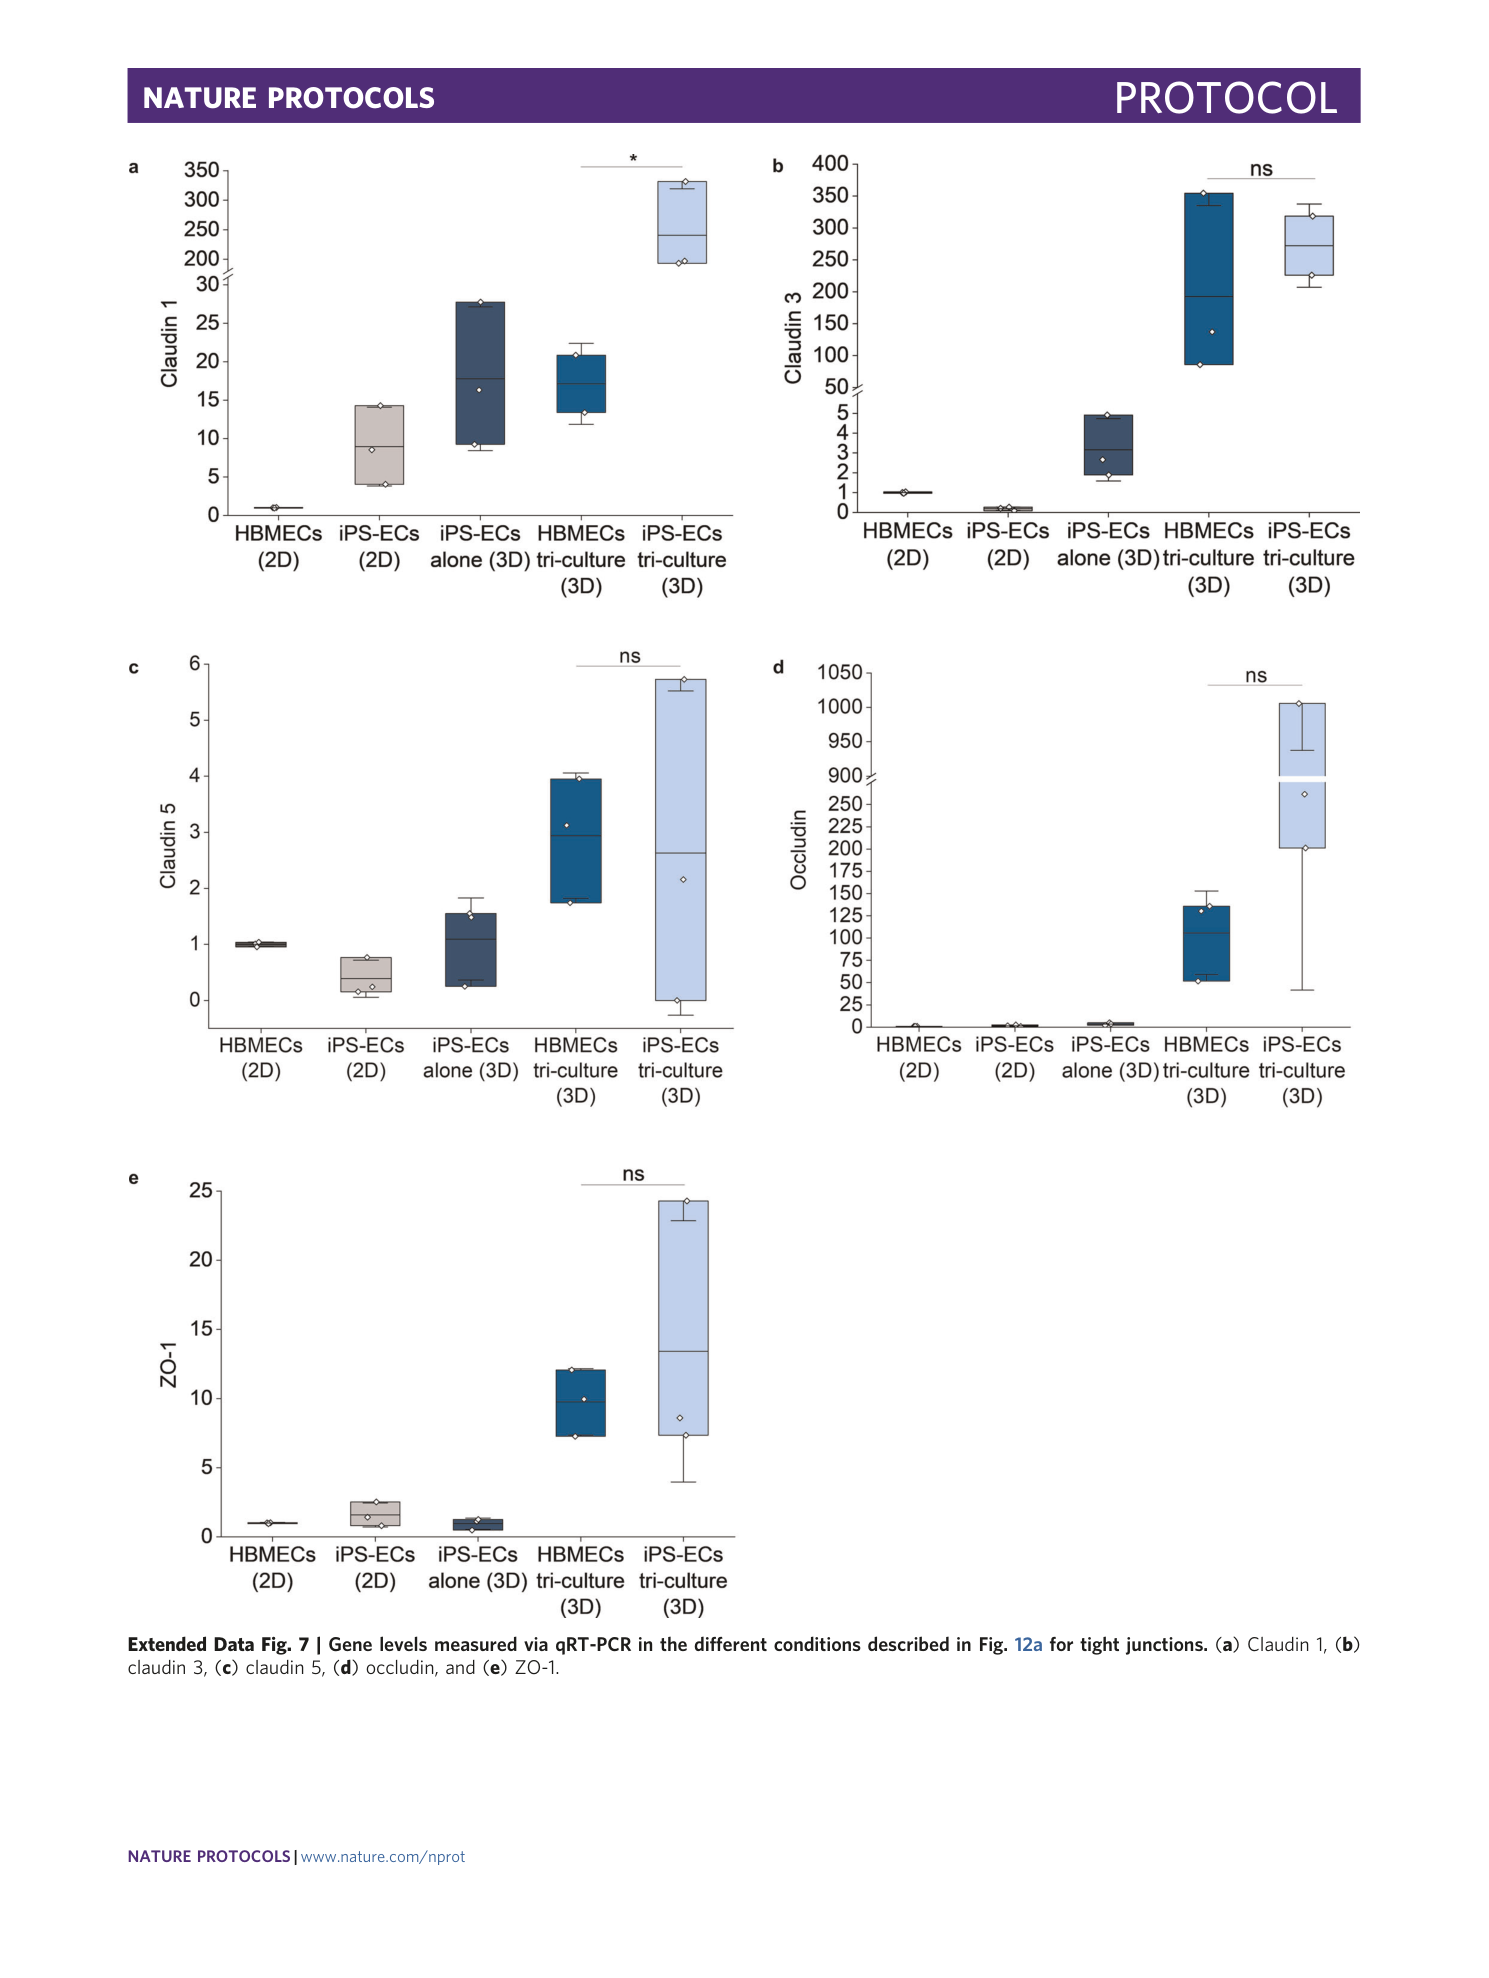
[ Extended Data Fig. 7 Gene levels measured via qRT-PCR in the different conditions described in Fig. 12a for tight junctions. ](https://www.nature.com/articles/s41596-021-00635-w/figures/22)
( a ) Claudin 1, ( b ) claudin 3, ( c ) claudin 5, ( d ) occludin, and ( e ) ZO-1.
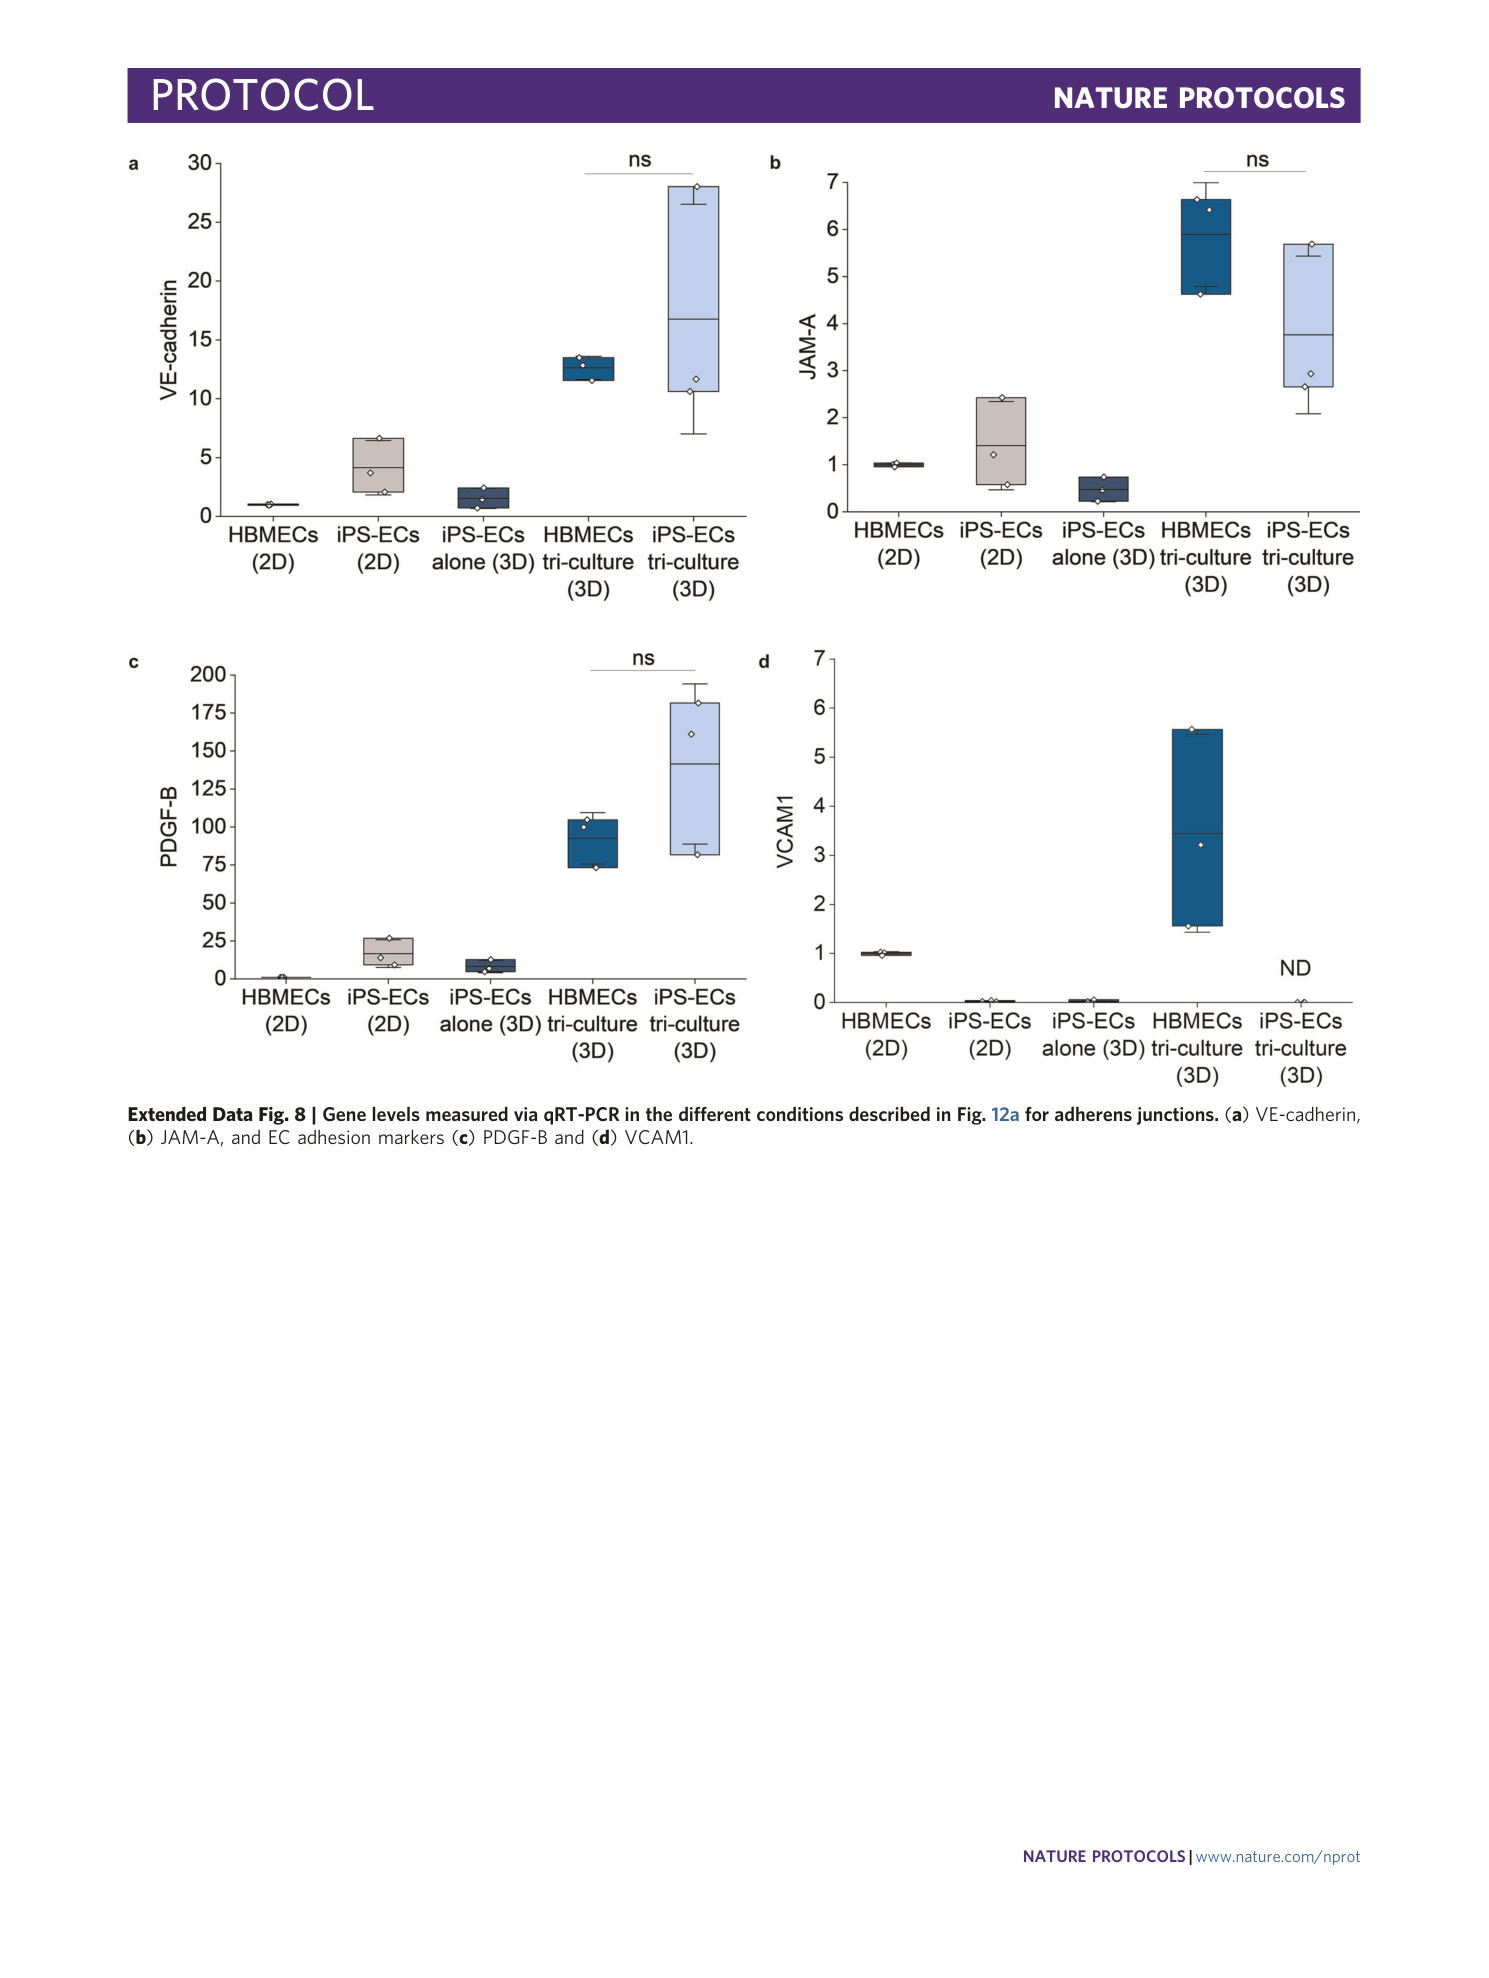
[ Extended Data Fig. 8 Gene levels measured via qRT-PCR in the different conditions described in Fig. 12a for adherens junctions. ](https://www.nature.com/articles/s41596-021-00635-w/figures/23)
( a ) VE-cadherin, ( b ) JAM-A, and EC adhesion markers ( c ) PDGF-B and ( d ) VCAM1.
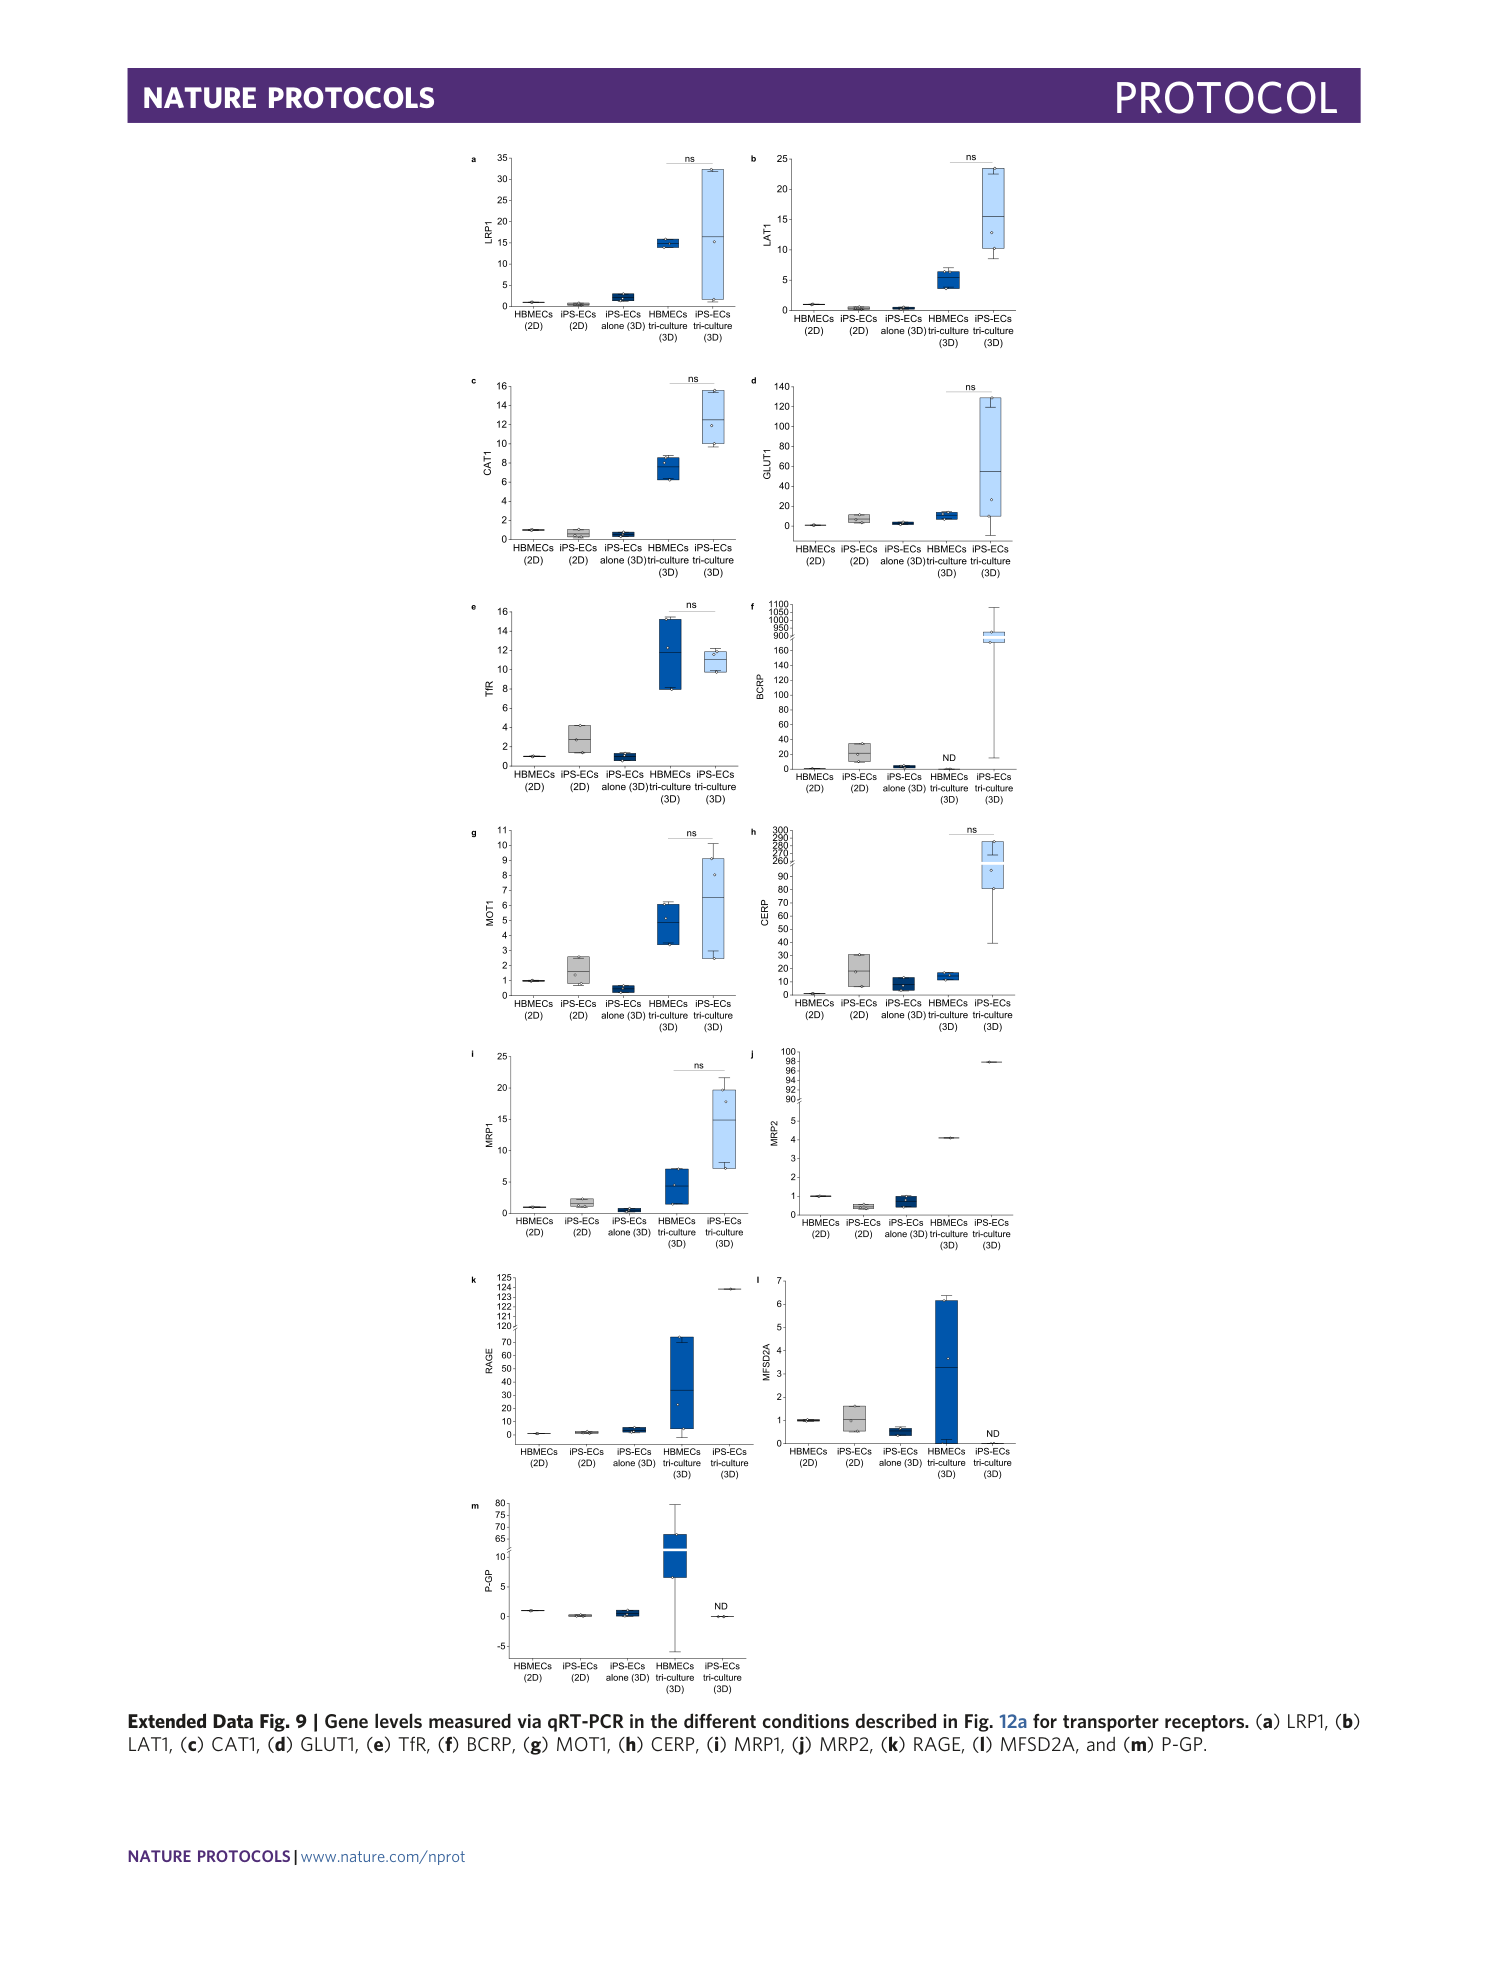
[ Extended Data Fig. 9 Gene levels measured via qRT-PCR in the different conditions described in Fig. 12a for transporter receptors. ](https://www.nature.com/articles/s41596-021-00635-w/figures/24)
( a ) LRP1, ( b ) LAT1, ( c ) CAT1, ( d ) GLUT1, ( e ) TfR, ( f ) BCRP, ( g ) MOT1, ( h ) CERP, ( i ) MRP1, ( j ) MRP2, ( k ) RAGE, ( l ) MFSD2A, and ( m ) P-GP.
Supplementary information
Supplementary Information
Supplementary Figs. 1 and 2, Supplementary Table 1 and Supplementary Method.
Reporting Summary
Supplementary Data 1
CAD file 1 for macro device
Supplementary Data 2
CAD file 2 for micro device
Supplementary Data 3
Raw data to graph and obtain statistical measures for Fig. 12 and Extended Data Figs. 7–9.
Supplementary Software 1
Macro code for permeability measurements using ImageJ
Supplementary Software 2
Classifier model for permeability measurements using ImageJ
Supplementary Table 2
Spreadsheet with template for permeability measurements using ImageJ
