Determining ADCC Activity of Antibody-Based Therapeutic Molecules using Two Bioluminescent Reporter-Based Bioassays
Jun Wang, Jun Wang, Denise Garvin, Denise Garvin, Pete Stecha, Pete Stecha, Julia Gilden, Julia Gilden, Jamison Grailer, Jamison Grailer, Jim Hartnett, Jim Hartnett, Frank Fan, Frank Fan, Mei Cong, Mei Cong, Zhijie Jey Cheng, Zhijie Jey Cheng
Abstract
Antibody Fc effector function is one of the main mechanisms of action (MoA) for therapeutic monoclonal antibodies. Measurement of antibody-dependent cellular cytotoxicity (ADCC) is critical for understanding the Fc effector function during monoclonal antibody development. This article covers two cell-based ADCC bioassays which can quantitatively measure the antibody potency in ADCC. Basic Protocol 1 describes the ADCC reporter bioassay using engineered ADCC effector cells which measures the FcγRIIIa-mediated luciferase reporter activation upon the binding of antibody-coated target cells. Basic Protocol 2 describes the PBMC ADCC bioassay using primary peripheral blood mononuclear cells (PBMC) as effector cells and engineered HiBiT target cells in an assay that measures the release of HiBiT from target cells upon antibody-mediated target lysis. Optimization of several key assay parameters including cell handling, effector:target (E:T) ratios, assay plate, and plate reader requirement, and how these parameters impact assay performance are discussed. © 2021 Promega Corporation. Current Protocols published by Wiley Periodicals LLC.
Basic Protocol 1 : ADCC reporter bioassay using engineered ADCC bioassay effector cells
Basic Protocol 2 : PBMC ADCC bioassay using primary PBMC and engineered HiBiT target cells
INTRODUCTION
Antibody-dependent cellular cytotoxicity (ADCC) is induced by engagement of Fc domain of antibodies with Fc gamma receptors (FcγRs) on effector cells, while antibodies bind to the tumor antigens on the target cells via the Fab domain simultaneously (Nimmerjahn, & Ravetch, 2008). This triggers the crosslinking and activation of the Fc receptors, cytokine release, and the formation of cytotoxic granules containing perforin and granzyme which ultimately leads to target cell killing (Chan & Carter, 2010; Fanger, Shen, Graziano, & Guyre, 1989; Vivier et al., 1992; Azzoni, Kamoun, Salcedo, Kanakaraj, & Perussia, 1992; Lyubchenko, Wurth, & Zweifach, 2001). ADCC is the main mechanism of action (MoA) for many antibody-based therapeutic molecules (Carter et al., 1992; Dall'Ozzo et al., 2004; Jiang et al., 2011; Leader, Baca, & Golan, 2008; Patel et al., 2010; Prang et al., 2005; Reff et al., 1994; Vermorken et al., 2008).
Despite the increasing interest and clinical success of the therapeutic antibodies, it has been highly challenging to measure the Fc effector function in ADCC for therapeutic antibodies in a reproducible and quantitative manner due to the lack of consistency in current methods that are based on primary cells and use tedious assay procedures (Brunner, Mauel, Cerottini, & Chapuis, 1968; Koene et al., 1997). This article describes two newly developed ADCC assays which focus on the improvements to overcome previous assay challenges. Basic Protocol 1 provides the detailed instructions for ADCC reporter bioassay using engineered reporter effector cells and outlines the steps to measure Fc receptor-mediated luciferase activation upon incubation with antibody and target cells. Basic Protocol 2 provides detailed instruction for a peripheral blood mononuclear cells (PBMC) ADCC assay using HiBiT-expressing target cells and outlines the steps to measure HiBiT release upon antibody-mediated target cell lysis by primary PBMC.
NOTE : Federal regulations require that research projects involving human subjects be reviewed by an Institutional Review Board (IRB). The IRB must approve or determine the project to be exempt prior to the start of any research activities.
Basic Protocol 1: ADCC REPORTER BIOASSAY USING ENGINEERED ADCC BIOASSAY EFFECTOR CELLS
The ADCC reporter bioassay is a bioluminescent reporter-gene assay for quantifying the biological activity of the antibody via FcγRIIIa-mediated pathway activation in an ADCC mechanism of action (Cheng et al., 2014; Leibson, 1997). The assay uses ADCC bioassay effector cells which are engineered Jurkat cells stably expressing the human FcγRIIIa receptor, V158 or F158 variants and an NFAT response element (NFAT-RE) driving the expression of firefly luciferase (Fig. 1). When the antibody binds to the antigens on the target cells and the FcγRIIIa receptor on the ADCC bioassay effector cells, it leads to the activation of FcγRIIIa and the subsequent luciferase activation in the ADCC bioassay effector cells.
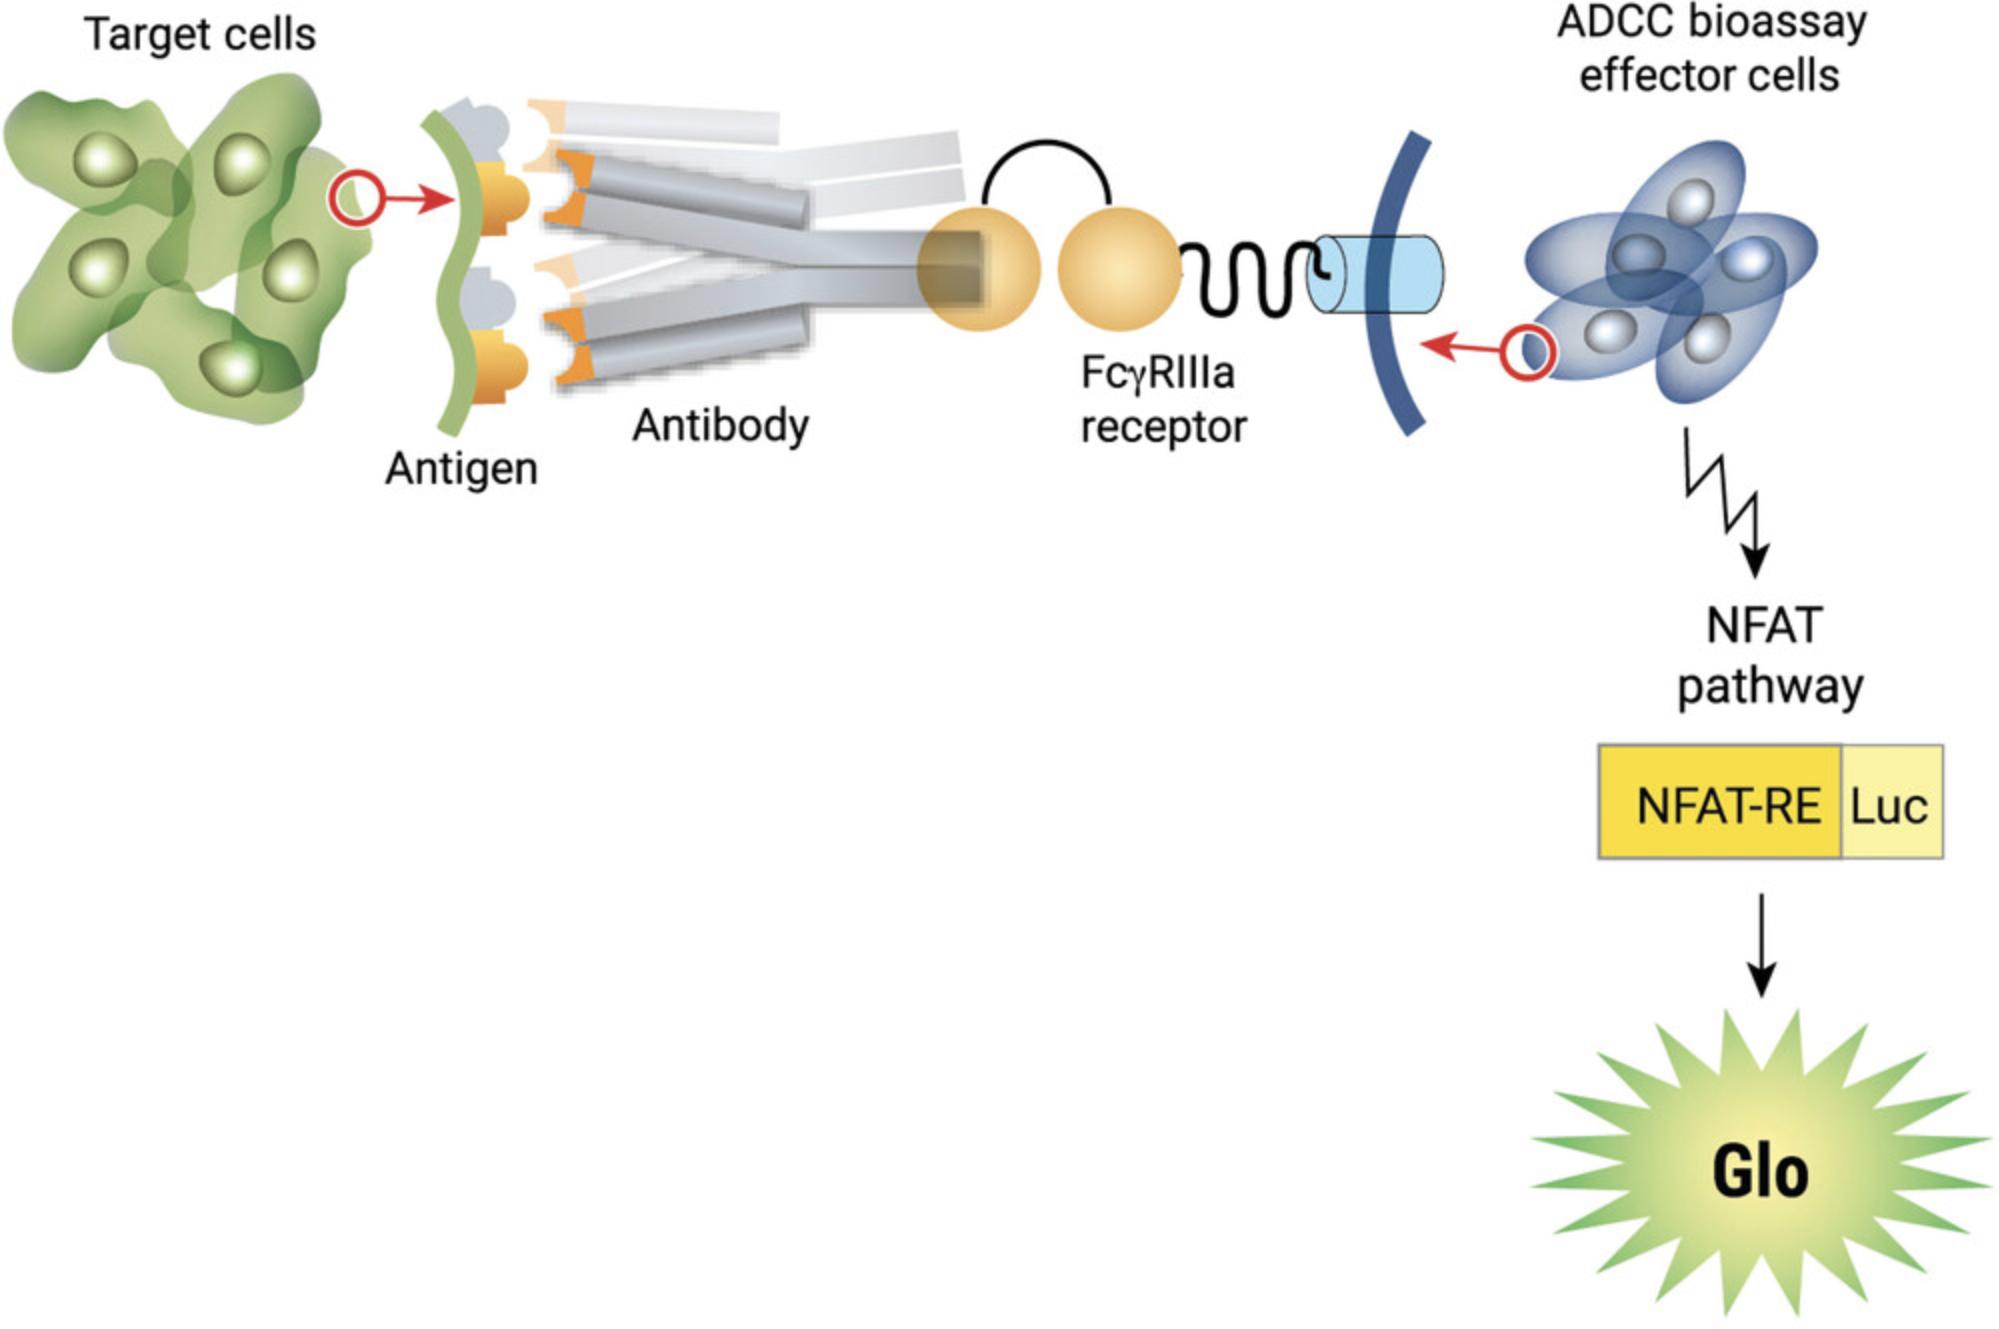
The antibody-induced luciferase activity in the effector cell is quantified with a luminescence readout which is specific to the antibody and antigen-expressing target cells. The assay can be used to evaluate the effects of antibody glycosylation on their ADCC activity in early drug development (Chung et al., 2014). In addition, it has the performance characteristics (precision, accuracy, and linearity) required for a potency assay for lot release and stability study (Parekh et al., 2012; Prior et al., 2017; Wege et al., 2020).
The assay offers a simple, add-mix-read assay format. It starts by combining the target cells, antibody, and ADCC bioassay effector cells in the assay plates; after a few of hours of incubation, add the luciferase detection reagent and monitor luminescence on a luminescent plate reader. Critical assay parameters, include the effector:target (E:T) ratio, cell numbers per well, the antibody dose range, assay buffer, and incubation times. These parameters may differ based on the specific antibody and target cell pair and should be evaluated rigorously.
Because the ADCC reporter bioassay produces a bioluminescent readout, the assay requires a sensitive luminescence plate reader for the detection of signal. With most luminescent plate readers we tested, an integration time of 0.5 s/well is appropriate and sufficient. The assay also requires the use of white, flat-bottom tissue-treated assay plates; clear-bottom or black-bottom assay plates do not work and should not be used.
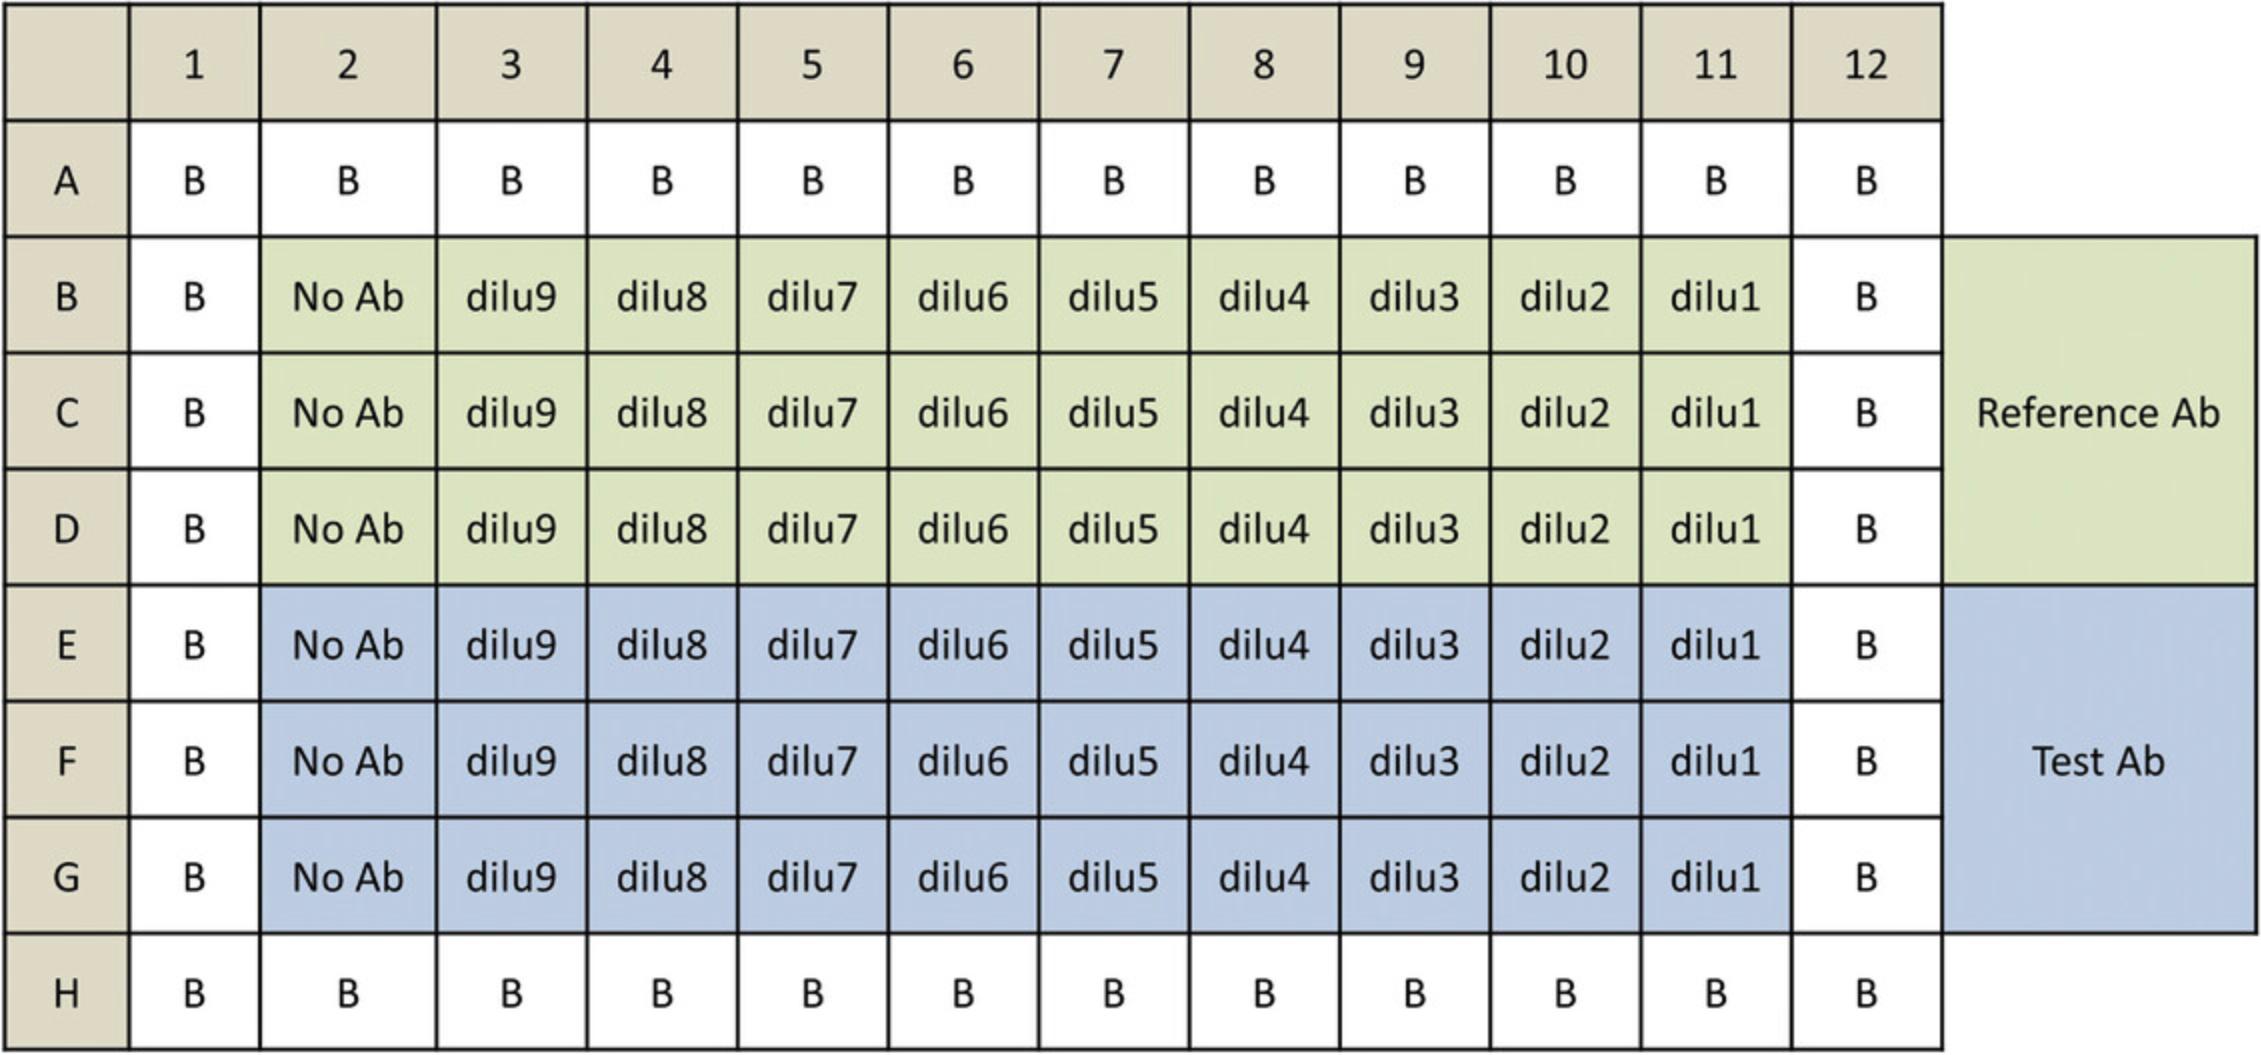
The procedure described here serves as an example protocol and is designed to test two antibody samples in a single assay run. Each test antibody and a reference antibody are run in triplicate in a ten-point dilution series in a single 96-well assay plate using the same target cells. Other protocols and plate layouts are possible. The protocol needs to be adjusted and optimized for the specific antibody and target cells.
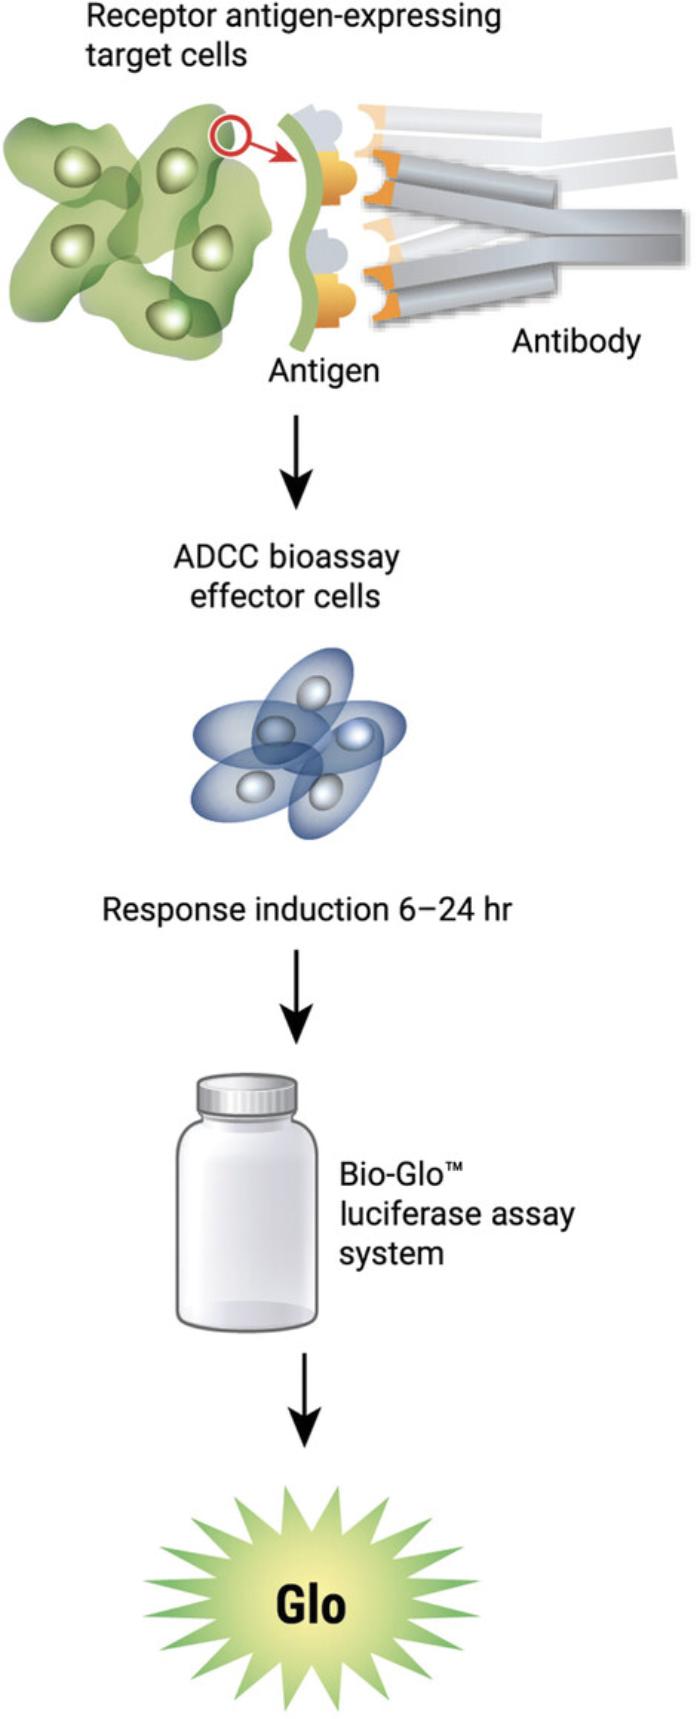
The general assay procedure is described in Figure 2. To set up the ADCC reporter bioassay, plate the target cells into the assay plates. Next, prepare serial titrations of the antibody and add to the assay plates, followed by the addition of the ADCC bioassay effector cells. An example plate layout is shown in Figure 3. After the addition of the assay components, transfer the assay plates to a CO2 incubator. After several hours of incubation, add the luciferase detection reagent to the assay plates and then read the plates on a luminescence plate reader. Induction time of 16-24 hr is a good start for the assay and has given optimal results for most antibodies tested.
Materials
- RPMI 1640 Medium (Corning, cat. no. 10-041-CV or Gibco, Thermo Fisher Scientific, cat. no. 22400)
- FBS (HyClone, cat. no. SH300070) or equivalent
- Super low IgG FBS (HyClone, cat. no. SH30898) or equivalent
- Dulbecco's phosphate-buffered saline (DPBS; Gibco, Thermo Fisher Scientific, cat. no. 14190) or equivalent
- Sodium pyruvate (Gibco, Thermo Fisher Scientific, cat. no. 11360) or equivalent
- MEM nonessential amino acids (Gibco, Thermo Fisher Scientific, cat. no. 11140) or equivalent
- Hygromycin (Gibco, Thermo Fisher Scientific, cat. no. 10687-010) or equivalent
- G-418 Sulfate Solution (Promega, cat. no. V8091) or equivalent
- Trypan Blue solution (MilliporeSigma, cat. no. T8154) or equivalent
- Accutase solution (MilliporeSigma, cat. no. A6964) or equivalent
- Bio-Glo™ Luciferase Assay System (Promega, cat. no. G7940 or G7941)
- Test monoclonal antibody or derivative with Fc effector function (defined by user)
- ADCC Reporter Bioassay, V Variant (Promega, cat. no. G7102, G7010, or G7018)
- ADCC Reporter Bioassay, F Variant (Promega, cat. no. G9302, G9790, or G9798)
- Target cells expressing target antigen recognized by mAb (defined by user)
- Sterile clear 96-well, V-bottom plate with lid (Linbro, cat. no. 76-223-05) or equivalent
- White, flat-bottom 96-well assay plates (Corning, cat. no. 3917) or equivalent
- Pipets (single channel and 12-channel)
- Sterile 15- and 50-ml conical tubes
- Sterile reagent reservoirs (Corning, cat. no. 4870) or equivalent
- 37°C, CO2 incubator
- Luminescence plate reader: GloMax®-Multi+ Detection System (Promega, cat. no.) or equivalent
Prepare ADCC assay buffer on the day of the assay
1.Thaw the low lgG FBS in a 37°C water bath and add to RPMI 1640 medium to make ADCC assay buffer (RPMI 1640/0.5% low IgG FBS). Mix well and warm to 37°C prior to use. As a reference, 50 ml ADCC assay buffer is enough for 120 wells in 96-well assay format.
Preparing and plating target cells
For suspension target cells
2a. On the day of assay, remove suspension target cells from the propagation flasks and transfer to a centrifuge tube.
3a. Count cells and evaluate cell viability using trypan blue staining.
4a. Harvest cells by centrifugation at 130-200 × g for 10 min.
5a. Aspirate medium, wash cell pellet with 10 ml DPBS, and centrifuge.
6a. Resuspend cells in ADCC assay buffer (prewarmed to 37°C) and adjust volume to generate the cell density based on the desired E:T ratio you need for bioassay.
7a. Transfer target cell suspension to a sterile reagent reservoir. Using a multichannel pipet, immediately add 25 μl of cells to the inner 60 wells of white 96-well assay plates.
8a. Dispense 75 μl ADCC assay buffer into outermost wells. Place lids on plates and leave on bench while preparing antibody dilutions and ADCC bioassay effector cells.
For adherent target cell lines
For adherent cells, all steps must be performed in a sterile cell culture hood the day before the assay.
2b. Twenty to twenty-four hours before the assay, dissociate adherent target cells from the propagation flasks with a gentle cell dissociation reagent such as Accutase.
3b. Add 10-20 ml fresh culture medium to target cells and transfer to a centrifuge tube.
4b. Count cells and evaluate cell viability using trypan blue staining.
5b. Harvest cells by centrifugation at 130-200 × g for 5-10 min.
6b. Resuspend cells in fresh culture medium and adjust volume to generate the cell density based on the desired E:T ratio you need for bioassay.
7b. Transfer cells to a sterile reagent reservoir and immediately add 100 μl of cells to the inner 60 wells of white 96-well assay plates using a multichannel pipet.
8b. Dispense 100 μl culture medium into the outermost wells. Place lids on the plates and incubate overnight in a CO2 incubator at 37°C.
9b. After overnight incubation, take the assay plates containing adherent target cells out of the CO2 incubator and transfer to the bench top. Remove 95 μl culture medium from each of the wells. Add 25 μl per well of ADCC assay buffer (prewarmed to 37°C) to the inner 60 wells of assay plates.
10b. Dispense 75 μl ADCC assay buffer into those outermost wells of the assay plates. Cover plates with lids and keep the plates on the bench top before adding antibody dilutions and ADCC bioassay effector cells.
Preparing antibody serial dilutions on the day of assay
To establish a full dose-response range for the test antibody in the ADCC reporter bioassay, it is important to determine the starting concentration and serial dilution scheme optimal for the antibody based on previous test results. As a reference, when tested in the ADCC reporter bioassay, the starting concentrations and serial dilution schemes are 1 × 10⁻⁶ g/ml, four-fold serial dilution for rituximab, and 1 × 10⁻⁶ g/ml, three-fold serial dilution for trastuzumab. These provide full dose-response curves in both cases.
11.In a clear V-bottom 96-well plate or 12-well dilution reservoir, prepare ten-point antibody serial dilutions in assay buffer for reference and test antibodies.
12.Prepare enough antibody to plate 25 μl per well, in triplicate, at each dose.
13.Hold antibody serial dilution preparation on the bench top until step 21.
Preparing ADCC bioassay effector cells
14.Prepare ADCC bioassay effector cells for use in the assay according to the manufacturer's recommendation (Table 1). Use cells in assay only after cell growth rate during propagation has stabilized and cell viability is >95%.
| Component | Final concentration |
|---|---|
| RPMI 1640 medium | 90% |
| FBS | 10% |
| Sodium pyruvate | 1 mM |
| MEM nonessential amino acids | 0.1 mM |
| Hygromycin | 100 μg/ml |
| G-418 | 250 μg/ml |
15.Transfer ADCC bioassay effector cells from the cell culture vessels to a centrifuge tube.
16.Count cells and determine cell density and viability using trypan blue staining.
17.Pellet cells by centrifuge at 130 × g for 10 min at ambient temperature; aspirate medium and resuspend cells with 10 ml of 1× DPBS.
18.Pool cells to one centrifuge tube if needed; centrifuge at 130 × g for 10 min.
19.Resuspend cells in ADCC assay buffer to make a final cell suspension at a density of 6 × 10⁶ cells/ml.
20.Hold the ADCC bioassay effector cells at room temperature until next step.
Adding antibody and ADCC bioassay effector cells to the assay plates containing target cells
21.Using a multichannel pipet, add 25 μl per well of the antibody dilution series from the antibody dilution plates to the white, 96-well assay plates already containing target cells.
22.Transfer the ADCC bioassay effector cells to a sterile reagent reservoir. Using a multichannel pipet, plate 25 μl of ADCC bioassay effector cells to those wells in the assay plate already containing target cells and antibody to yield 150,000 ADCC bioassay effector cells per well.
23.Cover assay plate with a lid and incubate plate in a 37°C, CO2 tissue culture incubator for 16-24 hr.
Preparing and adding Bio-Glo™ luciferase assay reagent
24.Prepare an appropriate amount of Bio-Glo™ luciferase assay reagent according to the manufacturer's instructions. It can be prepared on the day of assay for same day use or prepared and frozen in aliquots for future use. Thaw Bio-Glo™ luciferase assay buffer in a room-temperature water bath, protected from light. Once thawed, transfer buffer into the amber bottle containing the substrate, and mix by gentle inversion until the substrate is thoroughly dissolved. For reference, 10 ml of Bio-Glo™ luciferase assay reagent is enough for 120 assay wells in a 96-well assay format.
25.After 16-24 hr incubation, remove assay plates from the 37°C incubator and equilibrate to ambient temperature (22°-25°C) on the bench for 5-15 min.
26.Using a manual multichannel pipet, add 75 μl Bio-Glo™ luciferase assay reagent to all the inner 60 wells of the assay plates; avoid creating any bubbles.
27.Add 75 μl of Bio-Glo™ luciferase assay reagent to wells B1, C1, and D1 in the assay plate to determine plate background.
28.Incubate at ambient temperature for 5-30 min.
29.Read assay plates and measure luminescence on a luminescence plate reader.
Data analysis
30.Calculate Fold of Induction = RLUinduced – background/RLUno antibody control – background
Where RLU is defined as relative luminescence unit.
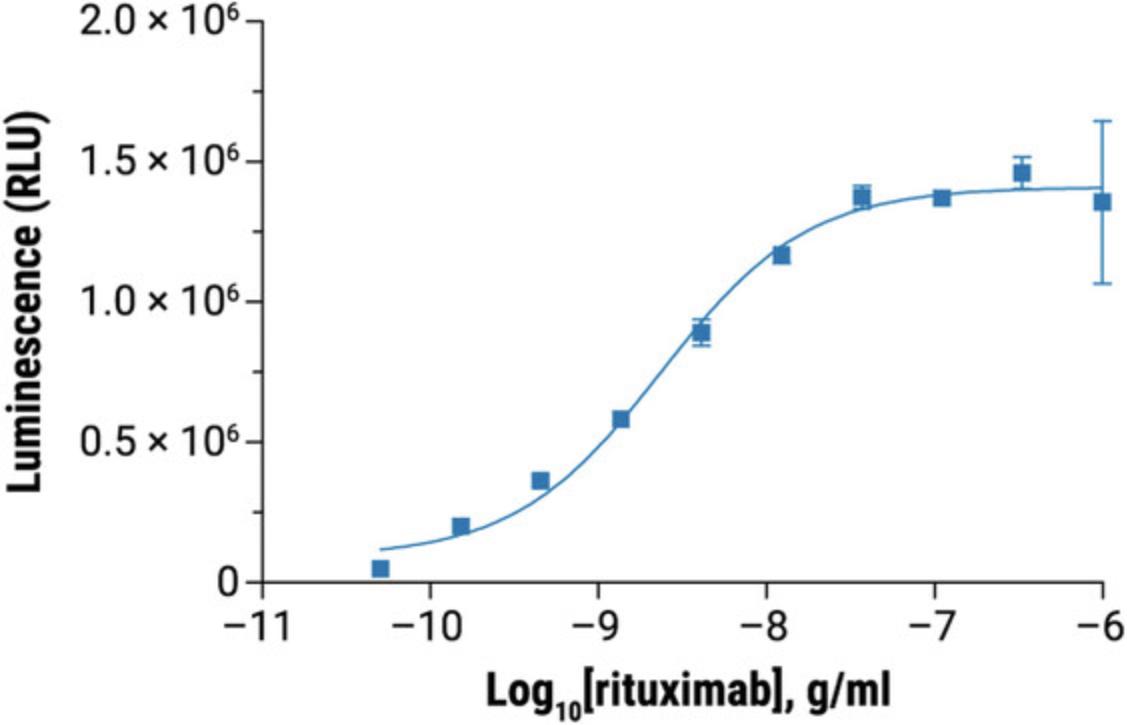
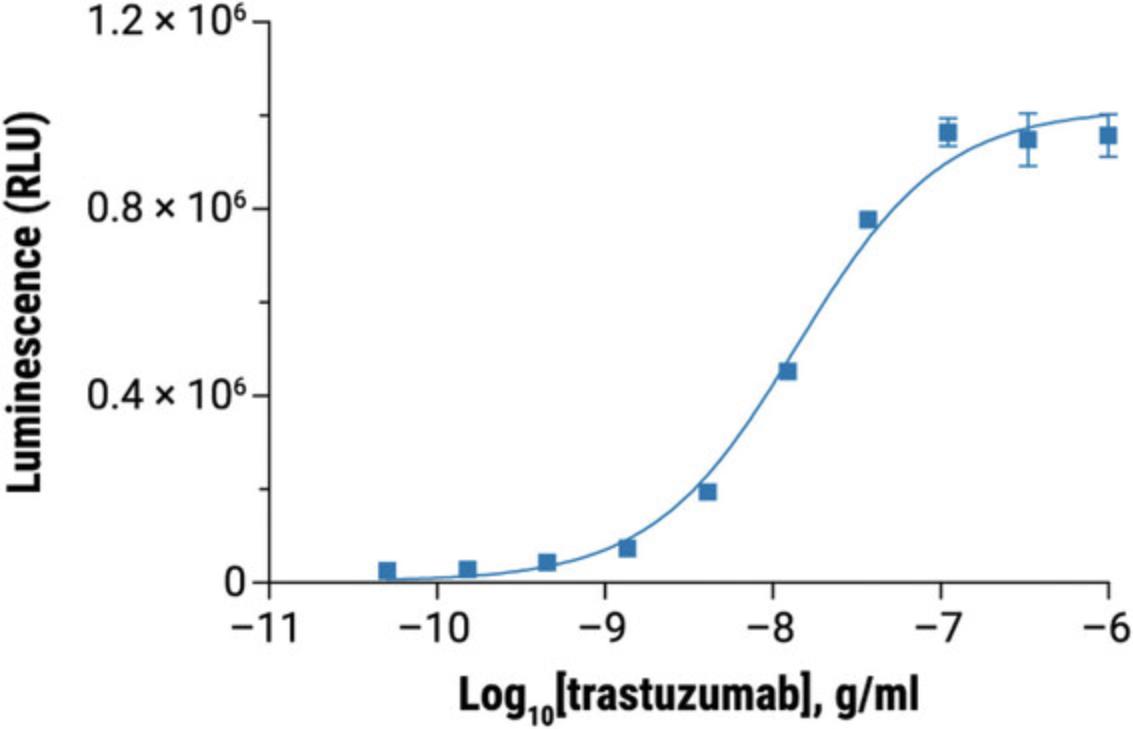
31.Graph data as RLU versus log10 [antibody] and Fold of Induction versus log10 [antibody]. Fit curves and determine EC50 of antibody response using appropriate curve fitting software (such as GraphPad Prism® software).
32.The representative data are shown in Figure 4 and Figure 5.
Basic Protocol 2: PBMC ADCC BIOASSAY USING PRIMARY PBMC AND ENGINEERED HiBiT TARGET CELLS
The PBMC ADCC bioassay is a bioluminescent assay for quantitatively measuring the ADCC activity of monoclonal antibodies. The assay uses primary PBMC as effector cells and engineered target cells expressing HiBiT (Pinto et al., 2021). HiBiT is an 11-amino-acid peptide tag and has high binding affinity to Large BiT (LgBiT) to form functional NanoBiT luciferase and it can be fused to a house-keeping protein or a small peptide (Dixon et al., 2016). When ADCC occurs, the HiBiT expressed in the target cells is released into the medium after target cell lysis. HiBiT then binds to LgBiT in the detection reagent to form a functional NanoBiT luciferase enzyme and emits luminescence in the presence of the substrate furimazine (Fig. 6).
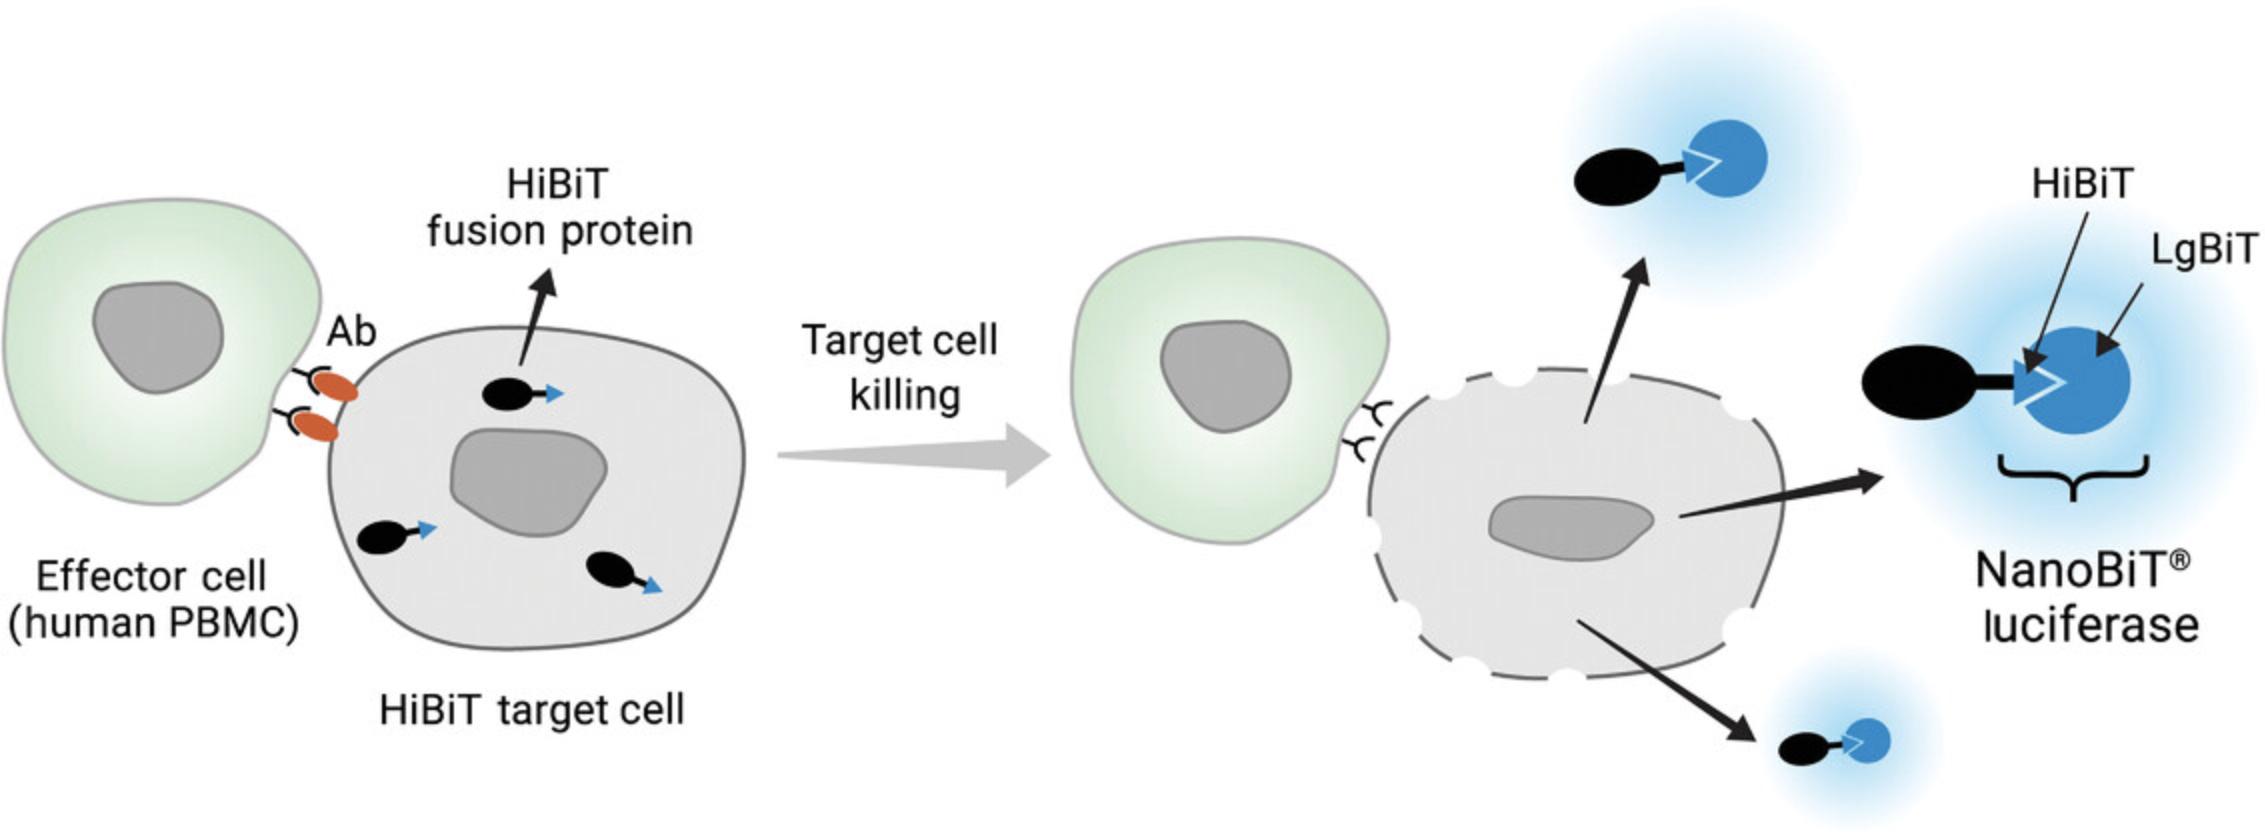
The bioassay combines the primary PBMC, antibody, and HiBiT target cells in the assay plates and offers a simple, add-mix-read assay format. The critical assay parameters include the E:T ratio, cell numbers per well for both target and effector cells, the antibody dose range, assay buffer, and incubation time. They should be evaluated rigorously and final conditions should be selected based on assay performance for the specific antibody and target cell pair.
The bioassay requires a sensitive luminescence plate reader for the detection of the luminescence signal. With most luminescent plate readers we tested, an integration time of 0.5 s/well is appropriate and sufficient. The bioassay also requires the use of white, U-bottom or V-bottom assay plates.
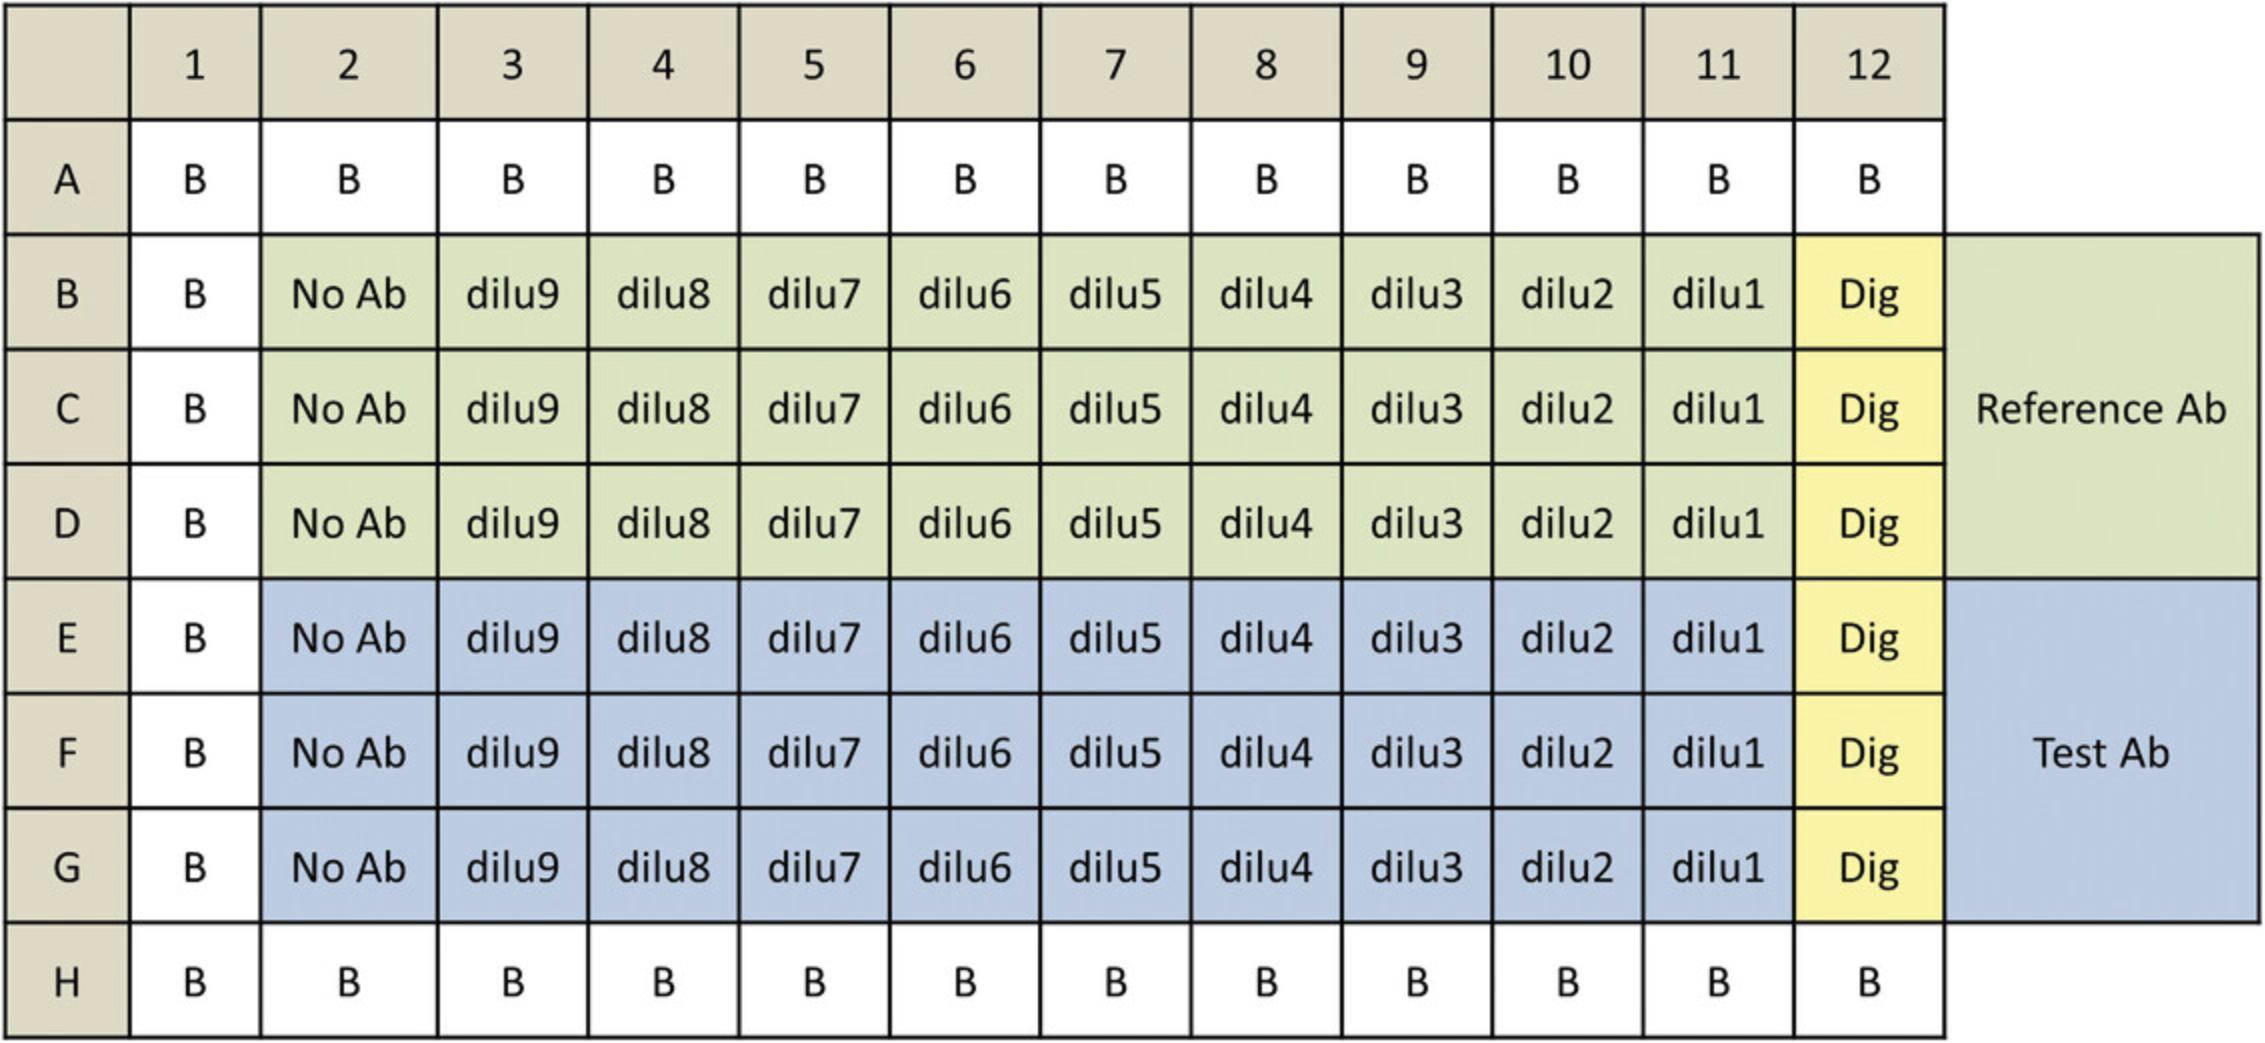
The protocol provided below shows how the PBMC, ADCC qualified, can be used with suspension or adherent HiBiT target cells in the PBMC ADCC bioassay. The procedure serves as an example protocol and is designed to test two antibody samples in a single assay run. Each test antibody and a reference antibody are run in triplicate in ten-point dilution series in a 96-well assay plate using the same target cells. Other protocols and plate layouts are possible and may need to be optimized for the specific antibody and target cells of your interests.
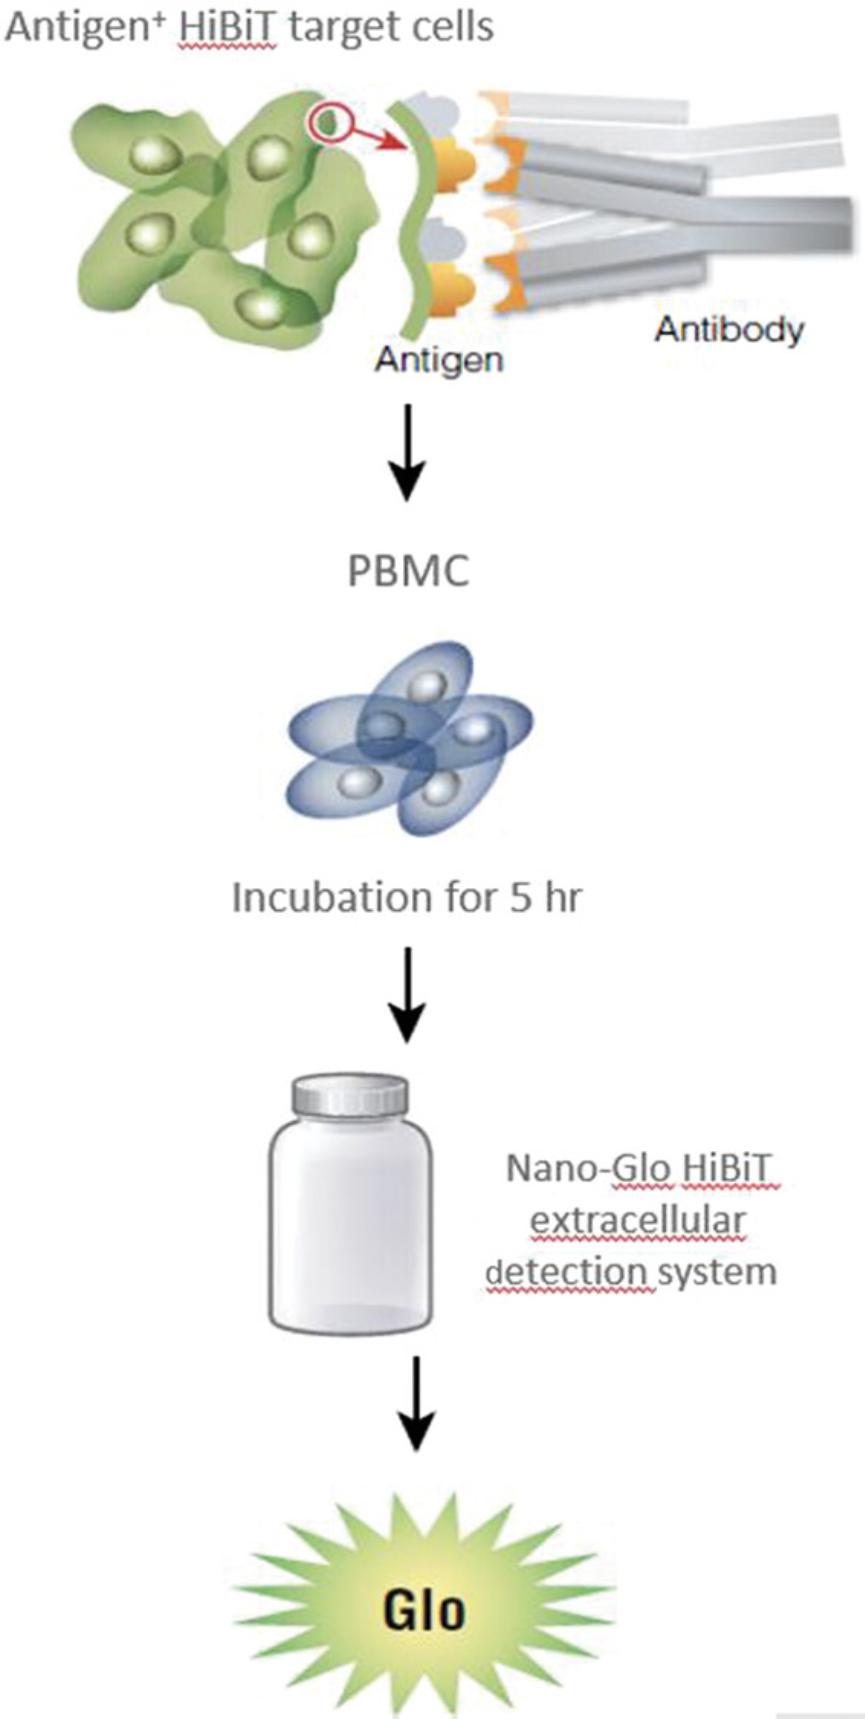
The general assay procedure is described in Figure 7.The PBMC, ADCC qualified, are supplied in a frozen, ready-to-use format. When they are used in the assay, we recommend plating them in PBMC recovery medium overnight before using them in the assay as described in the current protocol. Alternatively, fresh PBMC isolated from donor blood can be used and plated into assay plates on the day of assay. To set up the PBMC ADCC bioassay, plate the target cells into the assay plates first. Next, add the serial titration of the antibody to the assay plates followed by the addition of the primary PBMC. An example plate layout is shown in Figure 8.Once the assay plates are set up, transfer the assay plates to a CO2 incubator. After several hours of incubation, add Nano-Glo™ HiBiT extracellular detection reagent to the assay plates and read plates in a luminescence plate reader. Induction time of 4 to 5 hr is a good start for the assay and has given optimal results for most antibodies tested. You can vary the induction time in a range of 4 to 24 hr to determine the optimal induction time for your antibody.
Materials
- PBMC recovery medium (see Table 2)
- RPMI 1640 Medium (Corning, cat. no. 10-041-CV or Gibco, Thermo Fisher Scientific, cat. no. 22400)
- Heat-inactivated FBS (Gibco, Thermo Fisher Scientific, cat. no. 16140) or equivalent
- Trypan Blue solution (MilliporeSigma, cat. no. T8154) or equivalent
- Accutase solution (MilliporeSigma, cat. no. A6964) or equivalent
- Sodium pyruvate (Gibco, Thermo Fisher Scientific, cat. no. 11360) or equivalent
- 2-Mercaptoethanol, 1,000× (Gibco, Thermo Fisher Scientific, cat. no. 21985)
- IL-2 (MilliporeSigma, cat. no. I2644)
- Digitonin (MilliporeSigma, cat. no. D141)
- Nano-Glo HiBiT Extracellular Detection System (Promega, cat. no. N2420; N2421; N2422)
- Monoclonal antibody or derivative with Fc effector function
- Human PBMC, ADCC qualified (Promega, cat. no. CS3055A15, CS3055A18)
- User-defined target cells expressing target antigen and HiBiT
| Component | Final concentration |
|---|---|
| RPMI 1640 medium | 90% |
| Heat-inactivated FBS | 10% |
| Sodium pyruvate (100×) | 1× |
| 2-Mercaptoethanol (1,000×) 55 mM | 1× |
| IL-2 (100 μg/ml) | 5 ng/ml |
- White, U-bottom, 96-well plates (Costar, cat. no. 3355)
- Clear, 96-well plate lids (Costar, cat. no. 3098)
- Clear, V-bottom 96-well plates (Costar, cat. no. 3896) for low volume antibody dilution (100-300 µl)
- Dilution reservoirs with lid (Dilux, cat. no. D-1002) for high volume antibody dilution (300 µl-5 ml)
- 56°C water bath (to heat-inactivate FBS if starting with non-heat inactivated FBS)
- Pipets (single channel and 12-channel)
- Sterile 15- and 50-ml conical tubes
- 37°C, CO2 incubator
- 37°C water bath
- Luminescence plate reader (GloMax®-Multi+ Detection System; Promega) or equivalent
The day prior to the assay, prepare human PBMC, ADCC qualified, in a cell culture hood.
1.Prepare PBMC recovery medium according to Table 2 and prewarm to 37°C; 25 ml PBMC recovery medium is sufficient for one vial of human PBMC, ADCC qualified.
2.Transfer one vial of PBMC from storage at –140°C to the bench on dry ice. Thaw the vial in a 37°C water bath with gentle agitation (no inversion) until just thawed (2-3 min).
3.Gently mix cell suspension by pipetting and transfer all cells (∼1 ml) to a 50-ml conical tube containing 25 ml prewarmed PBMC recovery medium.
4.Using a 25-ml pipet, gently mix cell suspension and transfer it to a T75 tissue culture flask.
5.Place the flask horizontally in a 37°C, 5% CO2 humidified incubator.
6.Incubate PBMC cells for 16-24 hr until assay setup on Day 2.
On the day of assay
7.On the day of assay, prepare the appropriate amount of assay buffer according to Table 3; 75 ml assay buffer is sufficient for two assay plates in 96-well format.
| Component | Final concentration |
|---|---|
| RPMI 1640 medium | 95% |
| Heat-inactivated FBS | 5% |
| 2-Mercaptoethanol (1,000×) 55 mM | 1× |
| IL-2 (100 μg/ml) | 5 ng/ml |
8.Prepare digitonin for maximum release control:
-
Dilute digitonin stock in assay buffer to 300 μg/ml (3× concentration).
-
Prepare 100 μl for each antibody to be tested.
-
Hold the digitonin dilution preparation at room temperature.
Preparing antibody serial dilutions
In order to establish a full dose-response range for the test antibody in the PBMC ADCC assay, it is important to determine the starting concentration and serial dilution scheme optimal for the antibody based on previous test results. As a reference, when tested in the PBMC ADCC assay, the starting concentrations and serial dilution schemes are 1 × 10⁻⁶ g/ml, three-fold serial dilution for rituximab and cetuximab. These provide full dose-response curves in both cases.
9.In a clear V-bottom 96-well plate or 12-well dilution reservoir, prepare antibody serial dilutions in assay buffer for reference and test antibodies.
10.Prepare enough antibody to plate 25 μl per well at each dose.
11.Hold the antibody serial dilution preparation in a 37°C, 5% CO2 humidified incubator until step 27.
Preparing target cells
For suspension HiBiT target cells
12a. On the day of assay, remove suspension HiBiT target cells from the propagation flasks and transfer to a centrifuge tube.
13a. Count cells and evaluate cell viability using trypan blue staining.
14a. Harvest target cells by centrifugation at 150-200 × g for 5 min.
15a. Remove medium and resuspend cells in 10 ml prewarmed assay buffer.
16a. Harvest cells by centrifugation at 150-200 × g for 5-10 min.
17a. Repeat step 15a and 16a for a second wash: Remove supernatant and resuspend cells in 10 ml prewarmed assay buffer; harvest cells by centrifugation at 150-200 × g for 5-10 min.
18a. Remove medium and resuspend cells in prewarmed assay buffer to make a cell suspension of 2 × 10⁵ cells/ml.
19a. Hold HiBiT target cell suspension at 37°C.
For adherent HiBiT target cell lines
12b. On the day of assay, dissociate adherent HiBiT target cells from the propagation flasks using a gentle cell dissociation reagent such as Accutase.
13b. Resuspend cells in 10 ml prewarmed assay buffer.
14b. Count cells and evaluate cell viability using trypan blue staining.
15b. Harvest target cells by centrifugation at 150-200 × g for 5 min.
16b. Remove medium and resuspend cells in 10 ml prewarmed assay buffer.
17b. Harvest target cells by centrifugation at 150-200 × g for 5 min.
18b. Repeat step 16b and 17b for second wash: Remove supernatant and resuspend cells in 10 ml prewarmed assay buffer; harvest target cells by centrifugation at 150-200 × g for 5 min.
19b. Remove supernatant and resuspend cells in prewarmed assay buffer to make a cell suspension of 1 × 10⁵ cells/ml.
20b. Hold HiBiT target cell suspension at 37°C.
Preparing human PBMC, ADCC qualified
21.Remove PBMC from the CO2 incubator, gently resuspend cells, and transfer all cells (∼25 ml) to a 50-ml conical tube.
22.Harvest PBMC by centrifugation at 300 × g for 5 min at room temperature.
23.Remove supernatant and resuspend PBMC in 4 ml assay buffer.
24.Proceed to assay plate setup: Add HiBiT target cells, antibody, and PBMC into assay plates.
25.Gently mix HiBiT target cell suspension and transfer to a sterile reagent reservoir.
26.Using a multichannel pipet, dispense 25 μl per well to all assay wells.
27.Using a multichannel pipet, dispense 25 µl per well of antibody dilutions to the inner 60 assay wells only.
28.Gently mix PBMC cell suspension and transfer to a sterile reagent reservoir.
29.Using a multichannel pipet, dispense 25 μl per well to all assay wells.
30.Using a single channel pipet, add 25 µl per well of 3× digitonin to digitonin wells only.
31.Using a multichannel pipet, add 75 μl per well of prewarmed assay buffer to the rest of empty wells.
32.Cover assay plates with lids and incubate in a 37°C, 5% CO2 humidified incubator for 5 hr.
Add Nano-Glo™ HiBiT extracellular detection reagent
1.Store Nano-Glo™ HiBiT extracellular buffer at -20°C; thaw overnight at 4°C and warm to room temperature during assay period. Store Nano-Glo™ HiBiT extracellular substrate and LgBiT protein at -20°C. 2.Prepare Nano-Glo™ HiBiT extracellular reagent ∼30 min before the end of assay incubation; prepare enough reagent for the assay of the day based on the guidelines in Table 4, then return all remaining components to their appropriate storage temperatures. 3.The reconstituted Nano-Glo™ HiBiT Extracellular Reagent (mixture of buffer, substrate, and LgBiT protein) should be stored at room temperature prior to the addition to the assay plate. Do not freeze/thaw.
| Number of assay plates run in the same day | Nano-Glo™ HiBiT extracellular buffer | LgBiT™ protein | Nano-Glo™ HiBiT extracellular substrate |
|---|---|---|---|
| 1 plate (66 wells) | 1 bottle | 0.1 ml | 0.2 ml |
| 2 plates (132 wells) | 1 bottle | 0.1 ml | 0.2 ml |
| 3 plates (198 wells) | 2 bottles | 0.2 ml | 0.4 ml |
| 4 plates (264 wells) | 2 bottles | 0.2 ml | 0.4 ml |
33.Near the end of the 5-hr incubation, prepare Nano-Glo™ HiBiT Extracellular Reagent. For reference, one kit of Nano-Glo™ HiBiT extracellular reagent (10 ml, cat. no. N2420) is sufficient for 132 assay wells.
-
Add 0.1 ml LgBiT protein and 0.2 ml Nano-Glo™ HiBiT extracellular substrate to one bottle of Nano-Glo™ HiBiT extracellular buffer (∼10-11 ml).
-
Mix by inverting several times.
-
Store the Nano-Glo™ HiBiT extracellular reagent at room temperature protected from bright light for same day use.
34.After 5 hr of incubation, remove assay plates from the CO2 incubator and allow plates to equilibrate to room temperature for 5-15 min on the bench.
35.Transfer Nano-Glo™ HiBiT extracellular reagent to a reagent reservoir.
36.Using a multichannel pipet, add 70 µl per well of Nano-Glo™ HiBiT reagent to assay wells B2-G12.
37.Incubate plates at room temperature for 5-10 min, protected from bright light.
38.Read plate and measure luminescence in a luminescence plate reader.
Data analysis
39.The spontaneous release values (untreated control) are generated from the wells containing PBMC and HiBiT target cells only, no antibody; the maximum release values are generated from the wells containing PBMC, HiBiT target cells, and digitonin.
40.Calculate Fold Induction = RLUtreated/RLUuntreated control.
41.Calculate % Specific Lysis = [(RLUtreated – RLUuntreated control)/(RLUdigitonin – RLUuntreated control)] × 100.
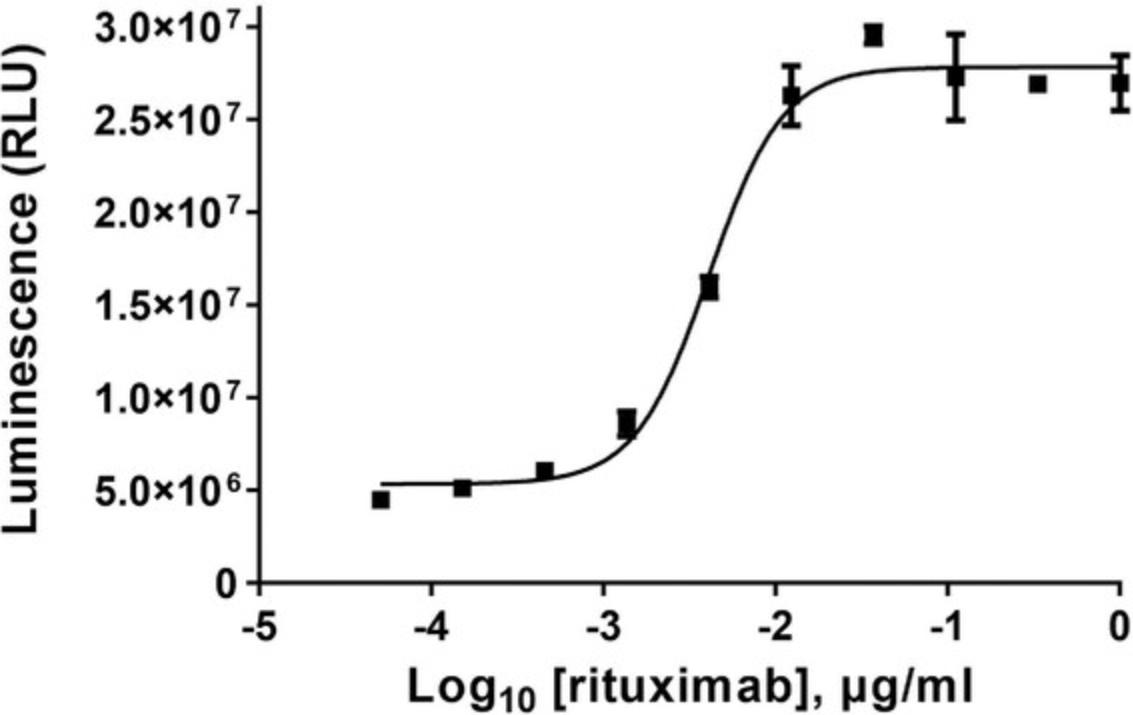
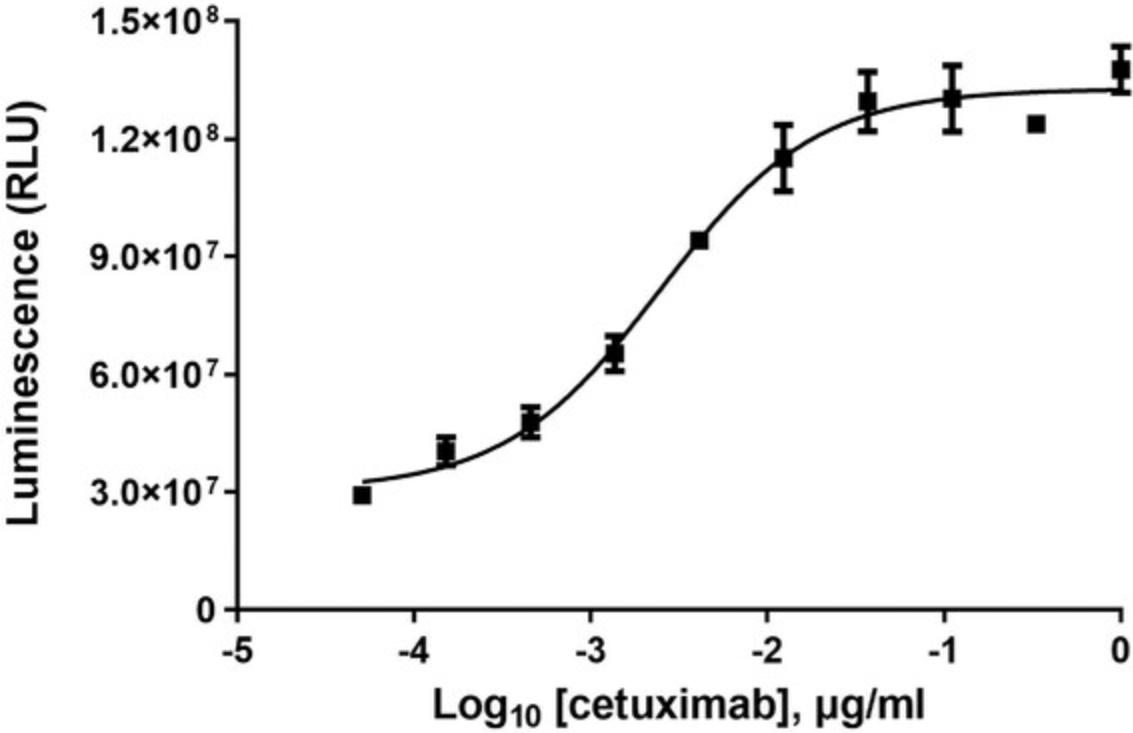
42.Graph data as RLU versus log10 [antibody], Fold of Induction versus log10 [antibody], and % Specific Lysis versus log10 [antibody]. Fit curves and determine EC50 of antibody response using appropriate curve fitting software (such as GraphPad Prism® software).
43.The representative data is shown in Figure 9 and Figure 10.
COMMENTARY
Background Information
Classic antibody-dependent cellular cytotoxicity (ADCC) assays measure the antibody-mediated target cell lysis by primary NK cells and share two major challenges. First, the need for primary immune cells isolated from fresh donor blood as effector cells has made the assays labor intensive and vulnerable to high assay variability (Cerottini, & Chapuis, 1968; Patel, & Boyd, 1995; Roden, Lee, Panelli, & Marincola, 1999; von Zons et al., 1997; Brunner, Mauel). Alternatively, NK cell lines are used to replace primary cells as effector cells although they are often difficult to handle and very challenging for full adoption due to the genetic instability of Fc receptors and intellectual property (IP) restrictions (Binyamin et al., 2008; Gong, Maki, & Klingemann, 1994; Robertson et al., 1996; Schnueriger et al., 2011). Secondly, the target cell lysis is either measured using target cells pre-loaded with various reagents [e.g., radioactive chromium (51Cr), the lanthanide europium, or a fluorescent dye such as calcein-AM] which are tedious to use and often have high spontaneous release, or by direct measurement of target cell cytotoxicity through enzyme release [e.g., lactate dehydrogenase (LDH), glyceraldehyde 3-phosphate dehydrogenase (GAPDH)] in target cells which spontaneously measures the cytotoxicity from effector cells and often complicates the data interpretation (Korzeniewski, & Callewaert, 1983; Sergeeva et al., 2011; Stewart et al., 2011).
The ADCC reporter bioassay in Basic Protocol 1 uses engineered ADCC reporter effector cells to replace the primary PBMC to overcome the assay variation from primary effector cells. It reflects the ADCC mechanism of action for a monoclonal antibody and demonstrates assay specificity. The assay demonstrates precision, accuracy, linearity, and robustness, and is suitable for product release and stability study in a quality-controlled environment. The PBMC ADCC bioassay in Basic Protocol 2 uses engineered HiBiT target cells and specially measures target cell lysis by primary PBMC. It is simple to use, has low spontaneous release, and an improved assay window. It can be used to quantitatively measure antibody potency for antibody research and characterization study.
Critical Parameters
Cell handling
For each cell line used in the assay, the cell passing schedule and cell seeding density should be optimized to ensure stable cell growth rate and maximum cell viability during cell culture. They are critical to ensure reproducible assay performance. Change of culture volumes, seeding densities, and passing schedules may affect cell growth rate and the performance of the cells in the assay.
Selection of target cells
For both ADCC reporter bioassay and PBMC ADCC assay, the appropriate target cells need to be screened and selected for best assay performance. First, they should express the antigen protein which can be specifically recognized by the test antibody used in the assay. Second, choose the target cells which have high expression level of the antigen. In general, the higher the antigen expression level is, the higher the assay window that can be obtained. However, there is not any quantitative criteria as to how many antigen molecules on the cell surface of the target cells are sufficient in order to see ADCC activity. Lastly, it is reported that binding of a high concentration of the antibody along with FcγRIIb on target cells can induce the internalization of the antigen protein and therefore decrease the level of antigen on the cell surface. In some cases, it can cause a hook effect while the assay signal decreases with high concentration of the antibody. While more research is needed to explore other cell surface markers which might affect target cells performance, we recommend screening several relevant target cell lines and selecting the target cells which provide optimal assay performance. Alternatively, if the antigen-expressing target cells are not available, antigen-coated beads or antigen-coated plates may be used to replace the target cells in the ADCC reporter bioassay. The assay conditions need to be optimized to obtain reasonable results.
Effector:target (E:T) ratio
For each target cell and antibody pair, the E:T ratio needs to be optimized. For the ADCC reporter bioassay in Basic Protocol 1, try E:T ratios in the range of 1:1 to 25:1 by keeping the cell number of the ADCC bioassay effector cells constant at 150,000 cells per well and vary the cell number of target cells per well. In general, increasing the cell number of target cells in the ADCC reporter bioassay can improve the assay window with minimal impact on the measured potency for the antibody. For PBMC ADCC assay in Basic Protocol 2, try E:T ratios in the range of 20:1 to 50:1 by keeping the cell number of the target cells constant (2,500 or 5,000 cells) per well, and vary the cell number of PBMC per well. In general, increasing the cell number for PBMC in the PBMC ADCC assay can improve the assay window with minimal impact on the measured potency for the antibody.
Assay plate
For the ADCC reporter bioassay in Basic Protocol 1, we recommend white, flat-bottom 96-well assay plates (Corning cat. no. 3917 or equivalent); for the PBMC ADCC assay in Basic Protocol 2, we recommend white, U-bottom 96-well assay plates (Costar, cat. no. 3355 or equivalent). If white, U-bottom 96-well assay plates are not available, we recommend setting up the assay and incubating the antibody, target cells, and PBMC in clear, U-bottom 96-well assay plates. After 5 hr of incubation, transfer an equal amount of the supernatant from each well to white, flat bottom 96-well assay plates and add the detection reagent before reading the plates.
Luminescence detection
After adding the luciferase detection reagent to the assay plates, let the plates equilibrate on the bench top and wait at least 5 to 10 min before reading the plates in a luminescence plate reader. The light outputs which are indicated by the relative luminescence units (RLUs) would decrease gradually with a longer waiting time between reagent addition and plate reading. We do not recommend a waiting time of >30 min. Second, both ADCC assays are compatible with any laboratory standard luminescence plate readers. An integration time of 0.5 second/well is sufficient. When using a luminometer/plate reader, which has the option of gain adjustment for luminescence, select the highest gain setting. The RLUs may vary due to the sensitivity and settings of each instrument. However, the use of different instruments should not affect the assay window and measured potency for test antibodies.
Troubleshooting
See Table 5 for common problems encountered and suggested solutions when performing these protocols.
| Problem | Possible cause | Solution |
|---|---|---|
| Low luminescence readout | Poor cell condition or viability | Follow standard cell growth condition |
| Low activity of detection reagent | Store and handle the detection reagent appropriately | |
| Low sensitivity plate reader | Use sensitive plate reader and use correct setting of the reader | |
| Low ADCC response | E:T ratio is not optimal | Test a range of E:T ratios and identify the optimal E:T ratio |
| The range of antibody concentrations is not optimal | Optimize the antibody starting concentration and dilution scheme to achieve full sigmoidal curve | |
| Antigen expression level is low on target cells | Use target cells expressing medium and high level of antigen | |
| Matrix effect from IgG or human serum | Purify the antibody from serum samples or dilute the serum samples to minimize the matrix effect |
Understanding Results
After data acquisition from a luminescence plate reader, the luminescence signals are expressed as RLUs. The data can be analyzed using a standard curve fitting software, e.g., GraphPad Prism® software or equivalent software.
- Fit RLUs versus log10 [antibody] to generate four parameter logistic (4PL) curves including all the data points from each antibody titration and a no antibody control. The raw RLUs from the test wells (including both effector and target cells) should show basal luciferase activity and are typically greater than ten fold higher than the RLUs from the wells containing assay buffer only. The resulted 4PL curves should include a valid upper and lower asymptote and two to three data points on the slope.
- Calculate Fold of Induction based on the formula provided in the main text of the protocol and fit the Fold of Induction versus log10 [antibody] to generate 4PL curves. In general, the maximum fold of induction, typically induced by the highest antibody concentration, should be greater than three fold. It is possible for the maximum fold of induction to be lower than three fold, due to low/no ADCC activity of the antibody or less optimal assay conditions where assay optimization is required.
- In the case of the PBMC ADCC bioassay, calculate the percent specific lysis based on the formula provided in the main text of the protocol and fit the percent specific lysis versus log10 [antibody] to generate 4PL curves. In general, the spontaneous release should be <30% of the maximum release.
- The EC50 obtained from both ADCC protocols can be compared with what has been reported in the literature for the same antibody and same target cells using other ADCC analytical methods. Typically, they are similar and in most of the cases could be different within one log unit.
The representative data can be found in Figure 4 and Figure 5 for Basic Protocol 1, and in Figure 9 and Figure 10 for Basic Protocol 2.
Time Considerations
In Basic Protocol 1, preparing target cells, antibody serial dilution and ADCC bioassay effector cells, and assay setup takes 1 to 2 hr; preparing the Bio-Glo reagent, adding to the assay plates, and reading the plates takes 0.5 to 1 hr.
In Basic Protocol 2, the recovery of human PBMC, ADCC-qualified, takes 20 to 24 hr; preparing target cells, antibody serial dilution, PBMC, and assay setup takes 1 to 2.5 hr; preparing the Nano-Glo™ HiBiT Extracellular Reagent, adding to assay plates, and reading the plates takes 0.5 to 1 hr.
Acknowledgments
The authors would like to thank BioIVT for providing PBMC lots for screening in PBMC ADCC assay, and Gopal Krishnan and Vanessa Ott for critical review and comments on the manuscript.
Author Contributions
Denise Garvin : Data curation, methodology, writing review and editing; Pete Stecha : Data curation, methodology, writing review and editing; Julia Gilden : Data curation; Jun Wang : Data curation; Jamison Grailer : Data curation; Jim Hartnett : Data curation; Frank Fan : Conceptualization, resources, supervision; Mei Cong : Conceptualization, resources, supervision; Zhijie Jey Cheng : Conceptualization, data curation, methodology, supervision, writing original draft, writing review and editing.
Conflict of Interest
The authors declare no conflict of interest.
Open Research
Data Availability Statement
Data sharing not applicable – no new data generated.
Literature Cited
- Azzoni, L., Kamoun, M., Salcedo, T. W., Kanakaraj, P., & Perussia, B. (1992). Stimulation of Fc gamma RIIIA results in phospholipase C-gamma 1 tyrosine phosphorylation and p56lck activation. Journal of Experimental Medicine , 176, 1745–1750. doi: 10.1084/jem.176.6.1745.
- Binyamin, L., Alpaugh, R. K., Hughes, T. L., Lutz, C. T., Campbell, K. S., & Weiner, L. M. (2008). Blocking NK cell inhibitory self-recognition promotes antibody-dependent cellular cytotoxicity in a model of anti-lymphoma therapy. Journal of Immunology , 180, 6392–6401. doi: 10.4049/jimmunol.180.9.6392.
- Brunner, K. T., Mauel, J., Cerottini, J. C., & Chapuis, B. (1968). Quantitative assay of the lytic action of immune lymphoid cells on 51-Cr-labelled allogeneic target cells in vitro; inhibition by isoantibody and by drugs. Immunology , 14, 181–196.
- Carter, P., Presta, L., Gorman, C. M., Ridgway, J. B., Henner, D., Wong, W. L., … Shepard, H. M. (1992). Humanization of an anti-p185HER2 antibody for human cancer therapy. Proceedings of the National Academy of Sciences of the United States of America , 89, 4285–4289. doi: 10.1073/pnas.89.10.4285.
- Chan, A. C., & Carter, P. J. (2010). Therapeutic antibodies for autoimmunity and inflammation. Nature Reviews Immunology , 10, 301–316. doi: 10.1038/nri2761.
- Cheng, Z. J., Garvin, D., Paguio, A., Moravec, R., Engel, L., Fan, F., & Surowy, T. (2014). Development of a robust reporter-based ADCC assay with frozen, thaw-and-use cells to measure Fc effector function of therapeutic antibodies. Journal of Immunological Methods , 414, 69–81. doi: 10.1016/j.jim.2014.07.010.
- Chung, S., Lin, Y. L., Reed, C., Ng, C., Cheng, Z. J., Malavasi, F., … Song, A. (2014). Characterization of in vitro antibody-dependent cell-mediated cytotoxicity activity of therapeutic antibodies—Impact of effector cells. Journal of Immunological Methods , 407, 63–75. doi: 10.1016/j.jim.2014.03.021.
- Dall'Ozzo, S., Tartas, S., Paintaud, G., Cartron, G., Colombat, P., Bardos, P., … Thibault, G. (2004). Rituximab-dependent cytotoxicity by natural killer cells: Influence of FCGR3A polymorphism on the concentration-effect relationship. Cancer Research , 64, 4664–4669. doi: 10.1158/0008-5472.CAN-03-2862.
- Dixon, A. S., Schwinn, M. K., Hall, M. P., Zimmerman, K., Otto, P., Lubben, T.H., & Wood, K. V. (2016). NanoLuc complementation reporter optimized for accurate measurement of protein interactions in cells. ACS Chemical Biology , 11, 400−408. doi: 10.1021/acschembio.5b00753.
- Fanger, M. W., Shen, L., Graziano, R. F., & Guyre, P. M. (1989). Cytotoxicity mediated by human Fc receptors for IgG. Immunology Today , 10, 92–99. doi: 10.1016/0167-5699(89)90234-X.
- Gong, J. H., Maki, G., & Klingemann, H. G. (1994). Characterization of a human cell line (NK-92) with phenotypical and functional characteristics of activated natural killer cells. Leukemia , 8, 652–658.
- Jiang, X. R., Song, A., Bergelson, S., Arroll, T., Parekh, B., May, K., … Schenerman, M. (2011). Advances in the assessment and control of the effector functions of therapeutic antibodies. Nature Reviews Drug Discovery , 10, 101–111. doi: 10.1038/nrd3365.
- Koene, H. R., Kleijer, M., Algra, J., Roos, D., von dem Borne, A. E., & de Haas, M. (1997). Fc gammaRIIIa-158V/F polymorphism influences the binding of IgG by natural killer cell Fc gammaRIIIa, independently of the Fc gammaRIIIa-48litres/R/H phenotype. Blood , 90, 1109–1114. doi: 10.1182/blood.V90.3.1109.
- Korzeniewski, C., & Callewaert, D. M. (1983). An enzyme-release assay for natural cytotoxicity. Journal of Immunological Methods , 64, 313–320. doi: 10.1016/0022-1759(83)90438-6.
- Leader, B., Baca, Q. J., & Golan, D. E. (2008). Protein therapeutics: A summary and pharmacological classification. Nature Reviews Drug Discovery , 7, 21–39. doi: 10.1038/nrd2399.
- Leibson, P. J. (1997). Signal transduction during natural killer cell activation: Inside the mind of a killer. Immunity , 6, 655–661. doi: 10.1016/S1074-7613(00)80441-0.
- Lyubchenko, T. A., Wurth, G. A., & Zweifach, A. (2001). Role of calcium influx in cytotoxic T lymphocyte lytic granule exocytosis during target cell killing. Immunity , 15, 847–859. doi: 10.1016/S1074-7613(01)00233-3.
- Nimmerjahn, F., & Ravetch, J. V. (2008). Fcγ receptors as regulators of immune responses. Nature Reviews Immunology , 8, 34–47. doi: 10.1038/nri2206.
- Parekh, B.S., Berger, E., Sibley, S., Cahya, S., Xiao, L., LaCerte, M. A., … Gately, D. (2012). Development and validation of an antibody-dependent cell-mediated cytotoxicity-reporter gene assay. mAbs , 4, 310–318. doi: 10.4161/mabs.19873.
- Patel, A. K., & Boyd, P. N. (1995). An improved assay for antibody dependent cellular cytotoxicity based on time resolved fluorometry. Journal of Immunological Methods , 184, 29–38. doi: 10.1016/0022-1759(95)00071-H.
- Patel, D., Guo, X., Ng, S., Melchior, M., Balderes, P., Burtrum, D., … Kang, X. (2010). IgG isotype, glycosylation, and EGFR expression determine the induction of antibody-dependent cellular cytotoxicity in vitro by cetuximab. Human Antibodies , 19, 89–99. doi: 10.3233/HAB-2010-0232.
- Pinto, D., Sauer, M. M., Czudnochowski, N., Low, J. S., Tortorici, M. A., Housley, M. P., & Veesler, D. (2021). A human antibody that broadly neutralizes betacoronaviruses protects against SARS-CoV-2 by blocking the fusion machinery. bioRxiv , doi: 10.1101/2021.05.09.442808 bioRxiv.
- Prang, N., Preithner, S., Brischwein, K., Goster, P., Woppel, A., Muller, J., … da Silva, A. J. (2005). Cellular and complement-dependent cytotoxicity of Ep-CAM-specific monoclonal antibody MT201 against breast cancer cell lines. British Journal of Cancer , 92, 342–349. doi: 10.1038/sj.bjc.6602310.
- Prior, S., Hufton, S. E., Fox, B., Dougall, T., Rigsby, P., Bristow, A., & Participants of the Study (2017). International standards for monoclonal antibodies to support pre- and post-marketing product consistency: Evaluation of a candidate international standard for the bioactivities of rituximab. mAbs , 10(1), 129-142. doi: 10.1080/19420862.2017.1386824.
- Reff, M. E., Carner, K., Chambers, K. S., Chinn, P. C., Leonard, J. E., Raab, R., … Anderson, D. R. (1994). Depletion of B cells in vivo by a chimeric mouse human monoclonal antibody to CD20. Blood , 83, 435–445. doi: 10.1182/blood.V83.2.435.435.
- Robertson, M. J., Cochran, K. J., Cameron, C., Le, J. M., Tantravahi, R., & Ritz, J. (1996). Characterization of a cell line, NKL, derived from an aggressive human natural killer cell leukemia. Experimental Hematology , 24, 406–415.
- Roden, M. M., Lee, K. H., Panelli, M. C., & Marincola, F. M. (1999). A novel cytolysis assay using fluorescent labeling and quantitative fluorescent scanning technology. Journal of Immunological Methods , 226, 29–41. doi: 10.1016/S0022-1759(99)00039-3.
- Schnueriger, A., Grau, R., Sondermann, P., Schreitmueller, T., Marti, S., & Zocher, M. (2011). Development of a quantitative, cell-line based assay to measure ADCC activity mediated by therapeutic antibodies. Molecular Immunology , 48, 1512–1517. doi: 10.1016/j.molimm.2011.04.010.
- Sergeeva, A., Alatrash, G., He, H., Ruisaard, K., Lu, S., Wygant, J., … Molldrem, J. J. (2011). An anti-PR1/HLA-A2 T-cell receptor-like antibody mediates complement-dependent cytotoxicity against acute myeloid leukemia progenitor cells. Blood , 117, 4262–4272. doi: 10.1182/blood-2010-07-299248.
- Stewart, R., Thom, G., Levens, M., Guler-Gane, G., Holgate, R., Rudd, P. M., & Lund, J. (2011). A variant human IgG1-Fc mediates improved ADCC. Protein Engineering Design & Selection, 24, 671–678. doi: 10.1093/protein/gzr015.
- Vermorken, J. B., Mesia, R., Rivera, F., Remenar, E., Kawecki, A., Rottey, S., … Hitt, R. (2008). Platinum-based chemotherapy plus cetuximab in head and neck cancer. New England Journal of Medicine , 359, 1116–1127. doi: 10.1056/NEJMoa0802656.
- Vivier, E., Rochet, N., Ackerly, M., Petrini, J., Levine, H., Daley, J., & Anderson, P. (1992). Signaling function of reconstituted CD16: ζ:γ receptor complex isoforms. International Immunology , 4, 1313–1323. doi: 10.1093/intimm/4.11.1313.
- von Zons, P., Crowley-Nowick, P., Friberg, D., Bell, M., Koldovsky, U., & Whiteside, T. L. (1997). Comparison of europium and chromium release assays: Cytotoxicity in healthy individuals and patients with cervical carcinoma. Clinical and Diagnostic Laboratory Immunology , 4, 202–207. doi: 10.1128/cdli.4.2.202-207.1997.
- Wege, A. K., Kirchhammer, N., Kazandjian, L. V., Prassl, S., Brandt, M., Piendl, G., & Gero Brockhof, G. (2020). A novel rabbit derived anti-HER2 antibody with pronounced therapeutic efectiveness on HER2-positive breast cancer cells in vitro and in humanized tumor mice (HTM). Journal of Translational Medicine , 18, 316. doi: 10.1186/s12967-020-02484-9.
Citing Literature
Number of times cited according to CrossRef: 7
- Guanjie Li, Hiroyuki Suzuki, Tomokazu Ohishi, Teizo Asano, Tomohiro Tanaka, Miyuki Yanaka, Takuro Nakamura, Takeo Yoshikawa, Manabu Kawada, Mika Kaneko, Yukinari Kato, Antitumor activities of a defucosylated anti‑EpCAM monoclonal antibody in colorectal carcinoma xenograft models, International Journal of Molecular Medicine, 10.3892/ijmm.2023.5221, 51 , 2, (2023).
- Marcus ZW Tong, Julian DJ Sng, Meagan Carney, Lucy Cooper, Samuel Brown, Katie E Lineburg, Keng Yih Chew, Neve Collins, Kirsten Ignacio, Megan Airey, Lucy Burr, Briony A Joyce, Dhilshan Jayasinghe, Christopher LD McMillan, David A Muller, Anurag Adhikari, Linda A Gallo, Emily S Dorey, Helen L Barrett, Stephanie Gras, Corey Smith, Kim Good‐Jacobson, Kirsty R Short, Elevated BMI reduces the humoral response to SARS‐CoV‐2 infection, Clinical & Translational Immunology, 10.1002/cti2.1476, 12 , 12, (2023).
- Yusuke Yano, Nobuhito Hamano, Kenshin Haruta, Tomomi Kobayashi, Masahiro Sato, Yamato Kikkawa, Yoko Endo-Takahashi, Rui Tada, Ryo Suzuki, Kazuo Maruyama, Motoyoshi Nomizu, Yoichi Negishi, Development of an Antibody Delivery Method for Cancer Treatment by Combining Ultrasound with Therapeutic Antibody-Modified Nanobubbles Using Fc-Binding Polypeptide, Pharmaceutics, 10.3390/pharmaceutics15010130, 15 , 1, (130), (2022).
- Pascale Paul, Christophe Picard, Luc Lyonnet, Noémie Resseguier, Lucas Hubert, Laurent Arnaud, Julie Di Cristofaro, Marc Laine, Franck Paganelli, Françoise Dignat-George, Corinne Frère, Florence Sabatier, Regis Guieu, Laurent Bonello, FCGR2A-HH Gene Variants Encoding the Fc Gamma Receptor for the C-Reactive Protein Are Associated with Enhanced Monocyte CD32 Expression and Cardiovascular Events’ Recurrence after Primary Acute Coronary Syndrome, Biomedicines, 10.3390/biomedicines10020495, 10 , 2, (495), (2022).
- Ali Zhang, Hannah D. Stacey, Michael R. D’Agostino, Yona Tugg, Art Marzok, Matthew S. Miller, Beyond neutralization: Fc-dependent antibody effector functions in SARS-CoV-2 infection, Nature Reviews Immunology, 10.1038/s41577-022-00813-1, 23 , 6, (381-396), (2022).
- Yuting Hong, Huilin Guo, Min Wei, Yali Zhang, Mujin Fang, Tong Cheng, Zhiyong Li, Shengxiang Ge, Xiangyang Yao, Quan Yuan, Ningshao Xia, Cell-based reporter assays for measurements of antibody-mediated cellular cytotoxicity and phagocytosis against SARS-CoV-2 spike protein, Journal of Virological Methods, 10.1016/j.jviromet.2022.114564, 307 , (114564), (2022).
- Jingwei Lin, Huan Chen, Yudong Bai, Shoukun Li, Gengyuan Liang, Tianning Fan, Ningyuan Gao, Xiupeng Wu, Hui Li, Gang Chen, Yingxu Gao, Jungang Fan, Ganoderma immunomodulatory proteins: mushrooming functional FIPs, Applied Microbiology and Biotechnology, 10.1007/s00253-022-11839-9, 106 , 7, (2367-2380), (2022).

