Deoxyfluorination of phenols for chemoselective18F-labeling of peptides
Riya Halder, Gaoyuan Ma, Jens Rickmeier, James W. McDaniel, Roland Petzold, Constanze N. Neumann, Jennifer M. Murphy, Tobias Ritter
peptide-based PET probes
chemoselective radiolabeling
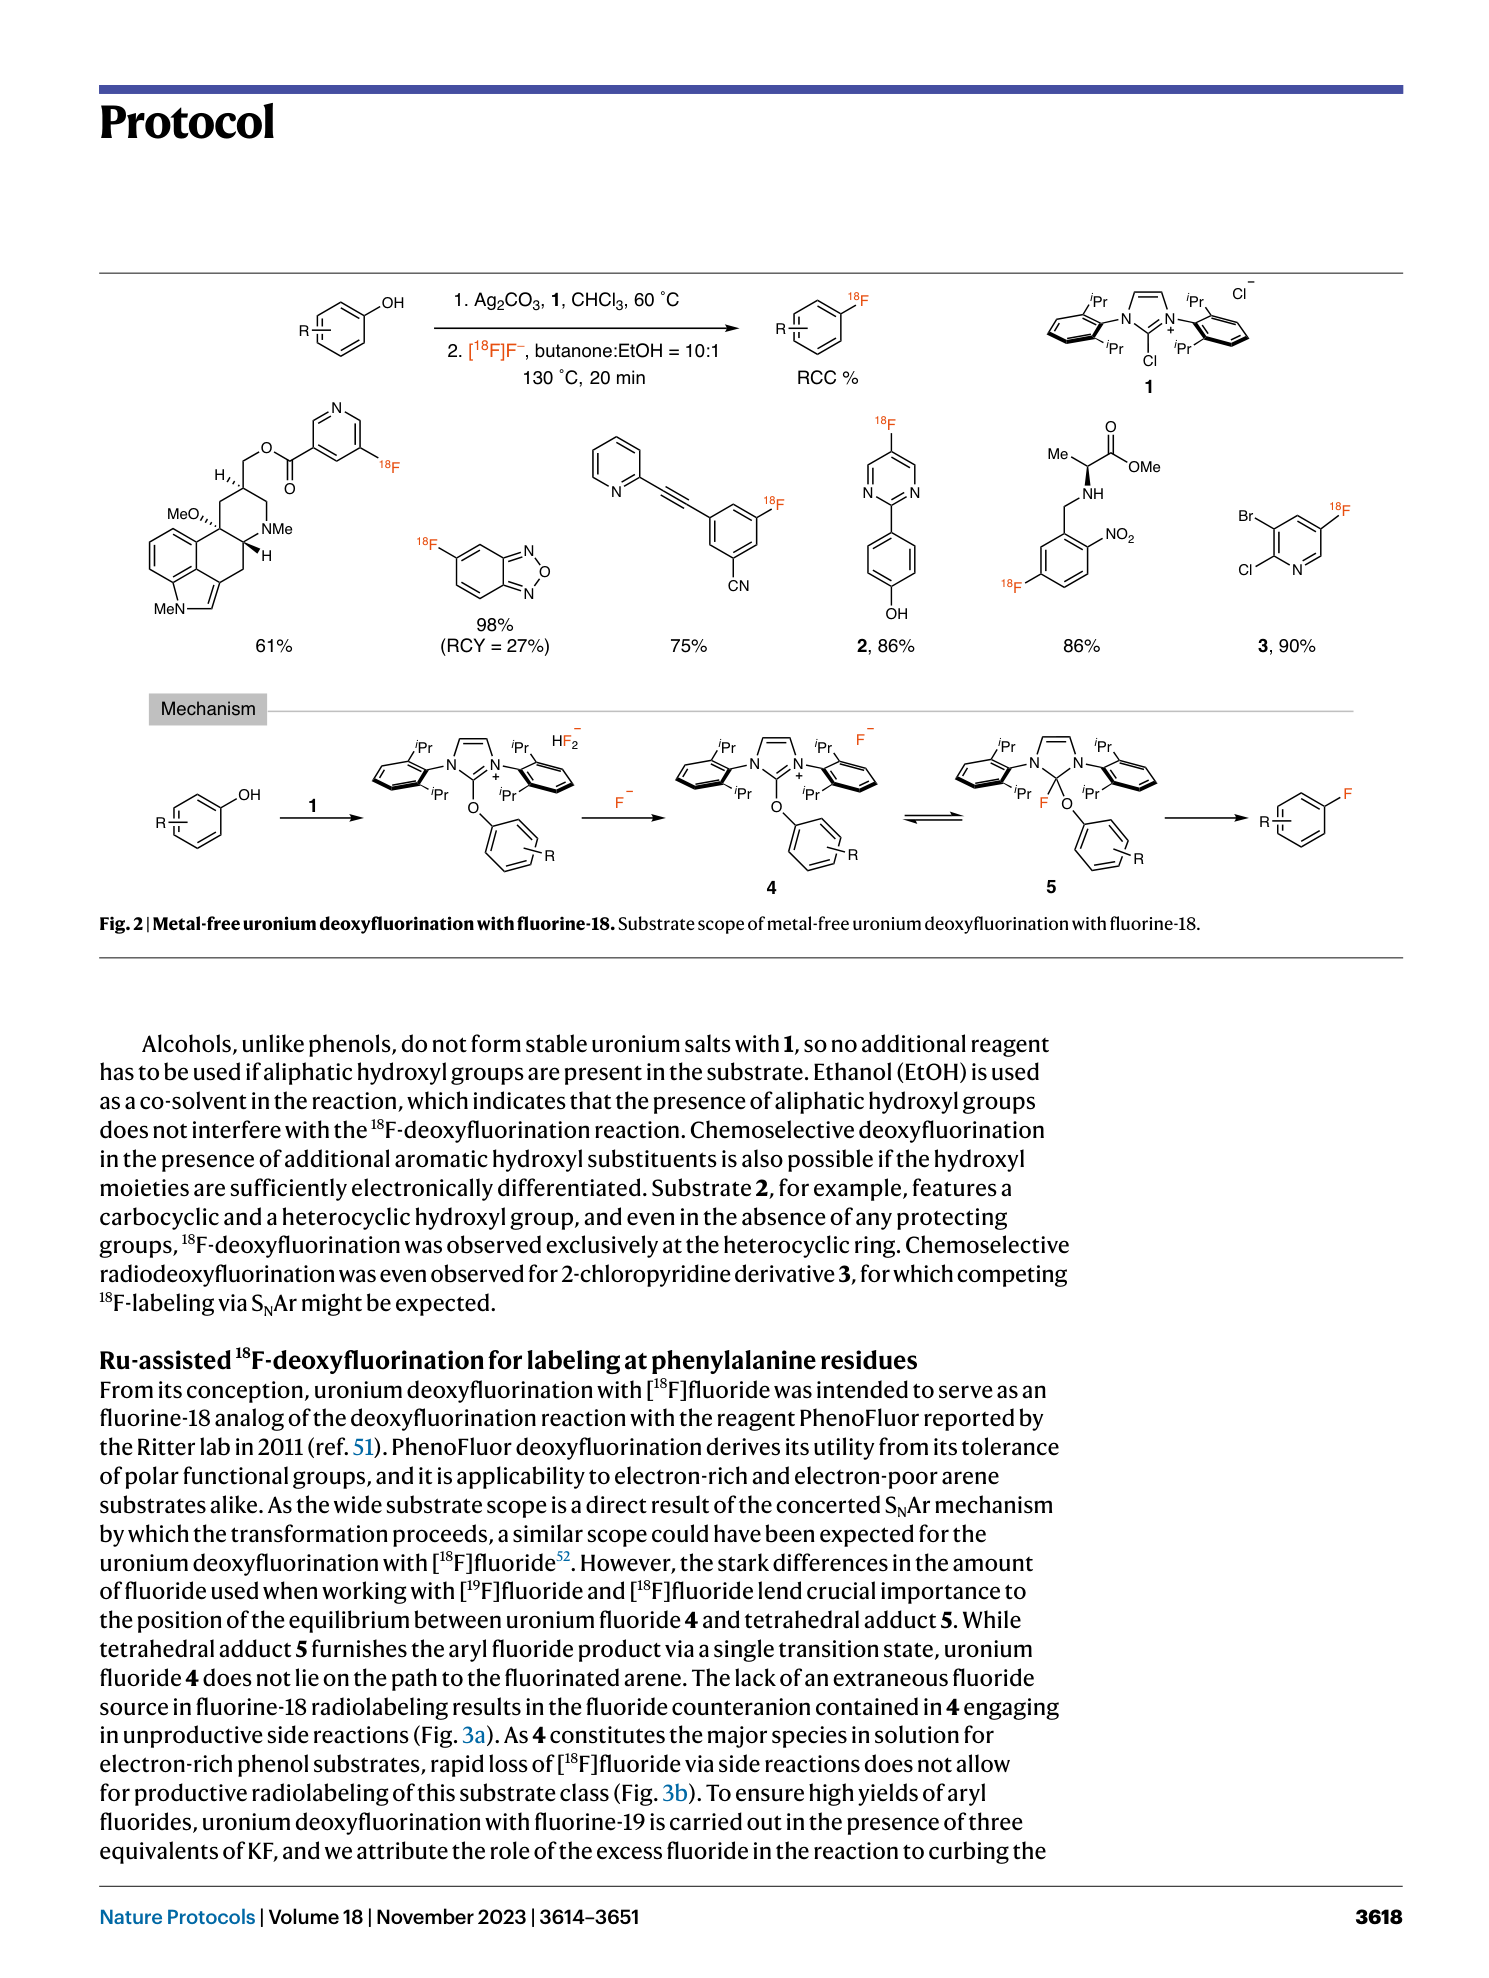
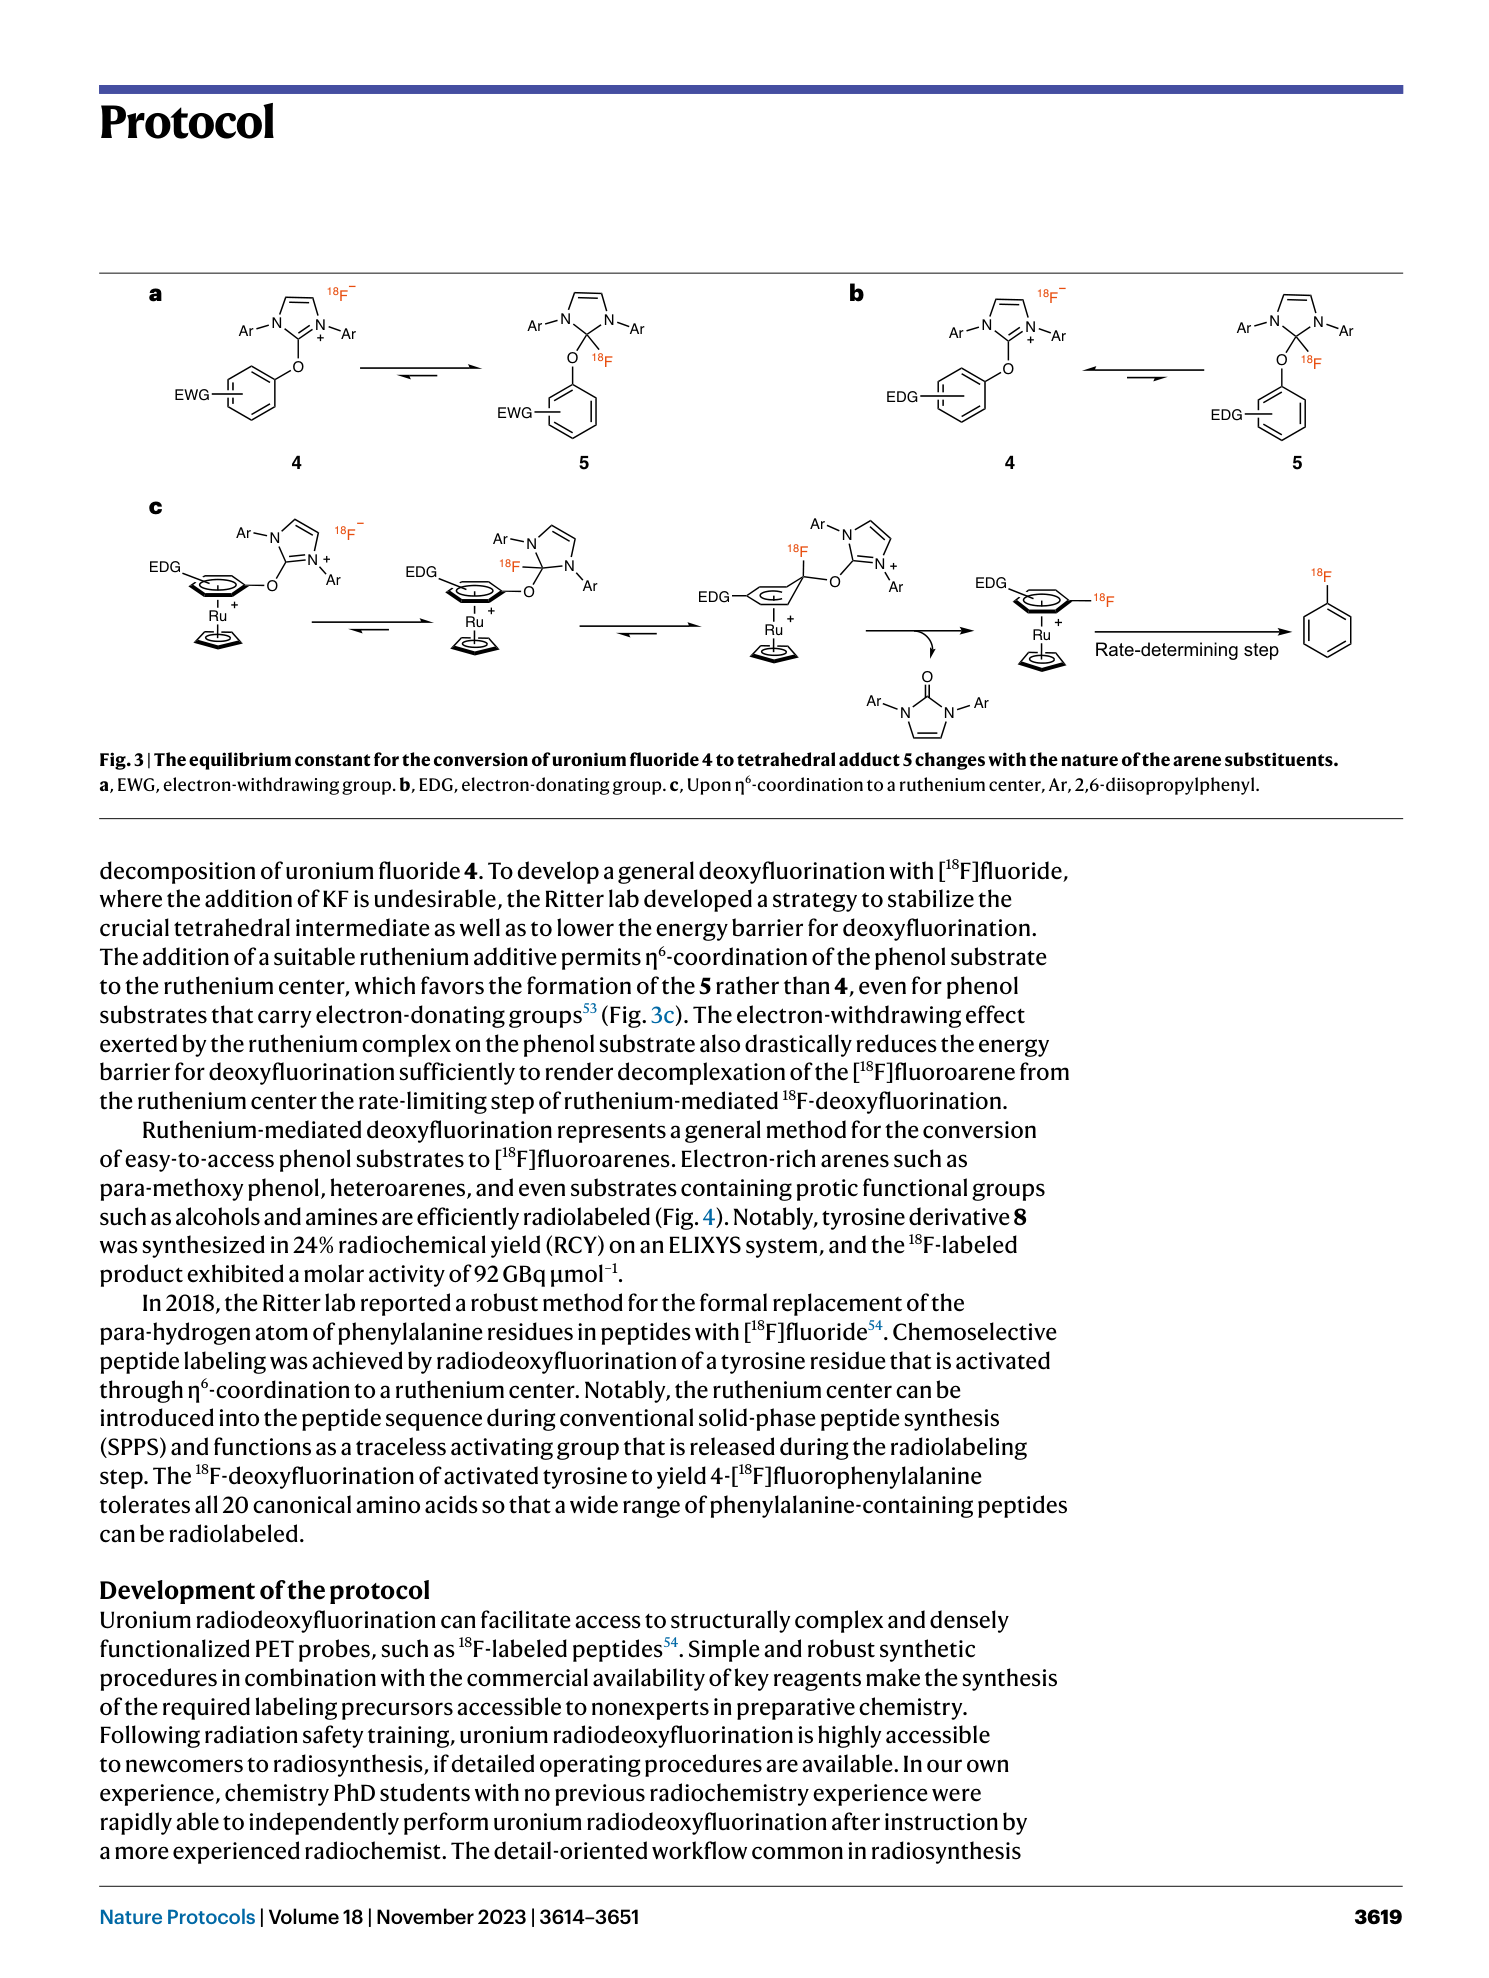
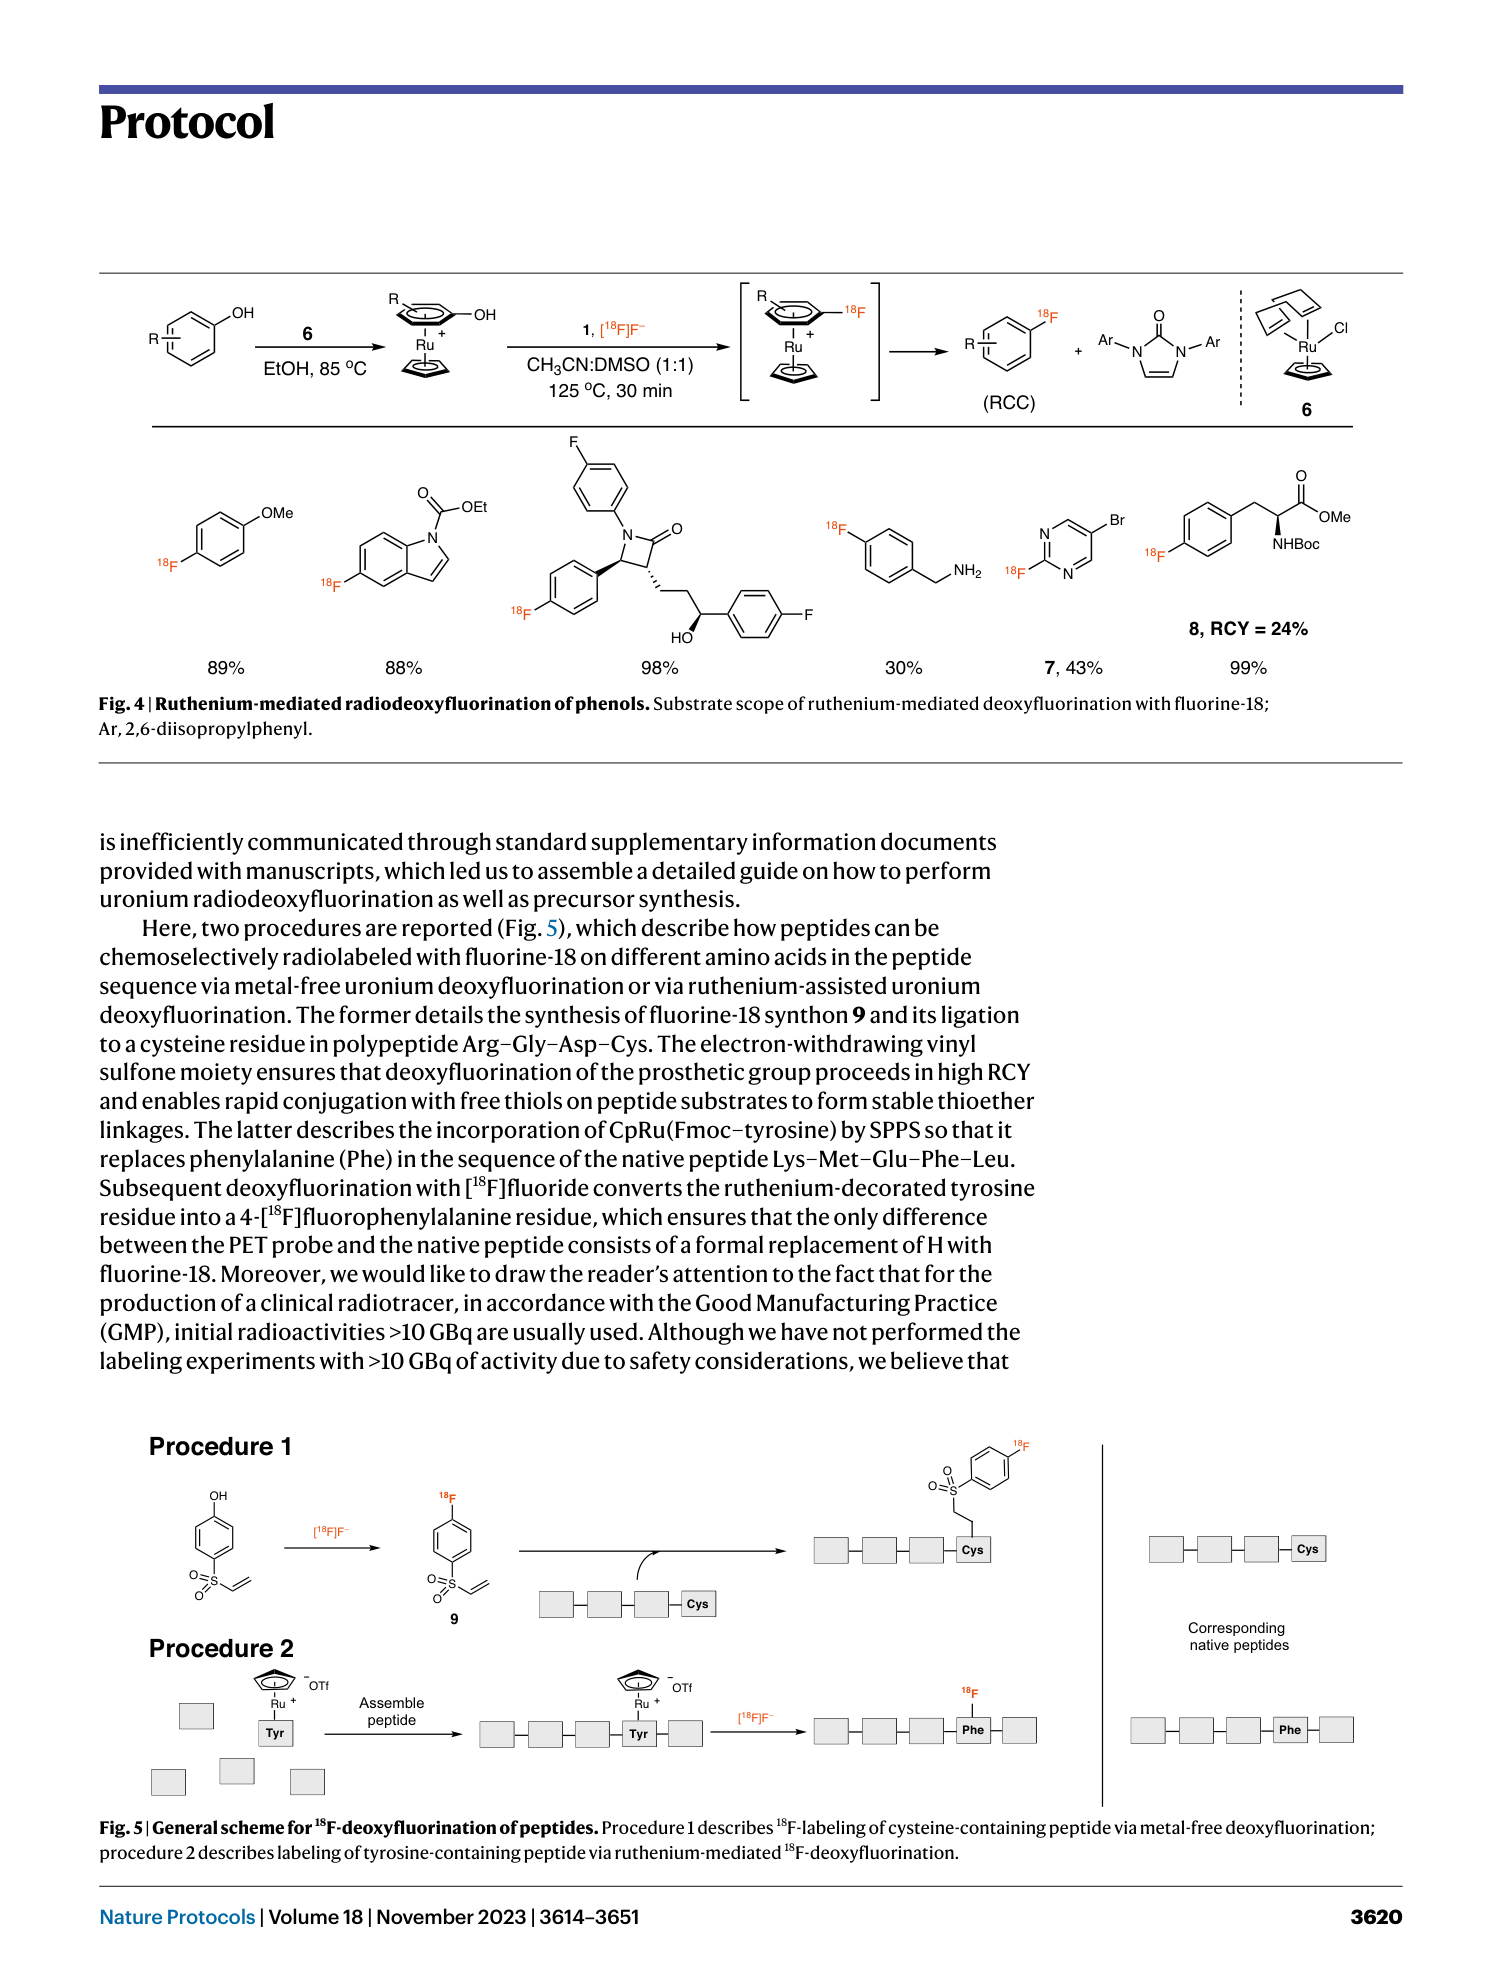
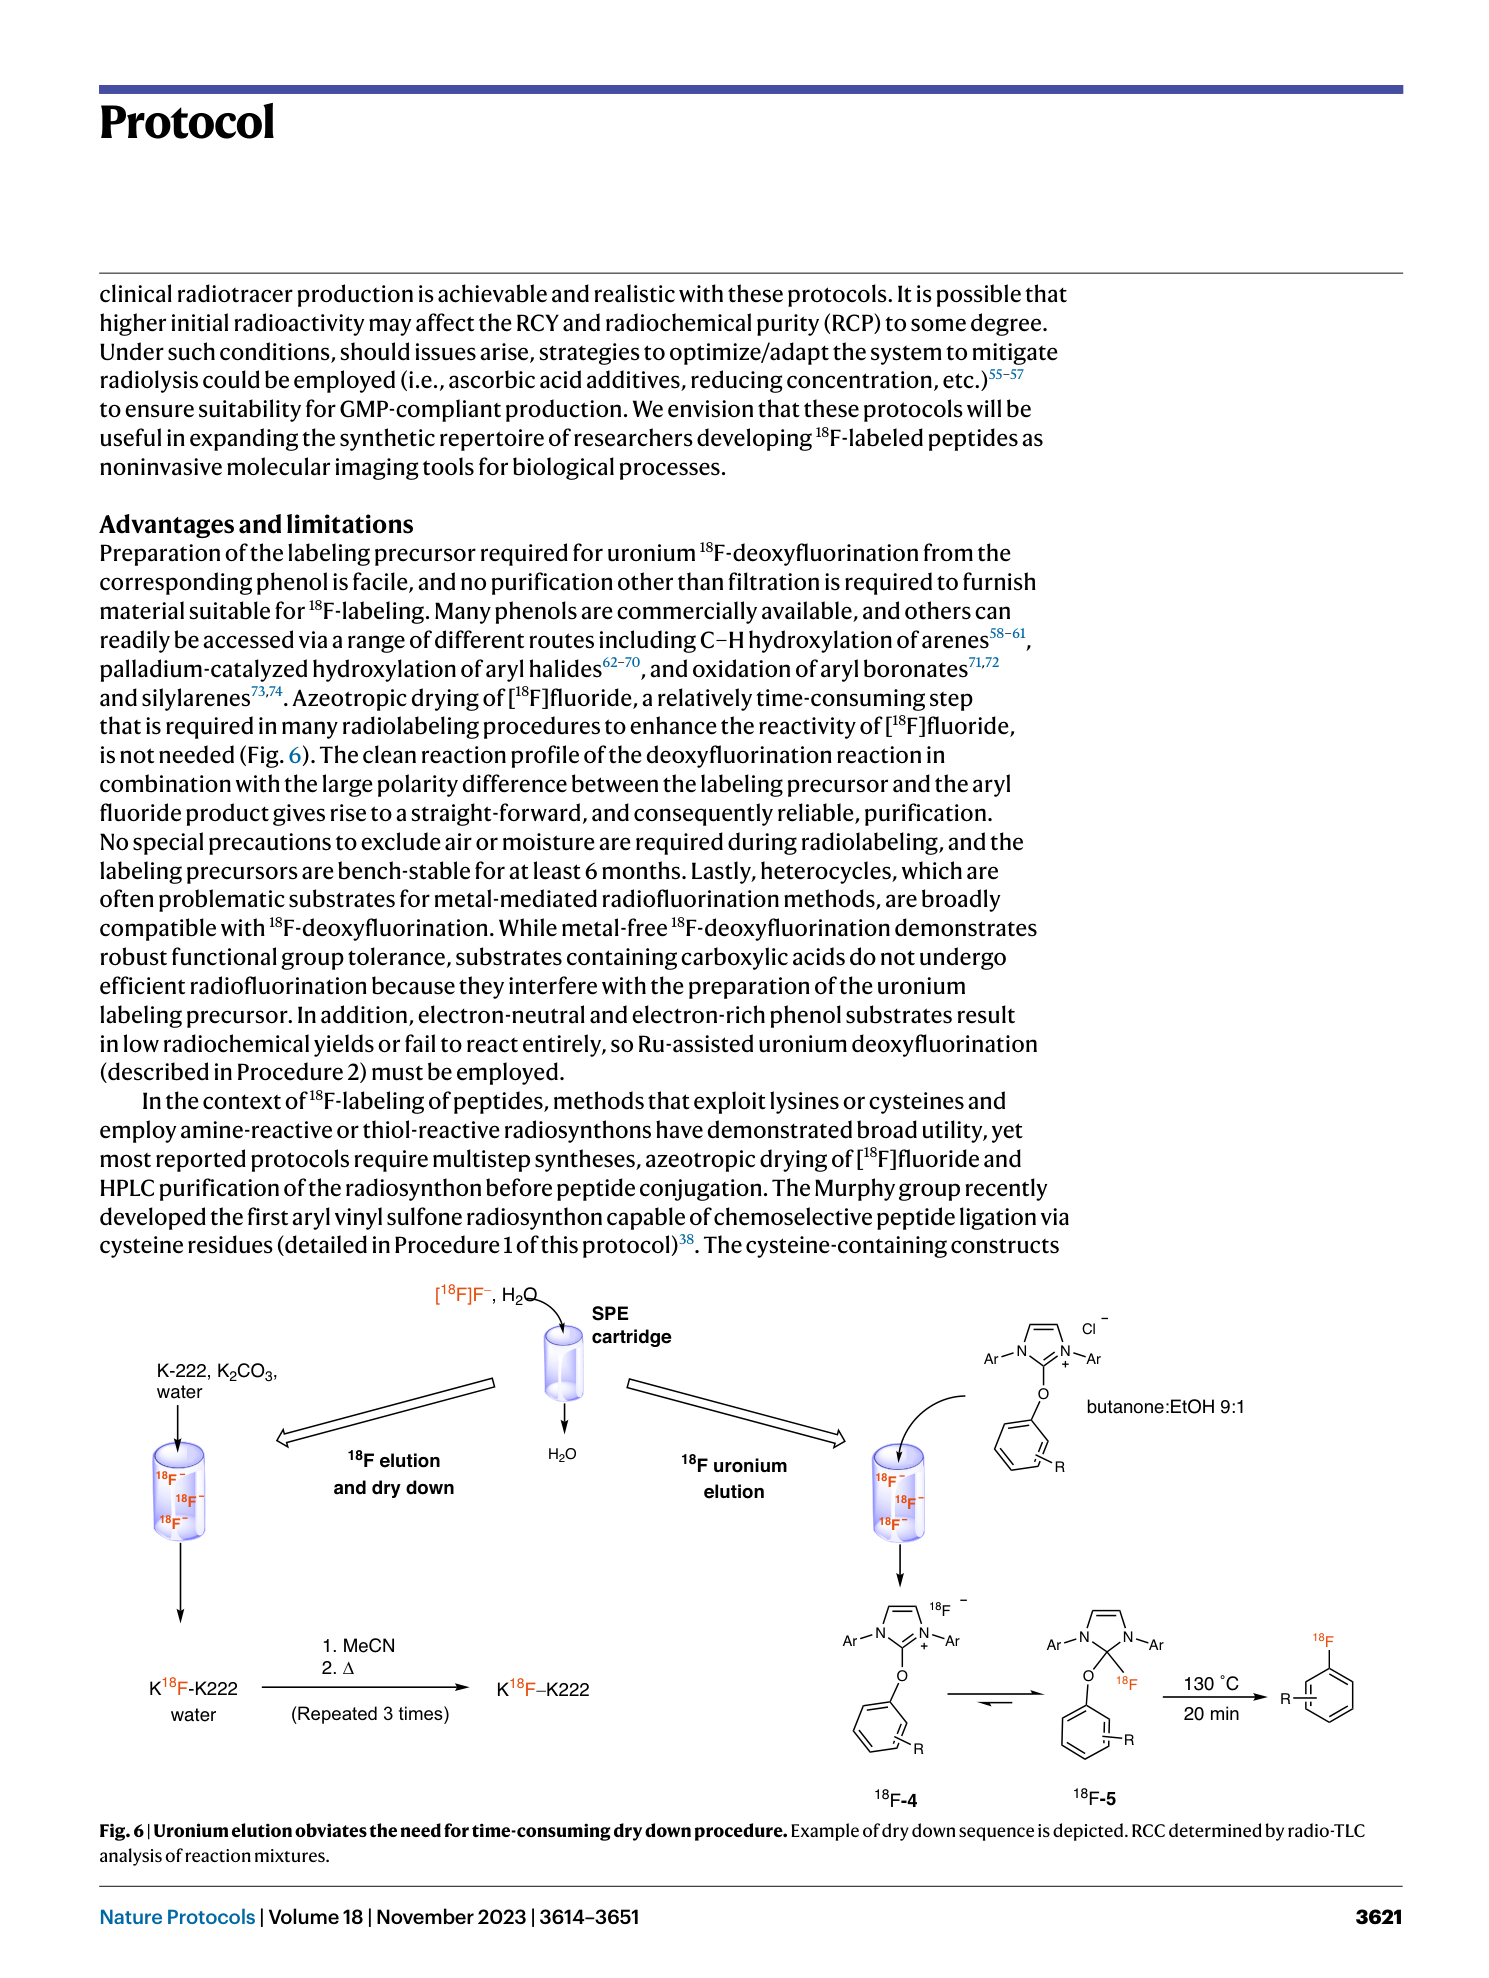
18F-deoxyfluorination
nucleophilic aromatic substitution
radiosynthesis


Extended
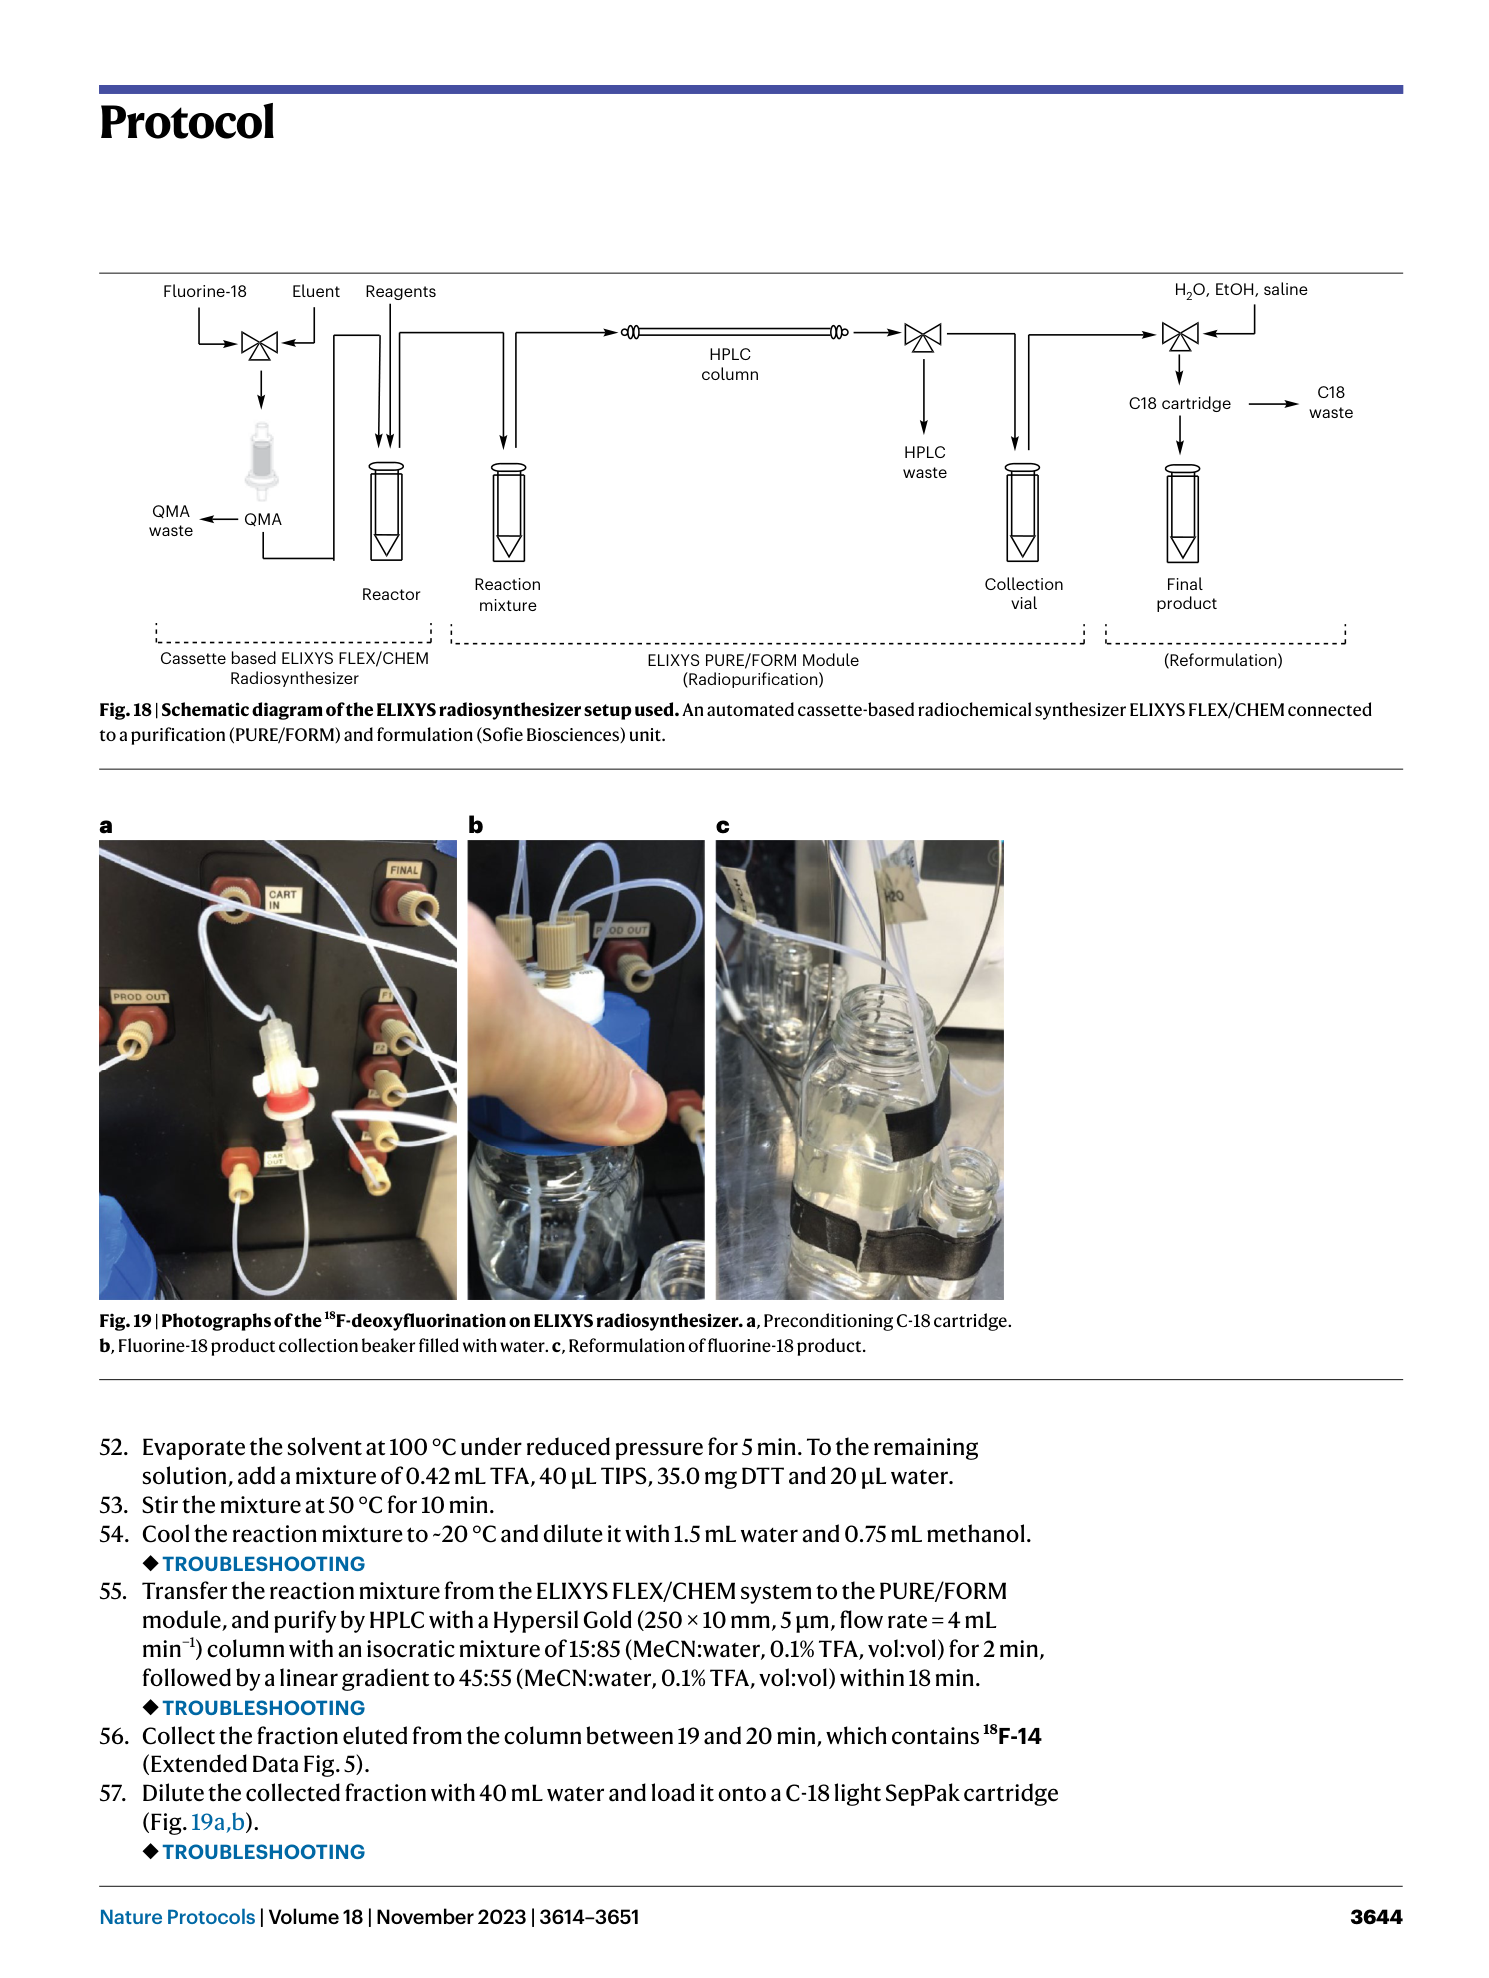
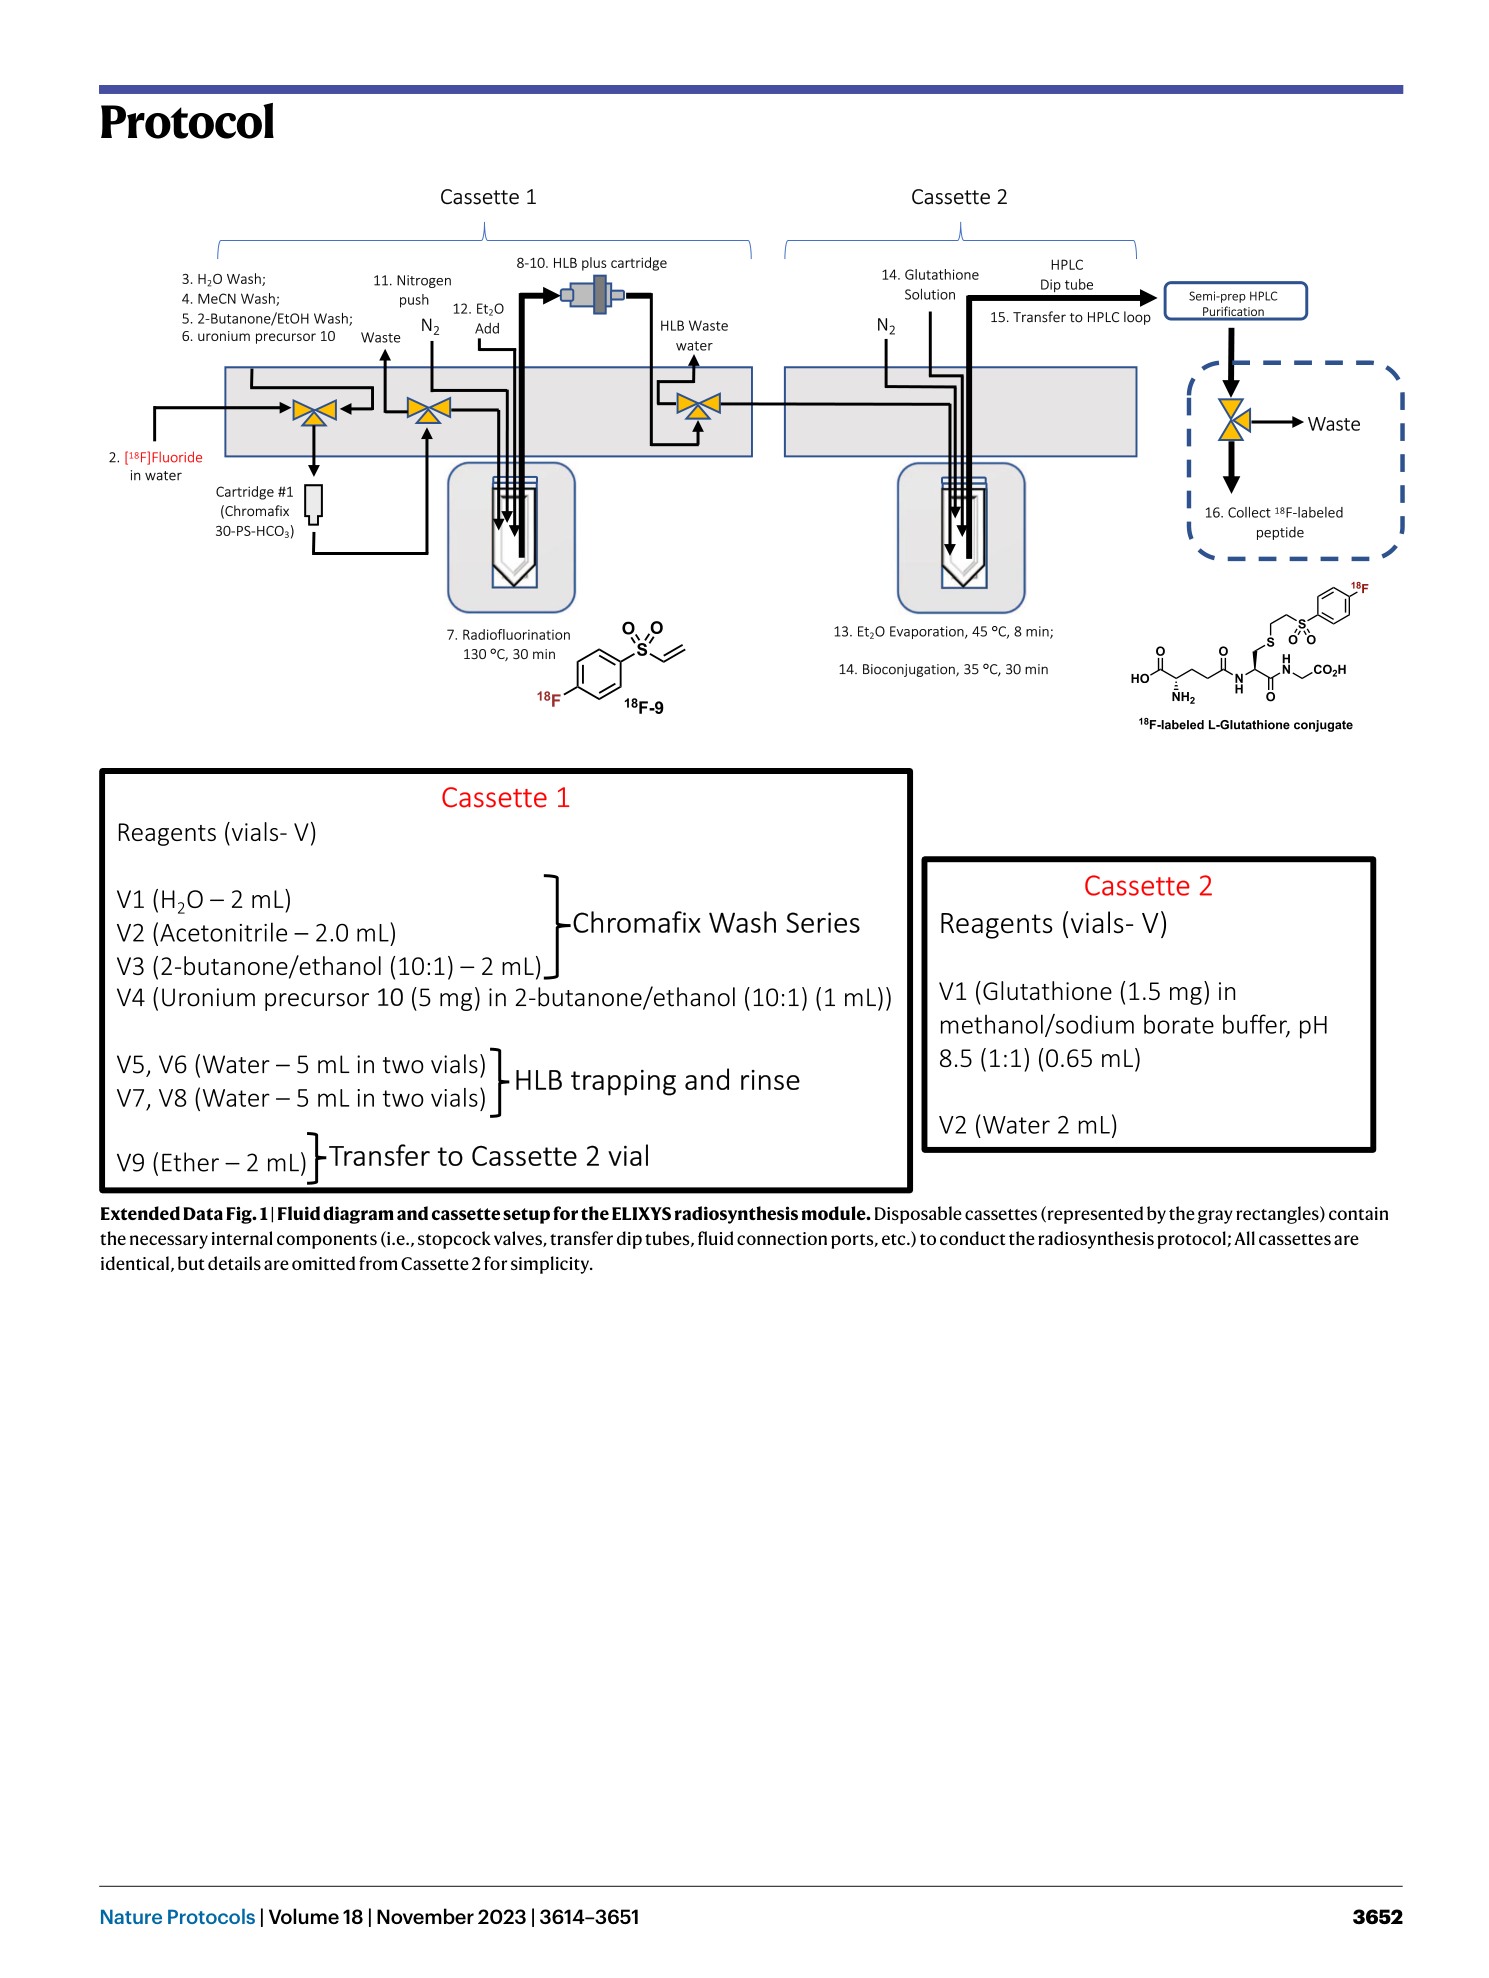
Extended Data Fig. 1 Fluid diagram and cassette setup for the ELIXYS radiosynthesis module.
Disposable cassettes (represented by the gray rectangles) contain the necessary internal components (i.e., stopcock valves, transfer dip tubes, fluid connection ports, etc.) to conduct the radiosynthesis protocol; All cassettes are identical, but details are omitted from Cassette 2 for simplicity.
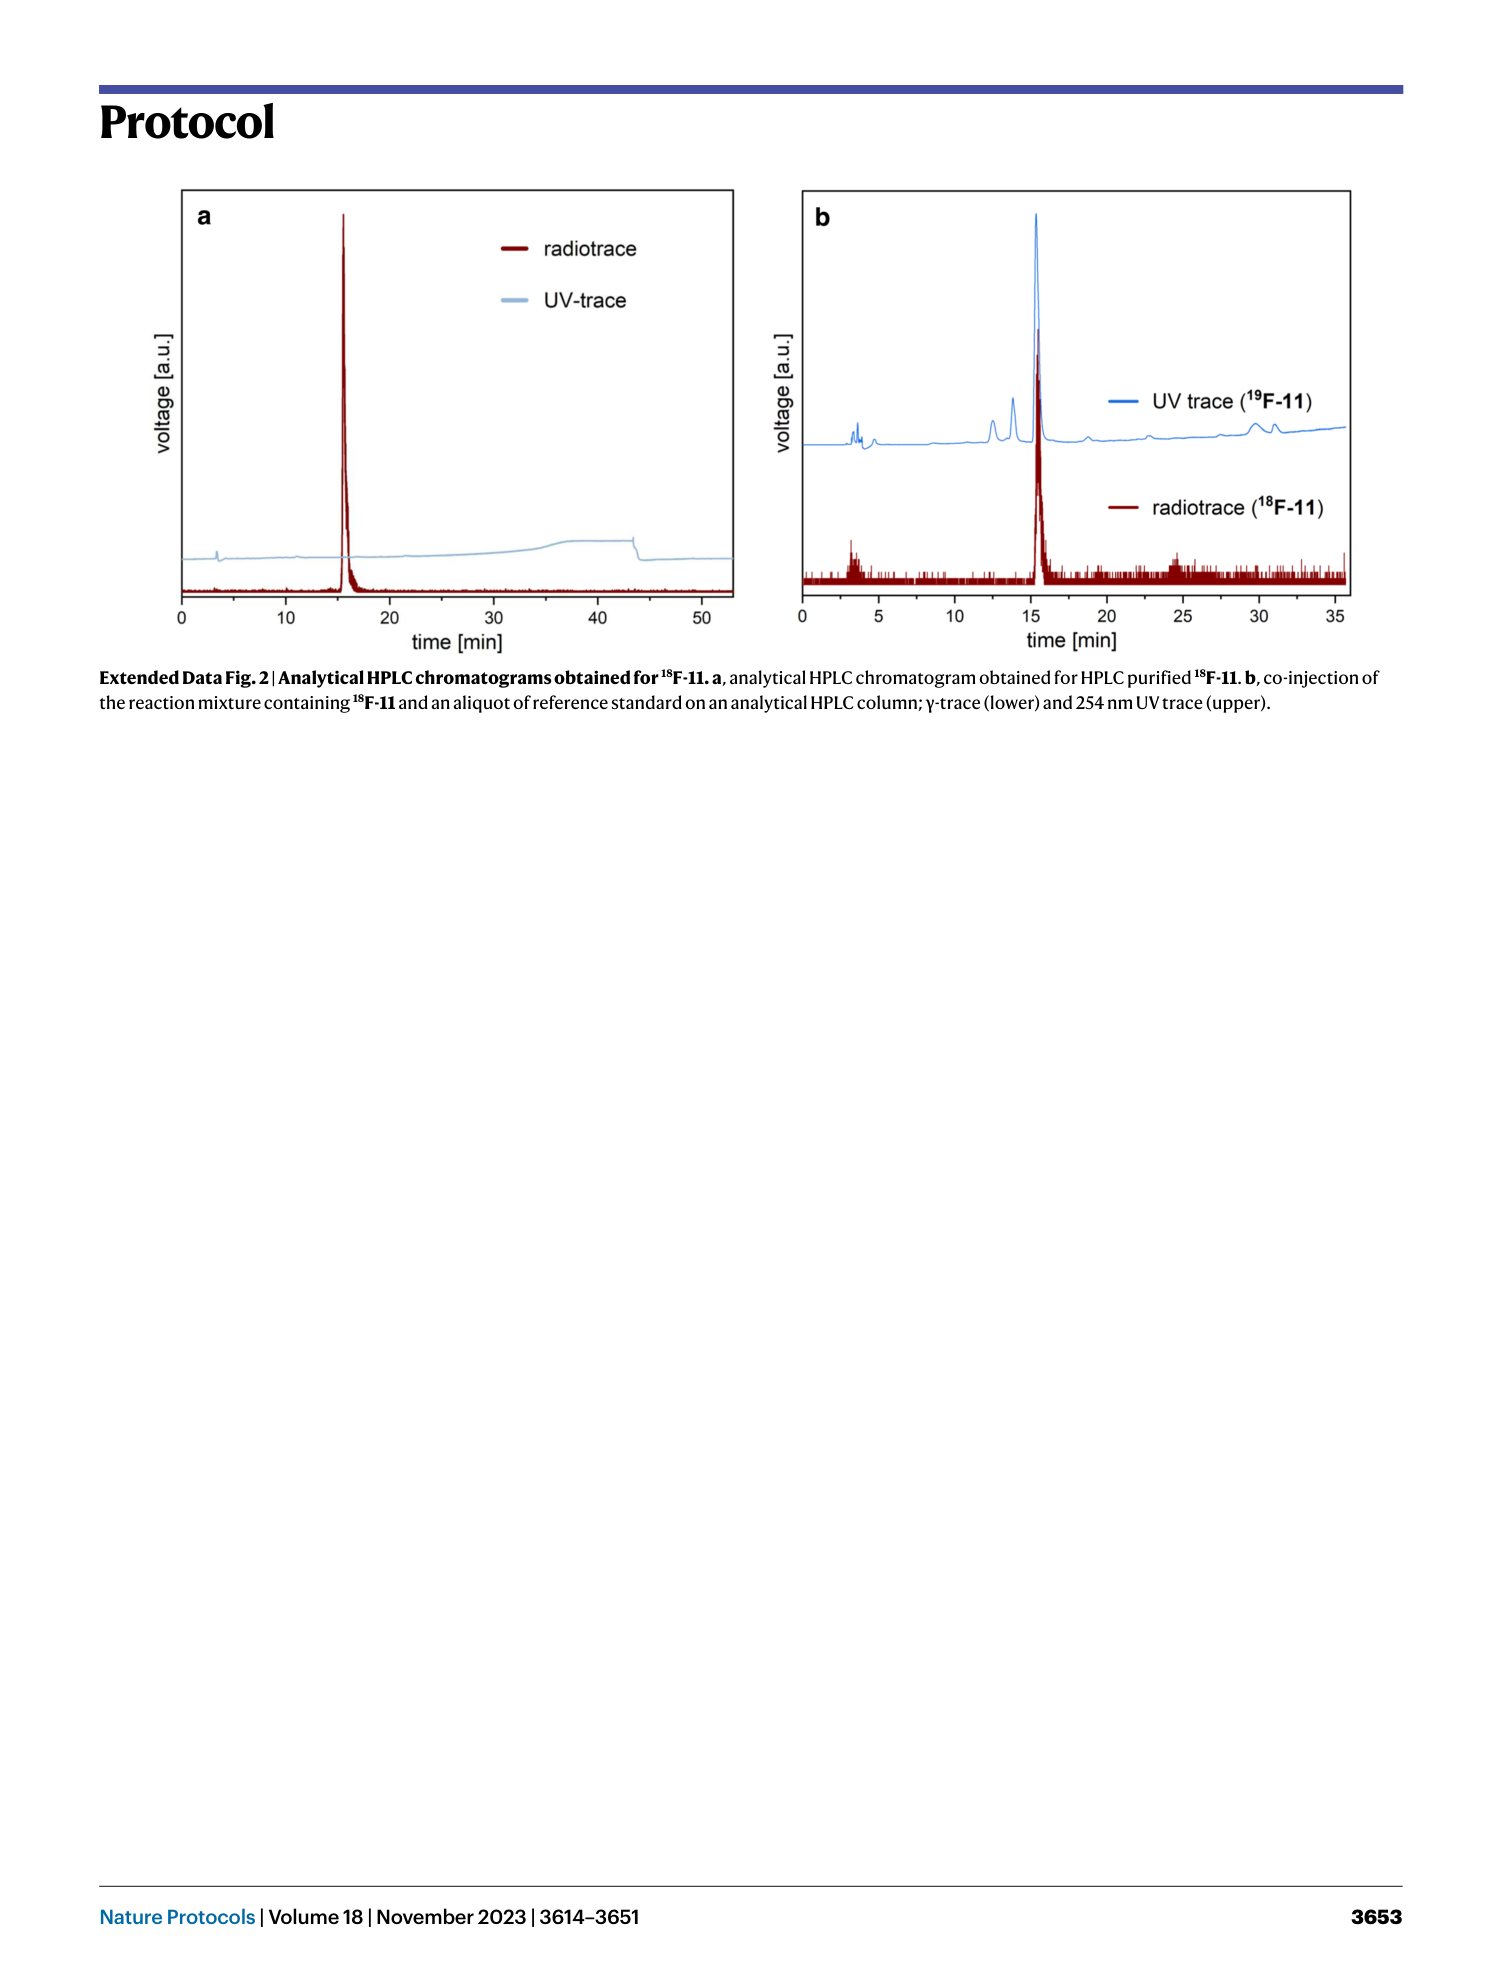
Extended Data Fig. 2 Analytical HPLC chromatograms obtained for 18 F-11.
a , analytical HPLC chromatogram obtained for HPLC purified 18 F-11 . b , co-injection of the reaction mixture containing 18 F-11 and an aliquot of reference standard on an analytical HPLC column; γ-trace (lower) and 254 nm UV trace (upper).
Extended Data Fig. 3 Prep HPLC trace of 15.
YMC Triat C-18 column, 5.0 μm, 150 × 4.6 mm, flow rate = 1.0 mL·min −1 by an isocratic elution with 25:75 (0.1% TFA in H 2 O:MeOH, v-v).
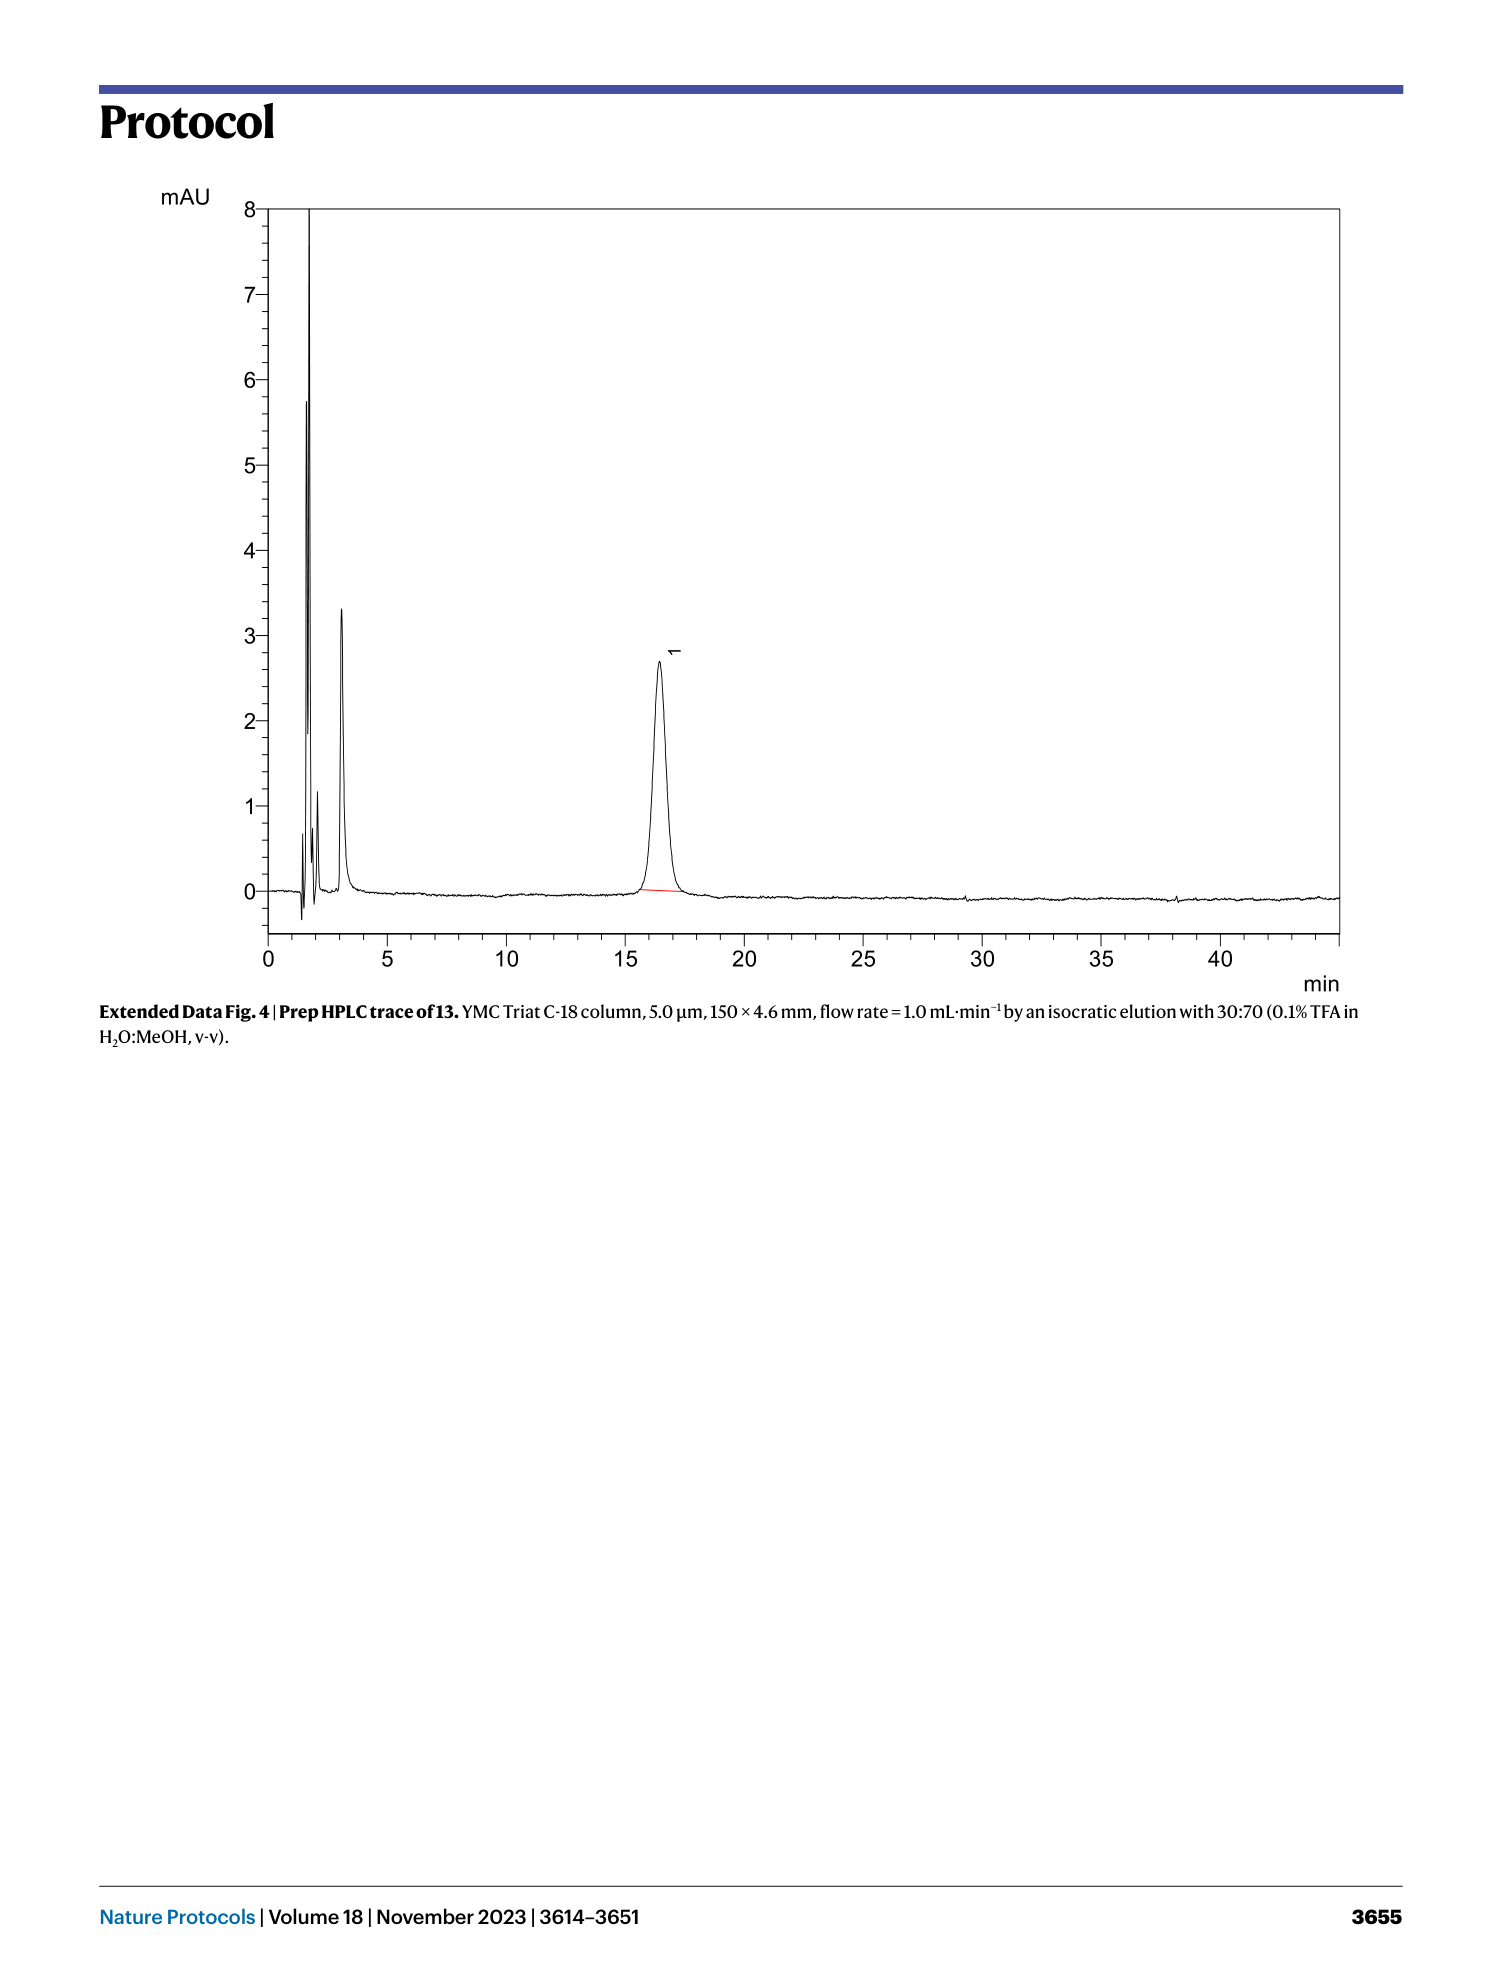
Extended Data Fig. 4 Prep HPLC trace of 13.
YMC Triat C-18 column, 5.0 μm, 150 × 4.6 mm, flow rate = 1.0 mL·min −1 by an isocratic elution with 30:70 (0.1% TFA in H 2 O:MeOH, v-v).
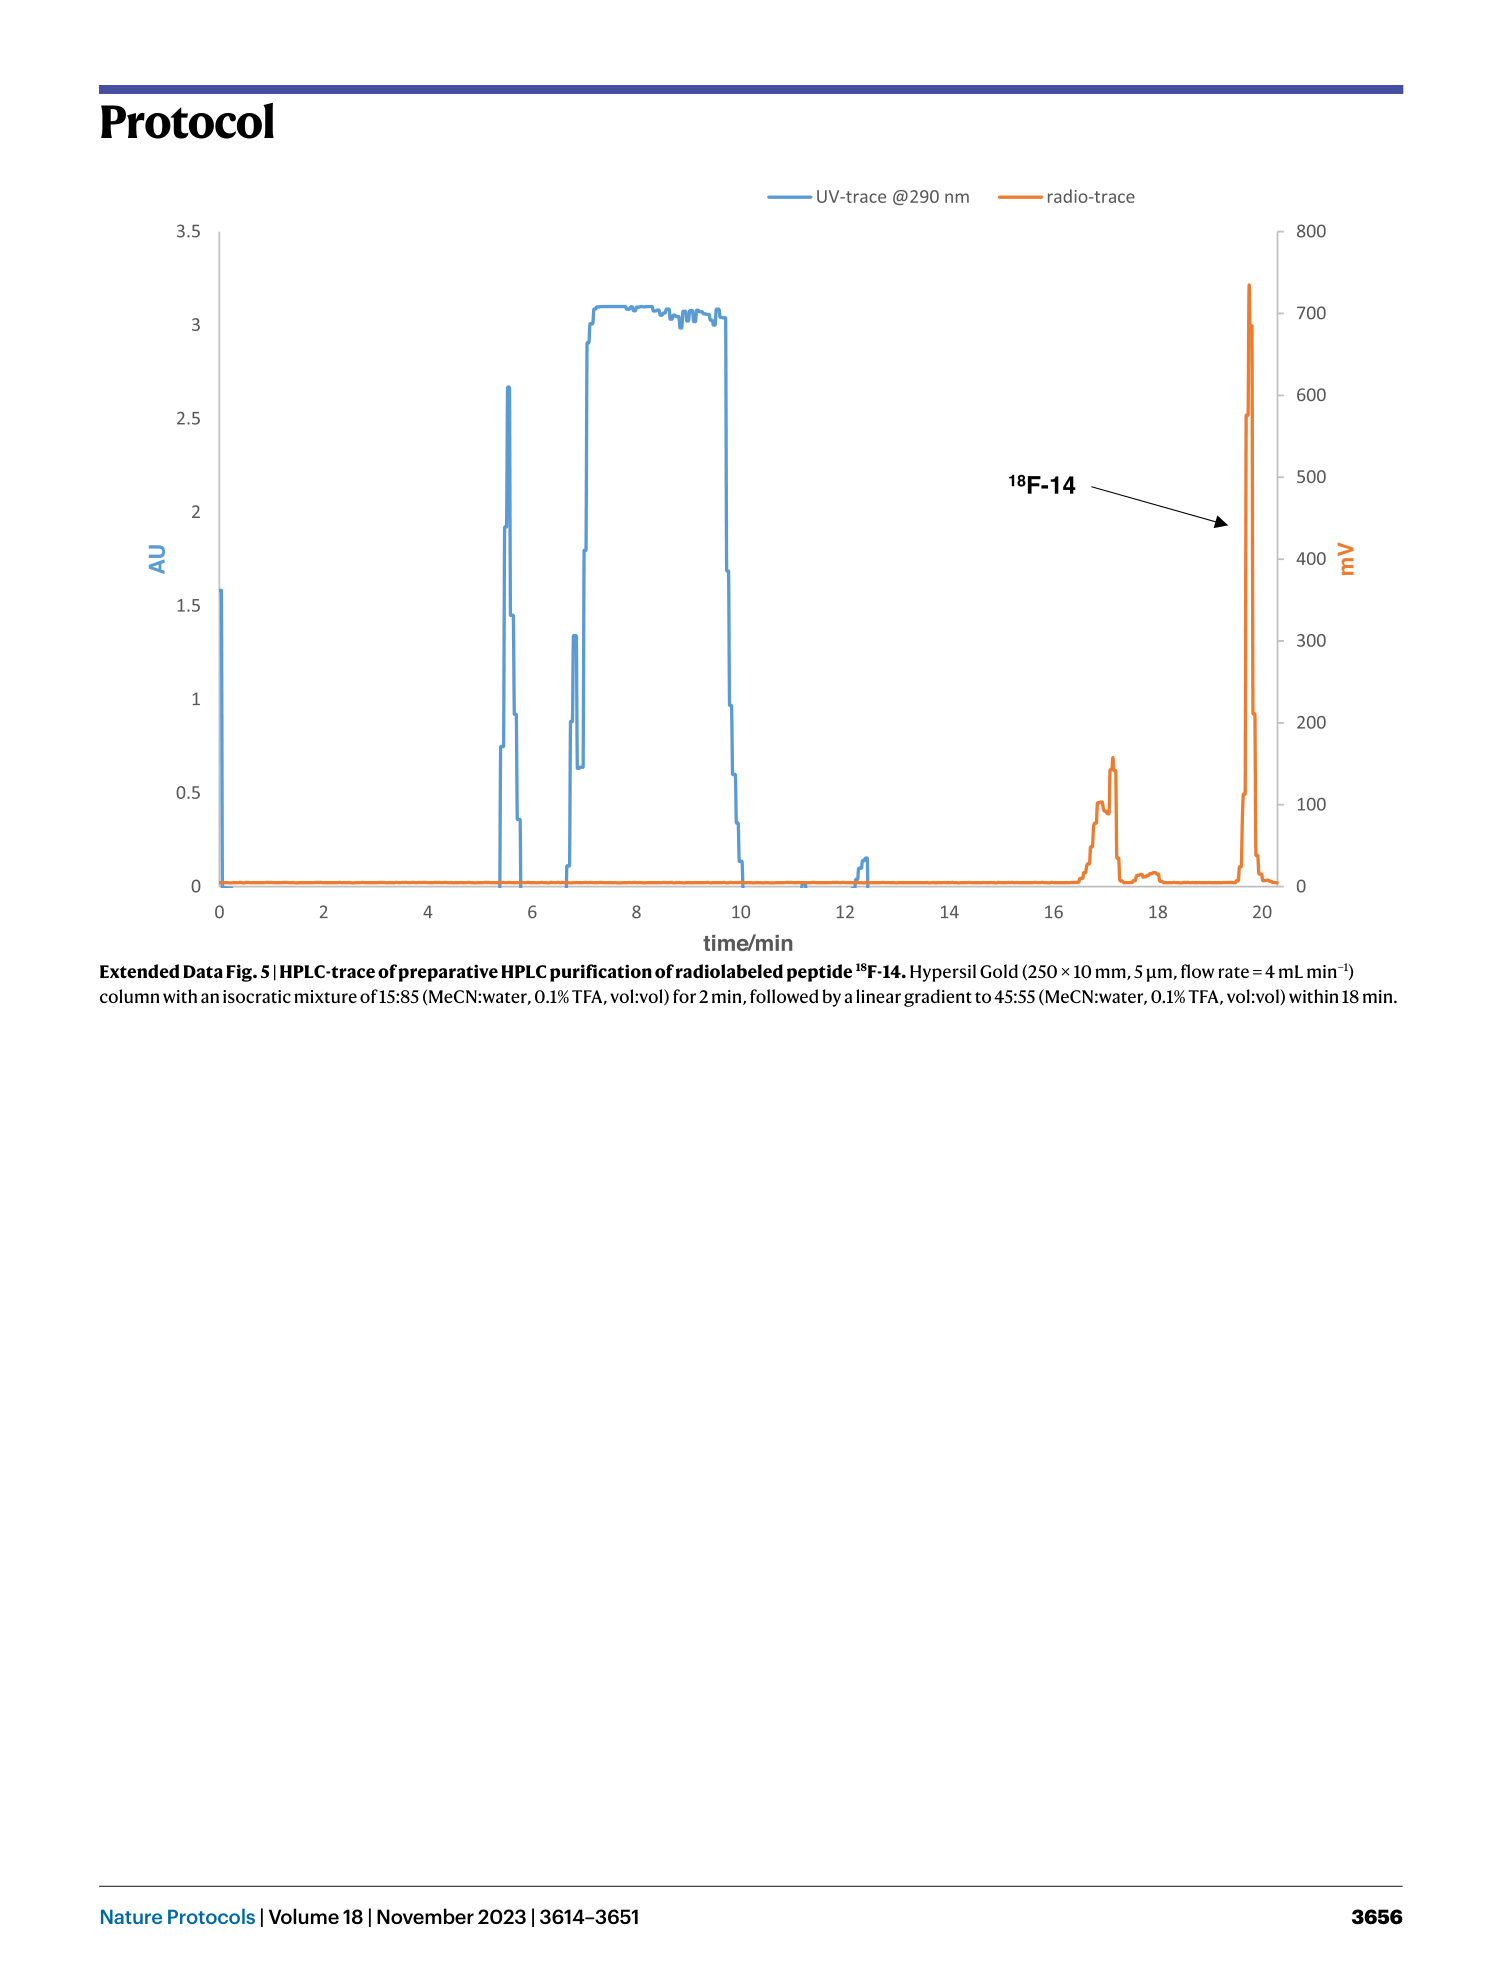
Extended Data Fig. 5 HPLC-trace of preparative HPLC purification of radiolabeled peptide 18 F-14.
Hypersil Gold (250 ✕ 10 mm, 5 μm, flow rate = 4 mL min −1 ) column with an isocratic mixture of 15:85 (MeCN:water, 0.1% TFA, vol:vol) for 2 min, followed by a linear gradient to 45:55 (MeCN:water, 0.1% TFA, vol:vol) within 18 min.
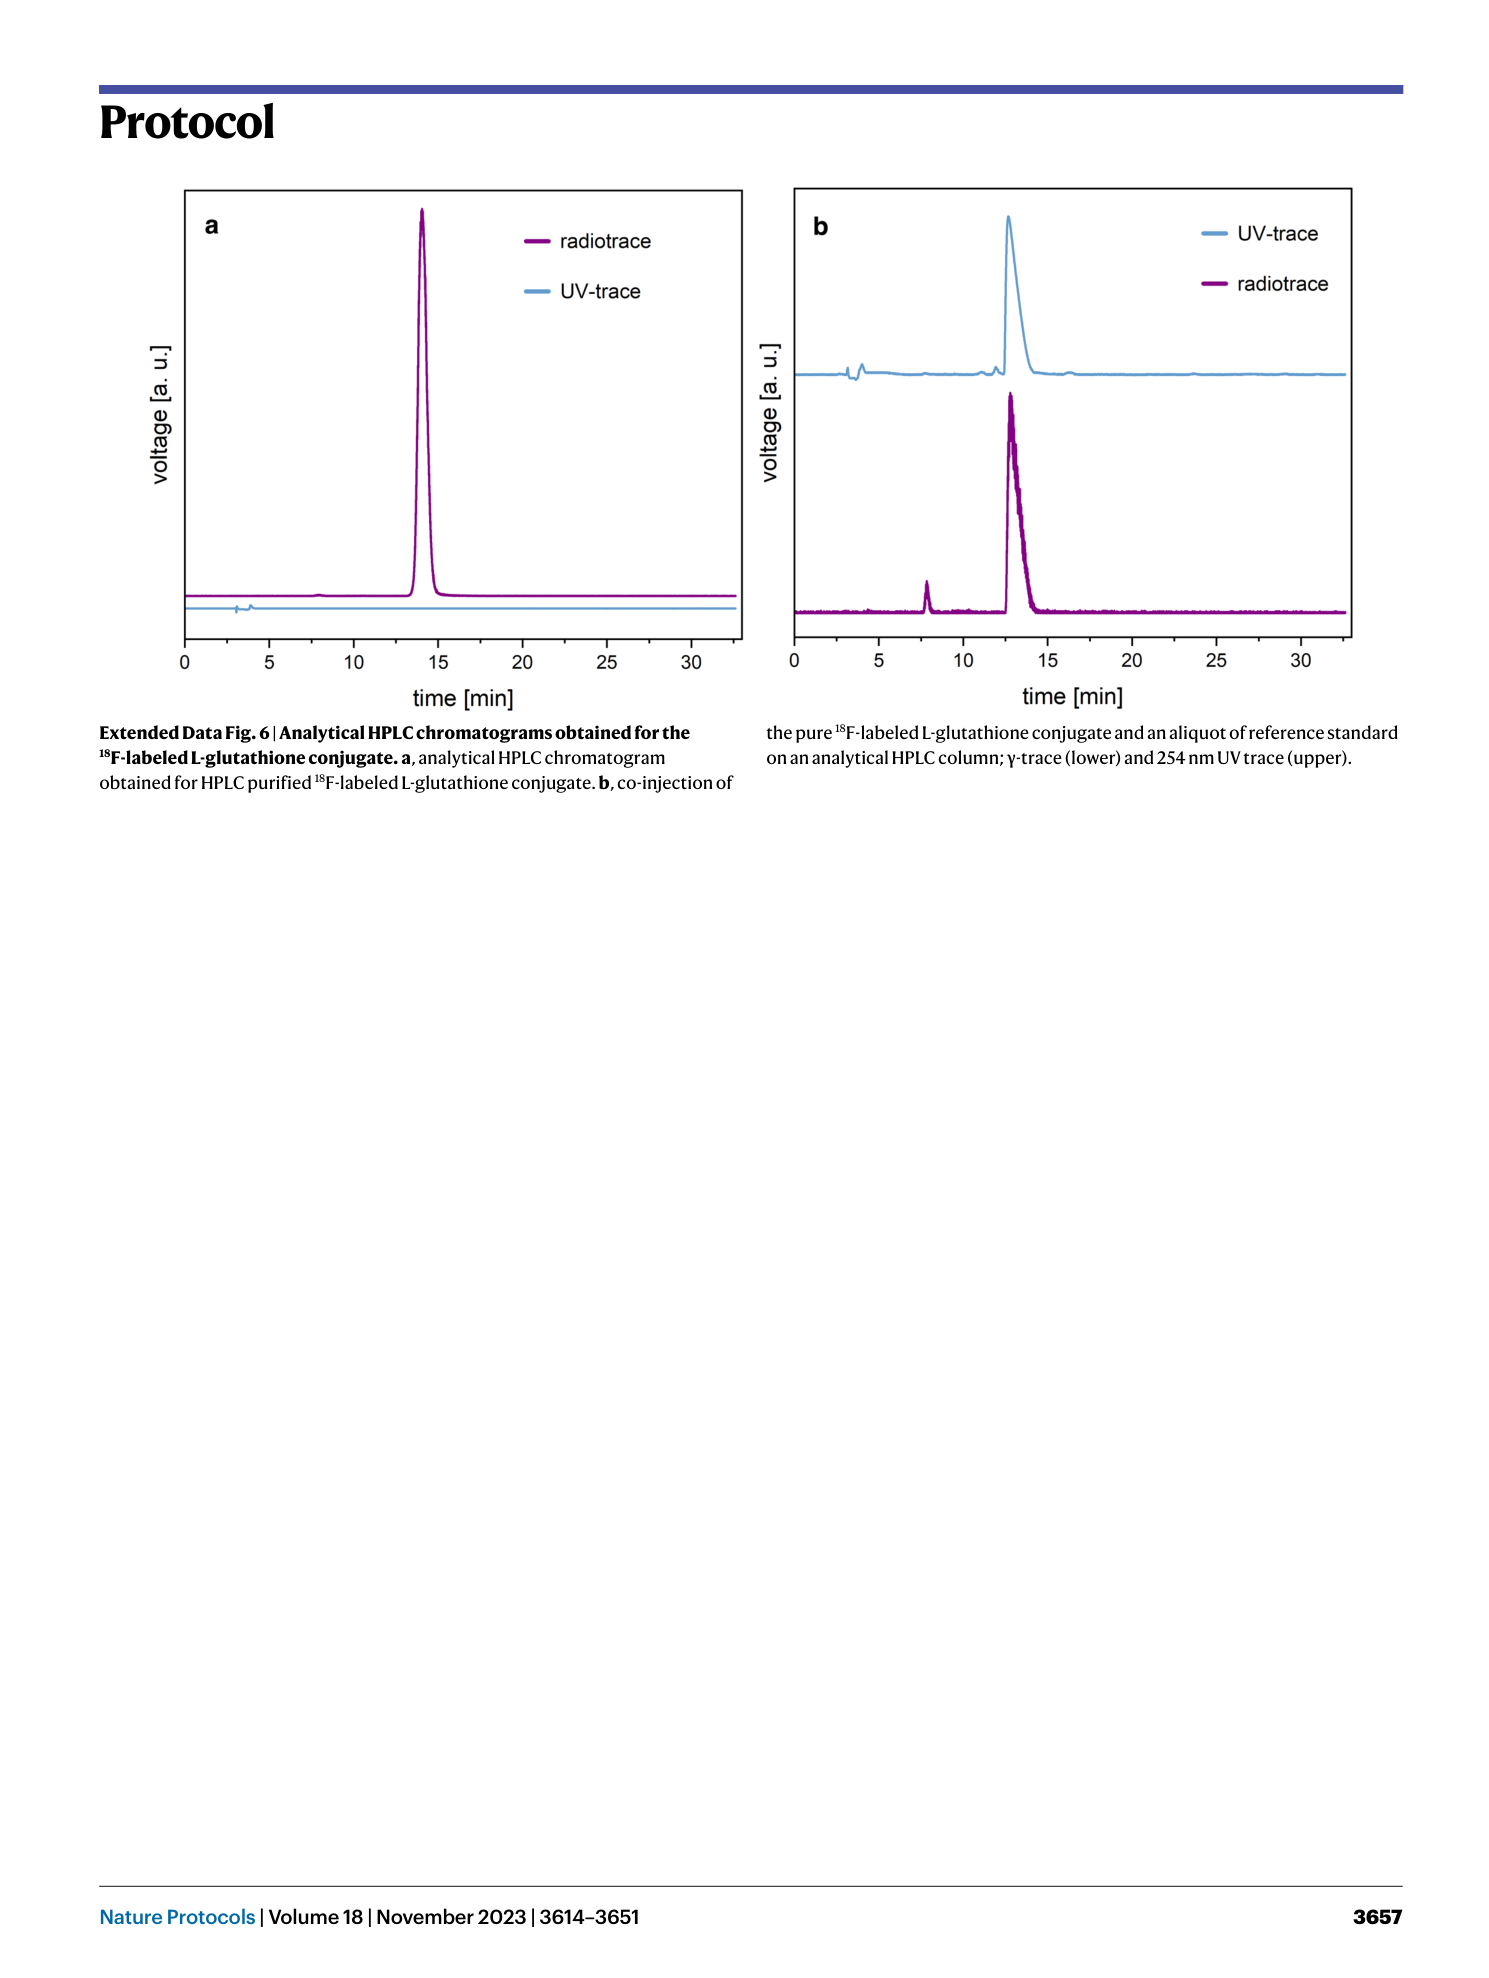
Extended Data Fig. 6 Analytical HPLC chromatograms obtained for the 18 F-labeled L-glutathione conjugate.
a , analytical HPLC chromatogram obtained for HPLC purified 18 F-labeled L-glutathione conjugate. b , co-injection of the pure 18 F-labeled L-glutathione conjugate and an aliquot of reference standard on an analytical HPLC column; γ-trace (lower) and 254 nm UV trace (upper).
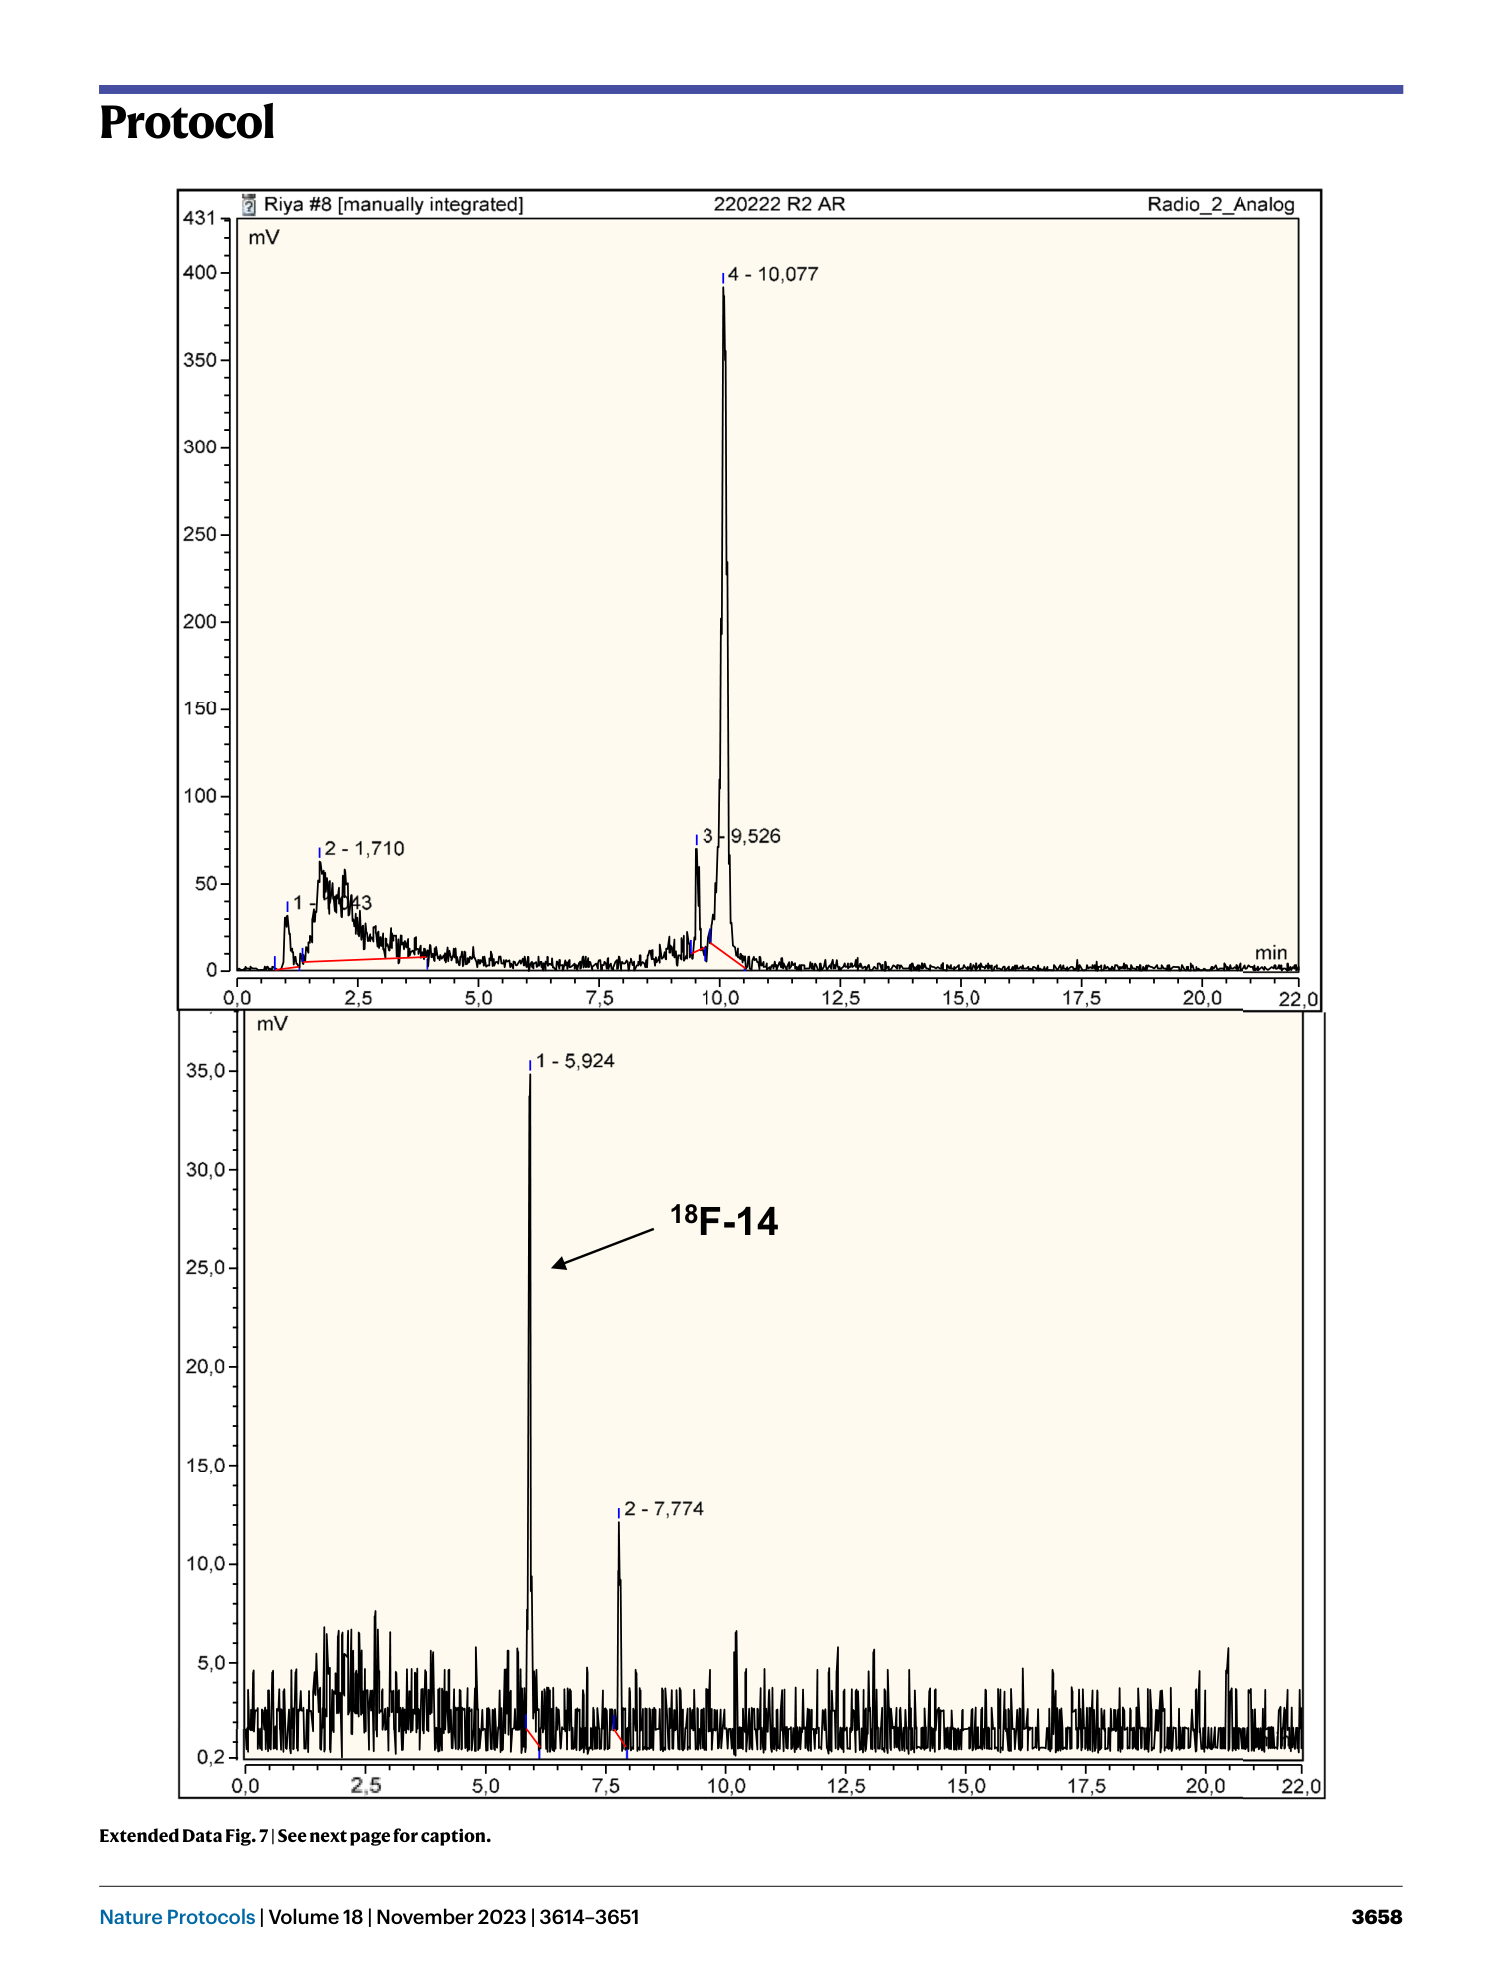
Extended Data Fig. 7 Radiotrace of the reaction mixture obtained by manual synthesis (column 1).
Top: reaction mixture prior to the cleavage step. Bottom: reaction mixture after the cleavage step.
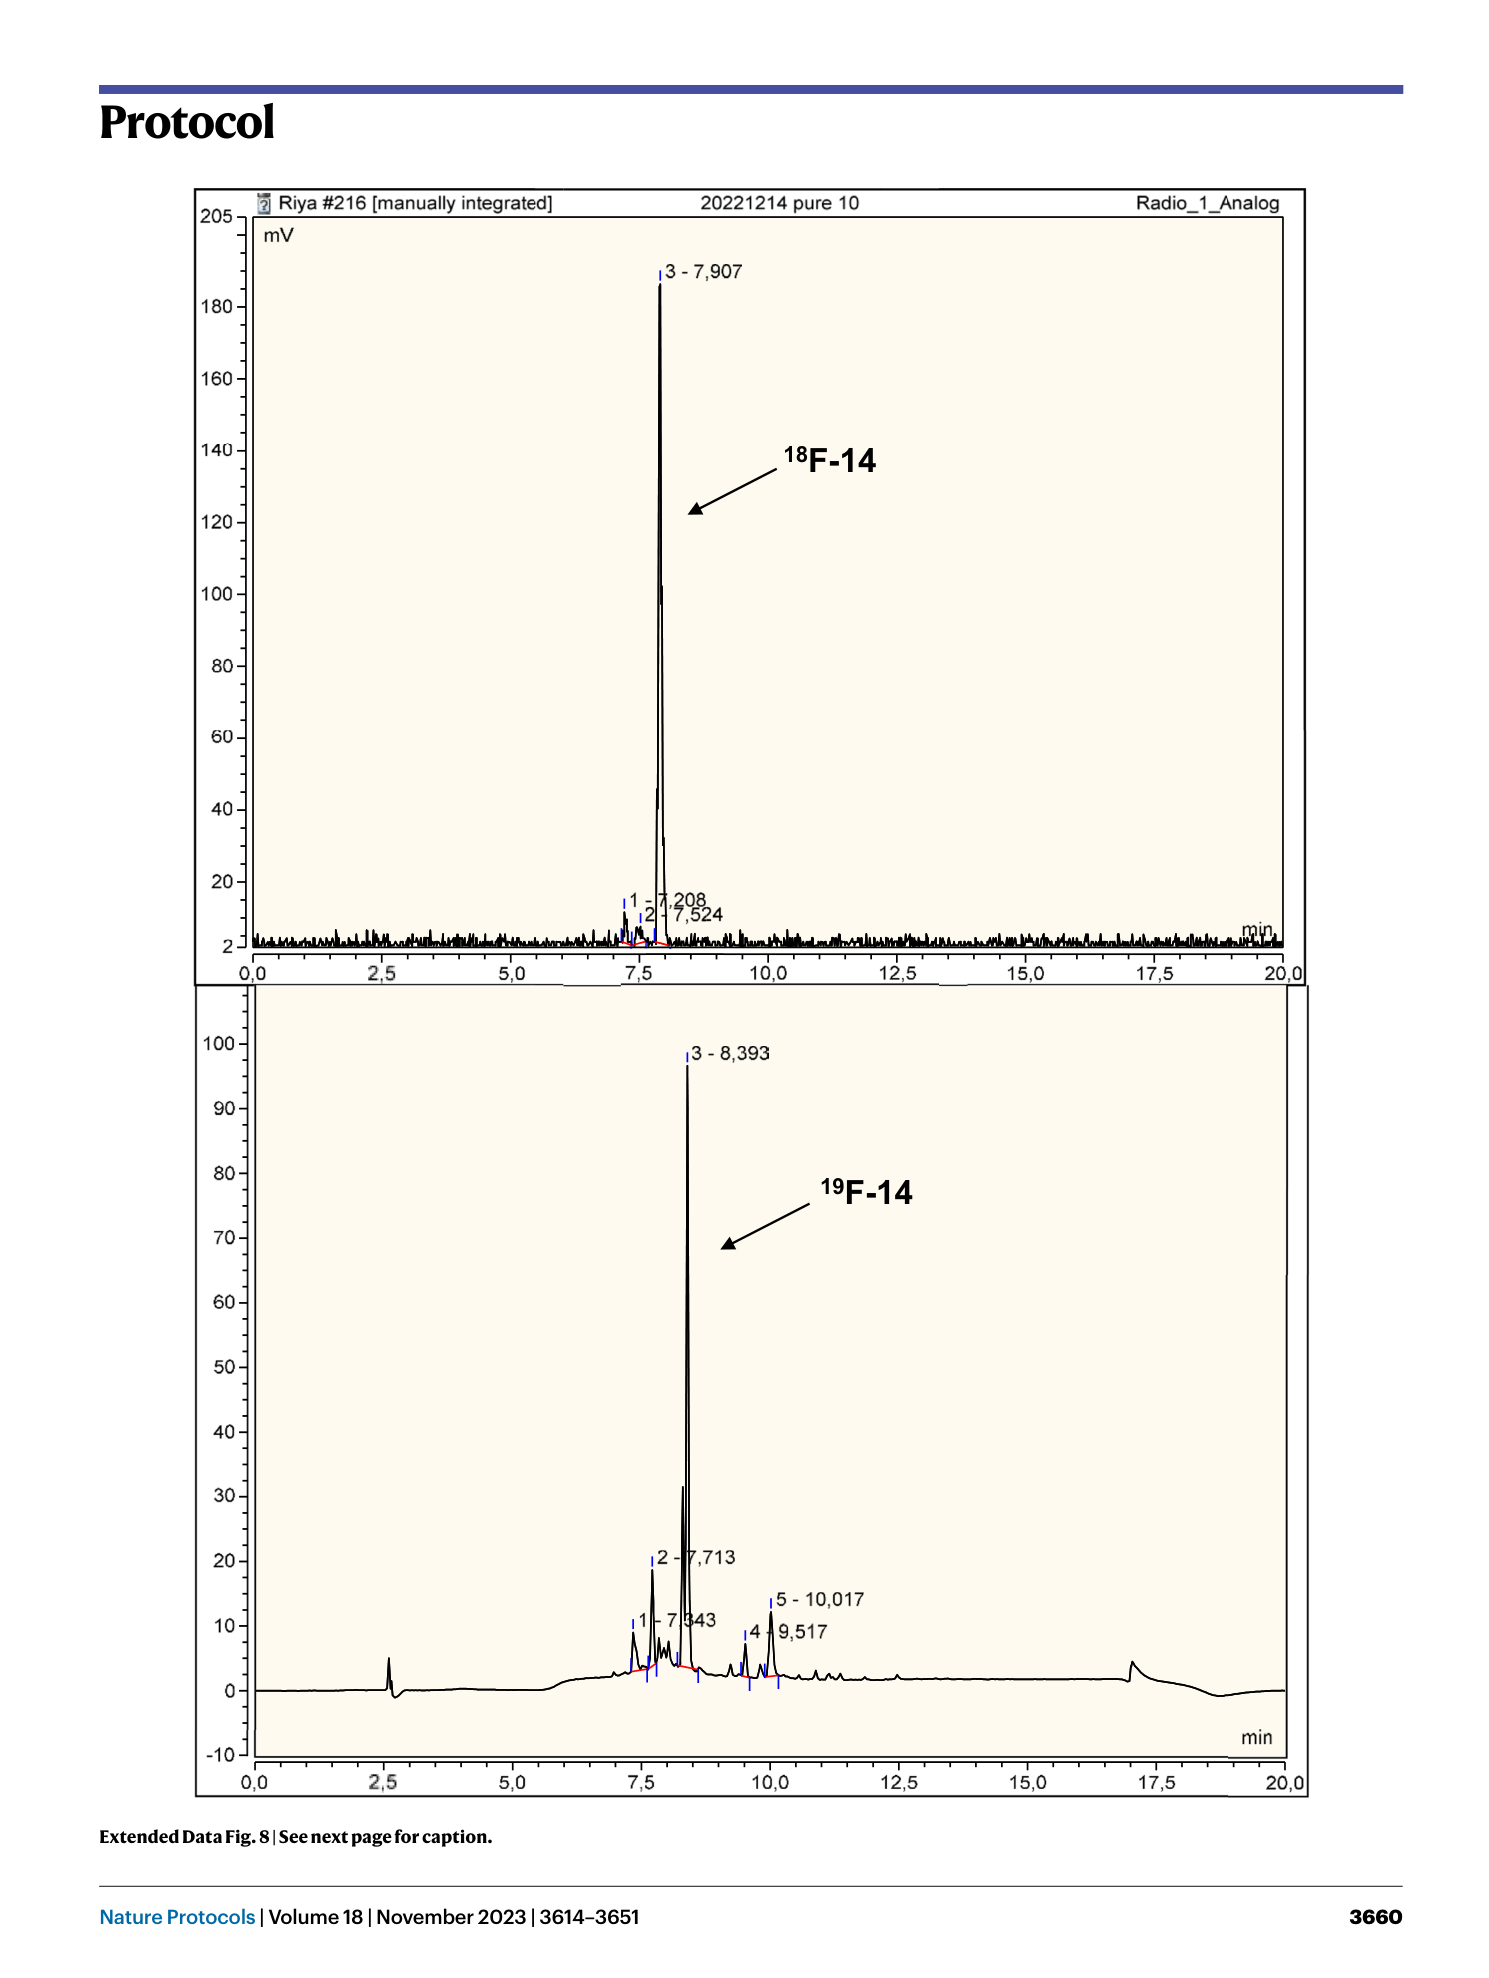
Extended Data Fig. 8 Comparison of HPLC radiotrace of H-Leu-Phe(4-[ 18 F]F)-Glu-Met-Lys-NH 2 obtained by manual synthesis with UV-trace (290 nm) of authentic reference (column 2).
Upper: radiotrace of 18 F-14 obtained by manual synthesis (radiochemical purity = 96%), lower: UV-trace of authentic reference standard 19 F-14 monitored at 290 nm, The spatial separation between the diode array detector and the radioactivity detector introduces a delay that results in an offset of ~0.5 minutes between corresponding peaks in the radiochromatogram and UV-chromatogram.
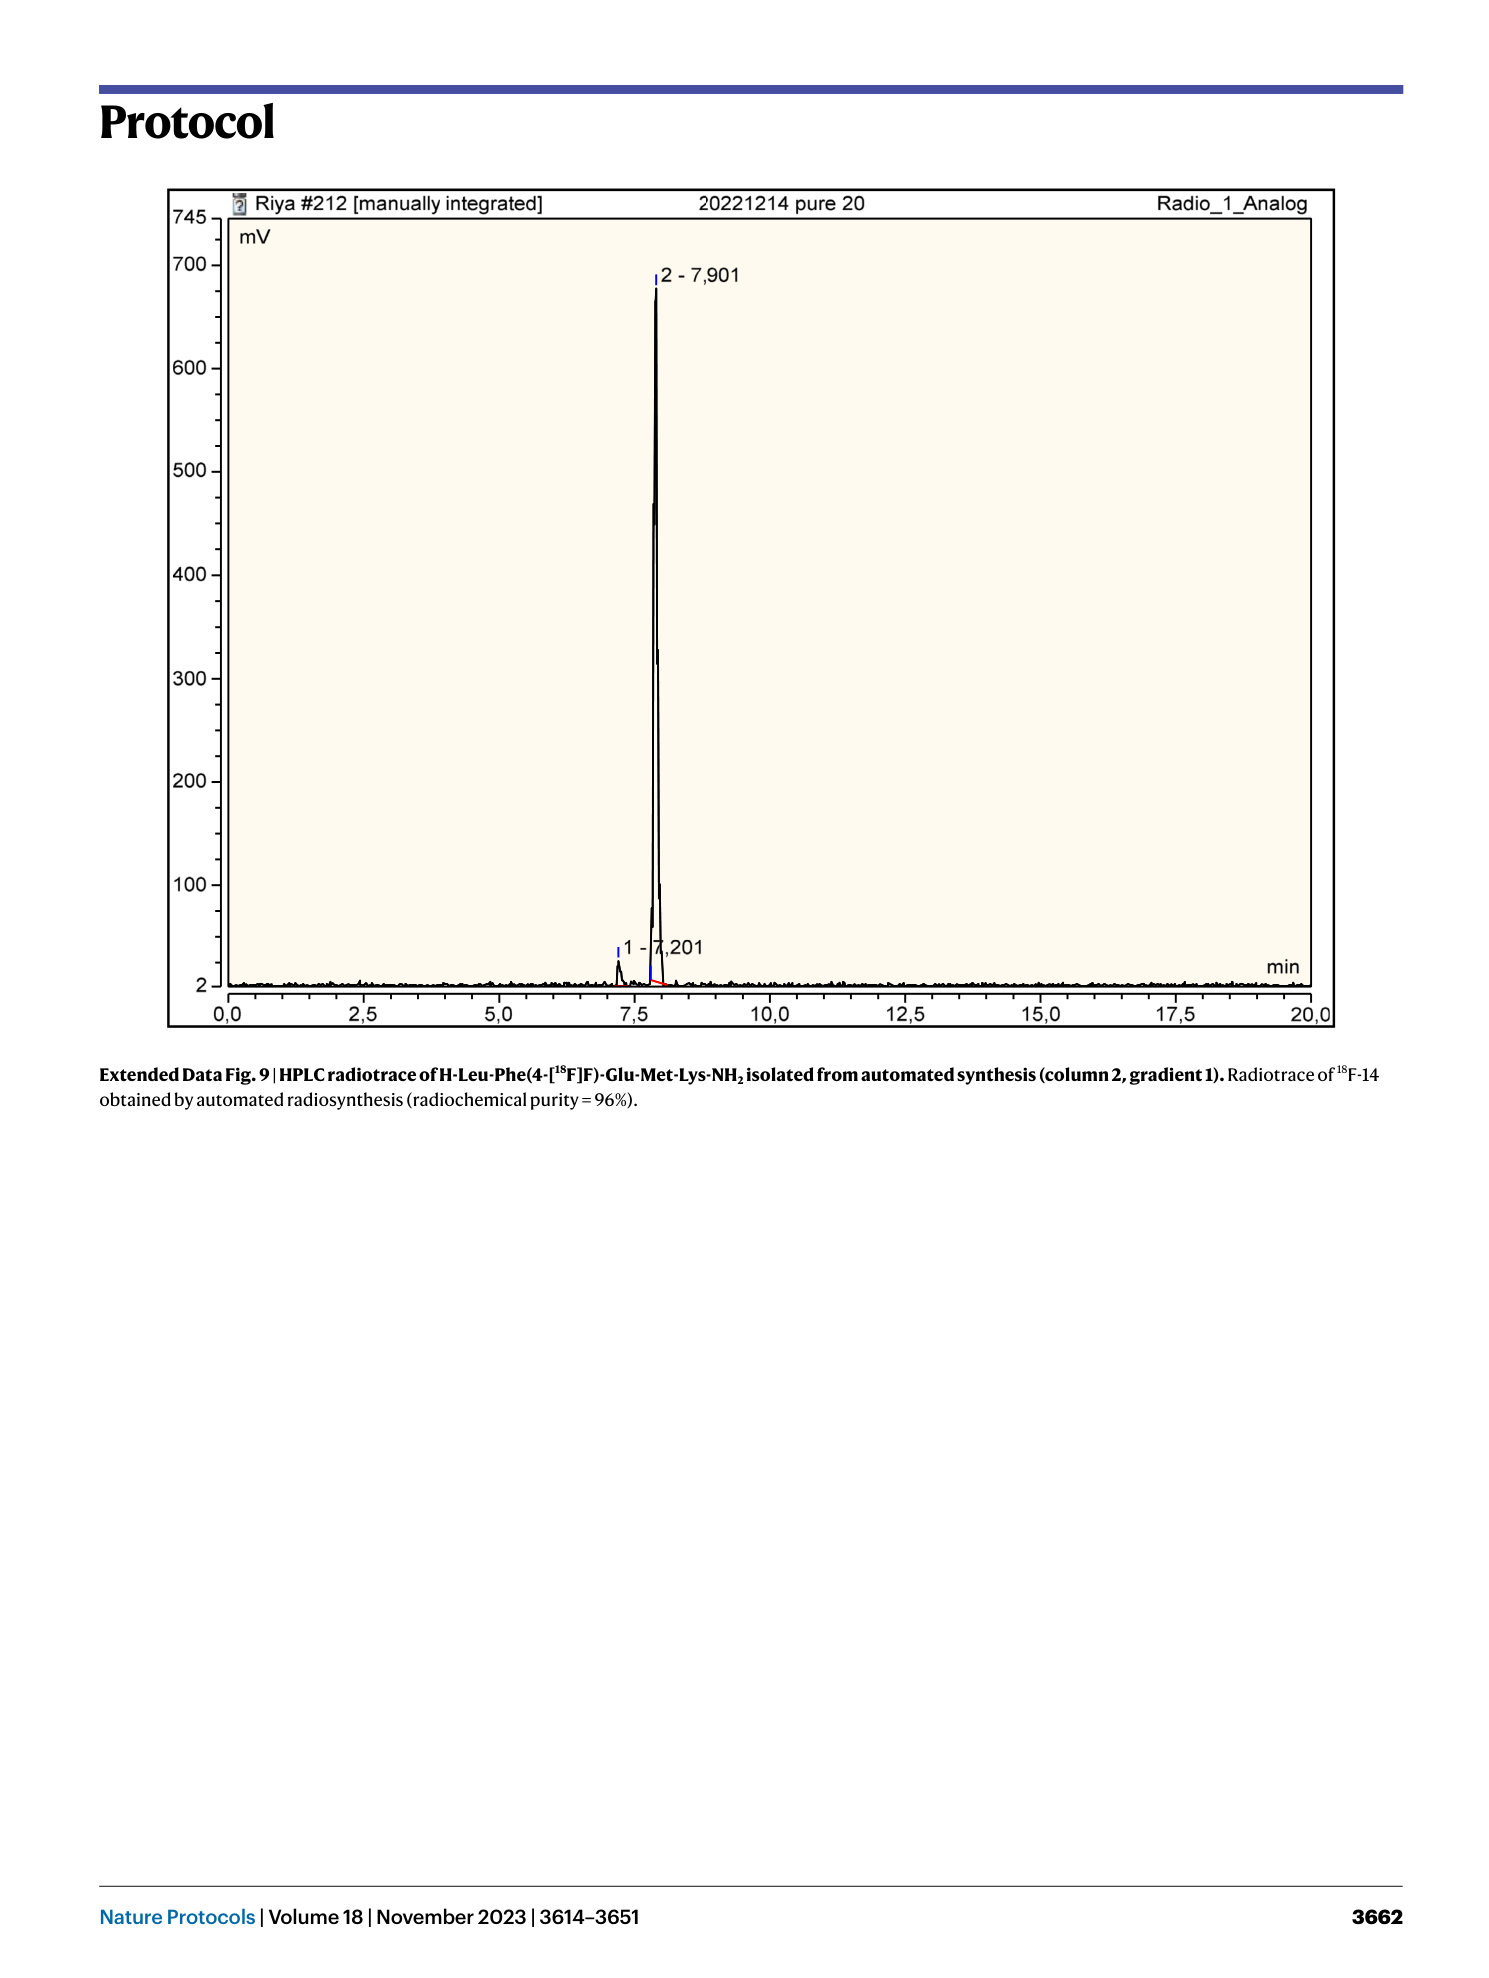
Extended Data Fig. 9 HPLC radiotrace of H-Leu-Phe(4-[ 18 F]F)-Glu-Met-Lys-NH 2 isolated from automated synthesis (column 2, gradient 1).
Radiotrace of 18 F-14 obtained by automated radiosynthesis (radiochemical purity = 96%).
