Automated Motion Tracking and Data Extraction for Red Blood Cell Biomechanics
Arun Kumar, Arun Kumar, Brendan R. Schmidt, Brendan R. Schmidt, Zyrina Alura C. Sanchez, Zyrina Alura C. Sanchez, Feyza Yazar, Feyza Yazar, Ronald W. Davis, Ronald W. Davis, Anand K. Ramasubramanian, Anand K. Ramasubramanian, Amit K. Saha, Amit K. Saha
automation
biomechanics
cytometry
deformability
image processing
Image-Pro
microfluidics
motion tracking
red blood cells
data extraction
Abstract
Red blood cell biomechanics can provide us with a deeper understanding of macroscopic physiology and have the potential of being used for diagnostic purposes. In diseases like sickle cell anemia and malaria, reduced red blood cell deformability can be used as a biomarker, leading to further assays and diagnoses. A microfluidic system is useful for studying these biomechanical properties. We can observe detailed red blood cell mechanical behavior as they flow through microcapillaries using high-speed imaging and microscopy. Microfluidic devices are advantageous over traditional methods because they can serve as high-throughput tests. However, to rapidly analyze thousands of cells, there is a need for powerful image processing tools and software automation. We describe a workflow process using Image-Pro to identify and track red blood cells in a video, take measurements, and export the data for use in statistical analysis tools. The information in this protocol can be applied to large-scale blood studies where entire cell populations need to be analyzed from many cohorts of donors. © 2020 The Authors.
Basic Protocol 1 : Enhancing raw video for motion tracking
Basic Protocol 2 : Extracting motion tracking data from enhanced video
INTRODUCTION
Erythrocytes, or red blood cells (RBCs), have the task of transporting oxygen and carbon dioxide around the body. Although RBC characteristics vary based on health, genetics, sex, and age, they must still perform the same biological functions efficiently. RBCs are ubiquitous in the body and slight defects in them can propagate into major ailments. Altered mechanical characteristics in RBCs, for example, can be used as biomarkers for some diseases. There is tremendous value in studying RBC biomechanics efficiently and accurately, because this can help us better understand the etiology behind major medical conditions (Lee & Lim, 2007).
In patients suffering from diseases like sickle cell anemia and chronic fatigue syndrome, RBCs have been shown to be less deformable, possibly reducing their capability to oxygenate tissues in the body (Alapan, Matsuyama, Little, & Gurkan, 2016; Saha et al., 2019). During their lifetimes, RBCs must travel through microvasculature where capillaries may be smaller in diameter than the cells themselves (Sinha, Chu, Dao, & Chandramohanadas, 2015; Tomaiuolo, Lanotte, Dapolito, Cassinese, & Guido, 2016). In order to do so, they undergo large, reversible deformations. Cells affected by diseases can have poor membrane hydration and cytoskeletal changes (Huisjes et al., 2018). These factors can lead to irregular membrane shapes, poor oxygen carrying capacity, and premature removal by the spleen. Studying the biomechanics of RBCs can provide extensive insight on their behavior as they flow through capillaries in vivo and how abnormalities can affect major physiological systems (Huisjes et al., 2018).
RBC deformability has been measured using various platforms; atomic force microscopy (AFM) and micropipet aspiration are two reliable methods in current literature (Alonso & Goldmann, 2003; Hochmuth, 2000). AFM uses a flexible cantilever to deform the cell's membrane and determine the elastic modulus (Alonso & Goldmann, 2003). While this is a sensitive test, it only tests a single cell at a time and large sample sizes are not feasible. Micropipet aspiration is another method in which a single cell is drawn into a glass tube smaller than the size of the cell (Hochmuth, 2000). The changes in shape and movement of the cell are used to make inferences about cell deformability. Again, this is a time-consuming process that is also prone to experimental errors.
Microfluidic devices are used to manipulate cells by flowing them through small (typically micron scale) channels, reservoirs, and other structures with a fine level of control (Whitesides, 2006). In our experiments, (Fig. 1A) the movement of the cells through channels is visualized at 40× magnification and recorded with a high-speed camera. This allows us to observe the dynamics of cells at micrometer precision, at intervals of thousandths of a second. We use a custom-made microfluidic device with channels that are wider (100 µm) near the inlet and get successively narrower until they significantly confine the RBCs (5 µm; Fig. 1B). The RBCs’ biomechanical behavior while flowing through these constrictions is used to determine deformability.
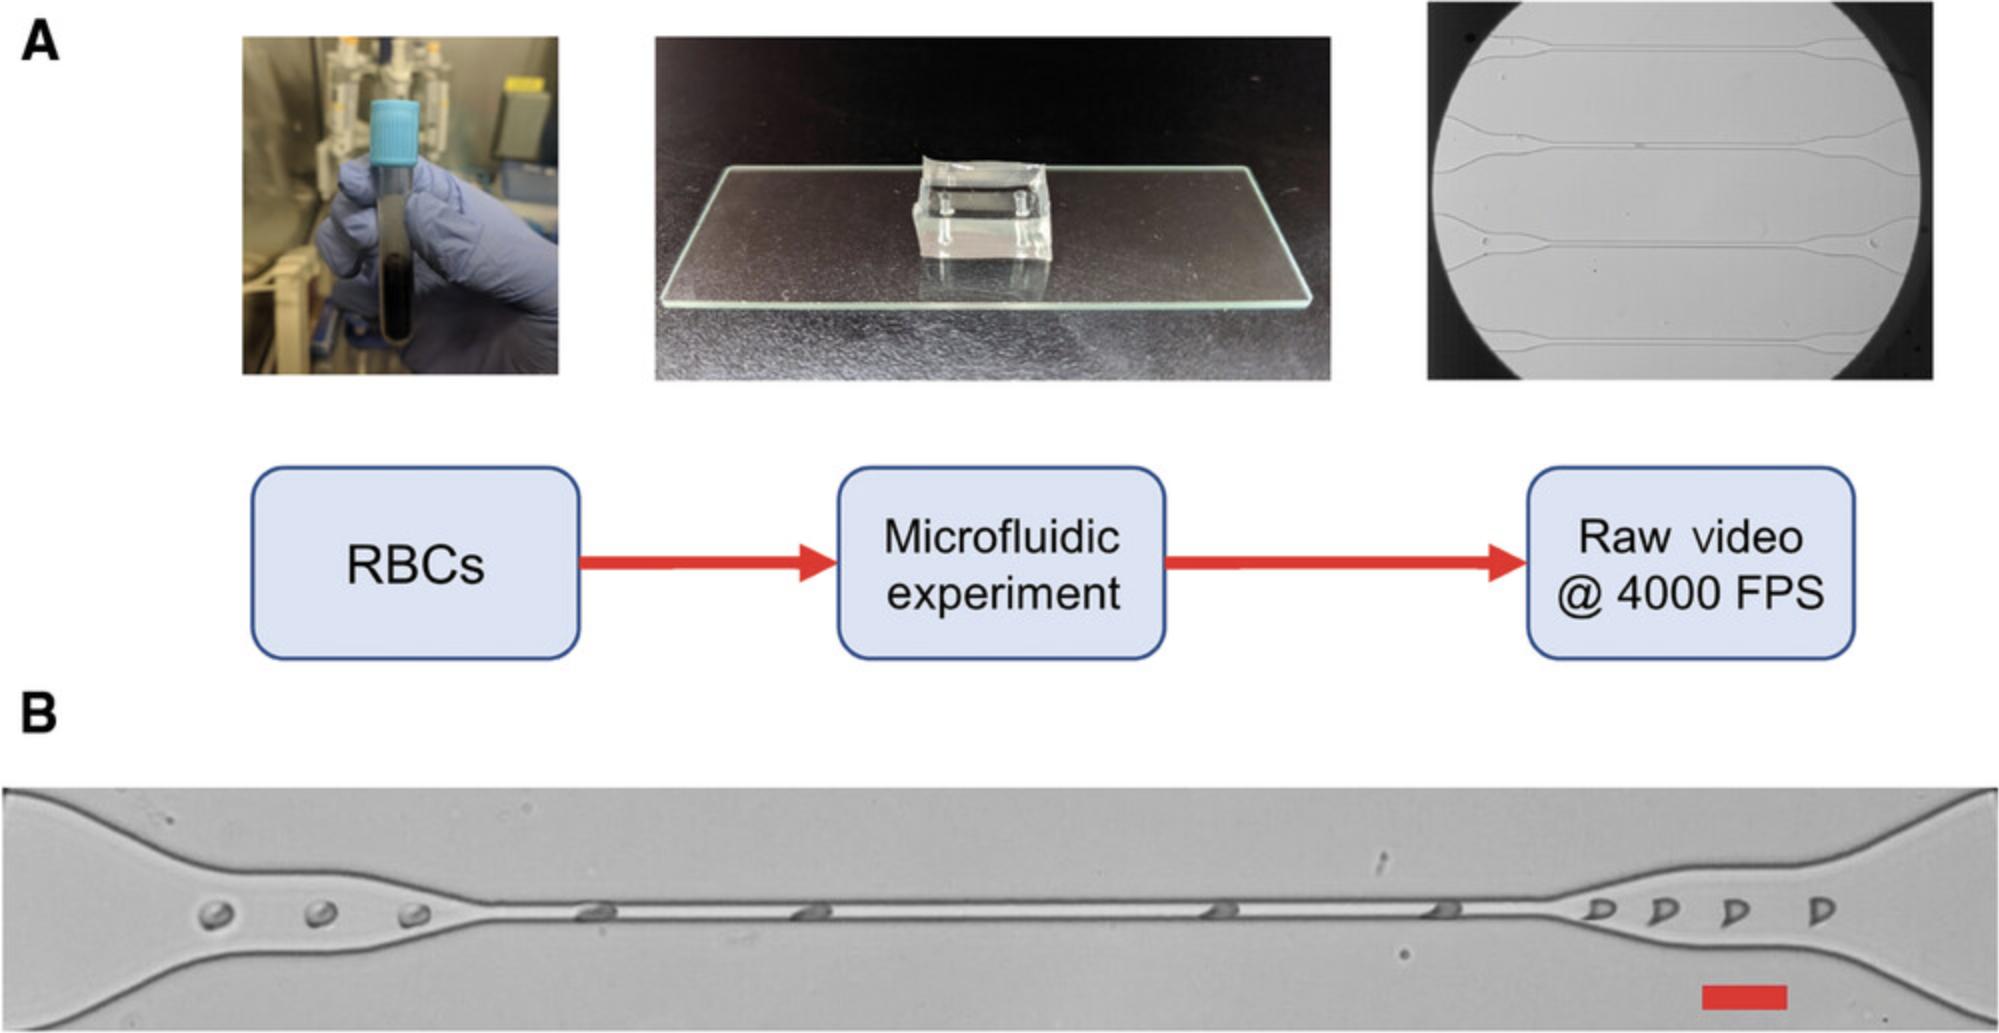
High-throughput acquisition and reproducibility are the biggest advantages of microfluidic systems. In our current setup, we use a custom vacuum-based system to induce a flow from the outlet. This enables us to require just a few microliters of a diluted sample which we perfuse directly in the inlet port. The vacuum-based system eliminates the need for additional tubing that may have dead volume, which is a typical problem in microfluidic systems. The devices themselves are very cheap, although the initial setup can be expensive. For more information on the microfluidic system, refer to its source article (Saha et al., 2019).
The high-speed camera generates large volumes of data from every microfluidic experiment and there is a need for automated image analysis to make the data extraction process more efficient. Image-Pro (Media Cybernetics) is a customizable image analysis platform that can be used to analyze medical or biological images expeditiously on a large scale (Learn Image-Pro, n.d.). The software has many capabilities that allow for two-dimensional motion tracking and segmentation. For each RBC imaged in our experimental videos, we can extract various parameters including instantaneous velocity, cell length, area, diameter, and circularity. Image-Pro also offers the option to create a macro for any image analysis protocol, allowing complex and multi-step procedures to be run with a single mouse click. In this protocol, we describe an automated method for extracting motion data from images of RBCs flowing through a microfluidic device. The data generated can be exported and plotted in MATLAB or any statistical analysis software.
NOTE : Consent of human subjects was obtained following San José State University's Institutional Review Board (IRB) policies (SJSU IRB-F16184).
Basic Protocol 1: ENHANCING RAW VIDEO FOR MOTION TRACKING
The following instructions provide an overview of how to remove static objects from the video, apply a filter, and adjust contrast for accurate cell shape analysis. Data can then be extracted from the video using the Motion Tracking feature in Basic Protocol 2.The microfluidic flow is visualized at 40× using a Leica DMi8 Inverted Microscope (Leica Microsystems). The video files used in this protocol are initially captured as .cine files using a Phantom 410-L camera (Vision Research) and are converted to high-quality .avi files for compatibility with Image-Pro 10. The videos are captured as 8-bit grayscale images.
Materials
- Windows 7 Professional and Ultimate 32- and 64-bit and/or Windows 8.0 and 8.1 Enterprise and Professional 32- and 64-bit (recommended: Windows 10 Enterprise and Professional 64-bit with 32 GB RAM or more)
- Image-Pro 10
- .avi videos of RBC flow
Motion detect subsampling
1.Open.avi file in Image-Pro 10.
2.Double click the red “Uncalibrated” text in the lower right corner to set the spatial calibration.

3.Under the Process tab, find the Subsample button. In its drop-down menu, select Average Global for Method and 15 for Size. Click on the Motion Detect button to generate the subsampled images.
Filter and adjust contrast
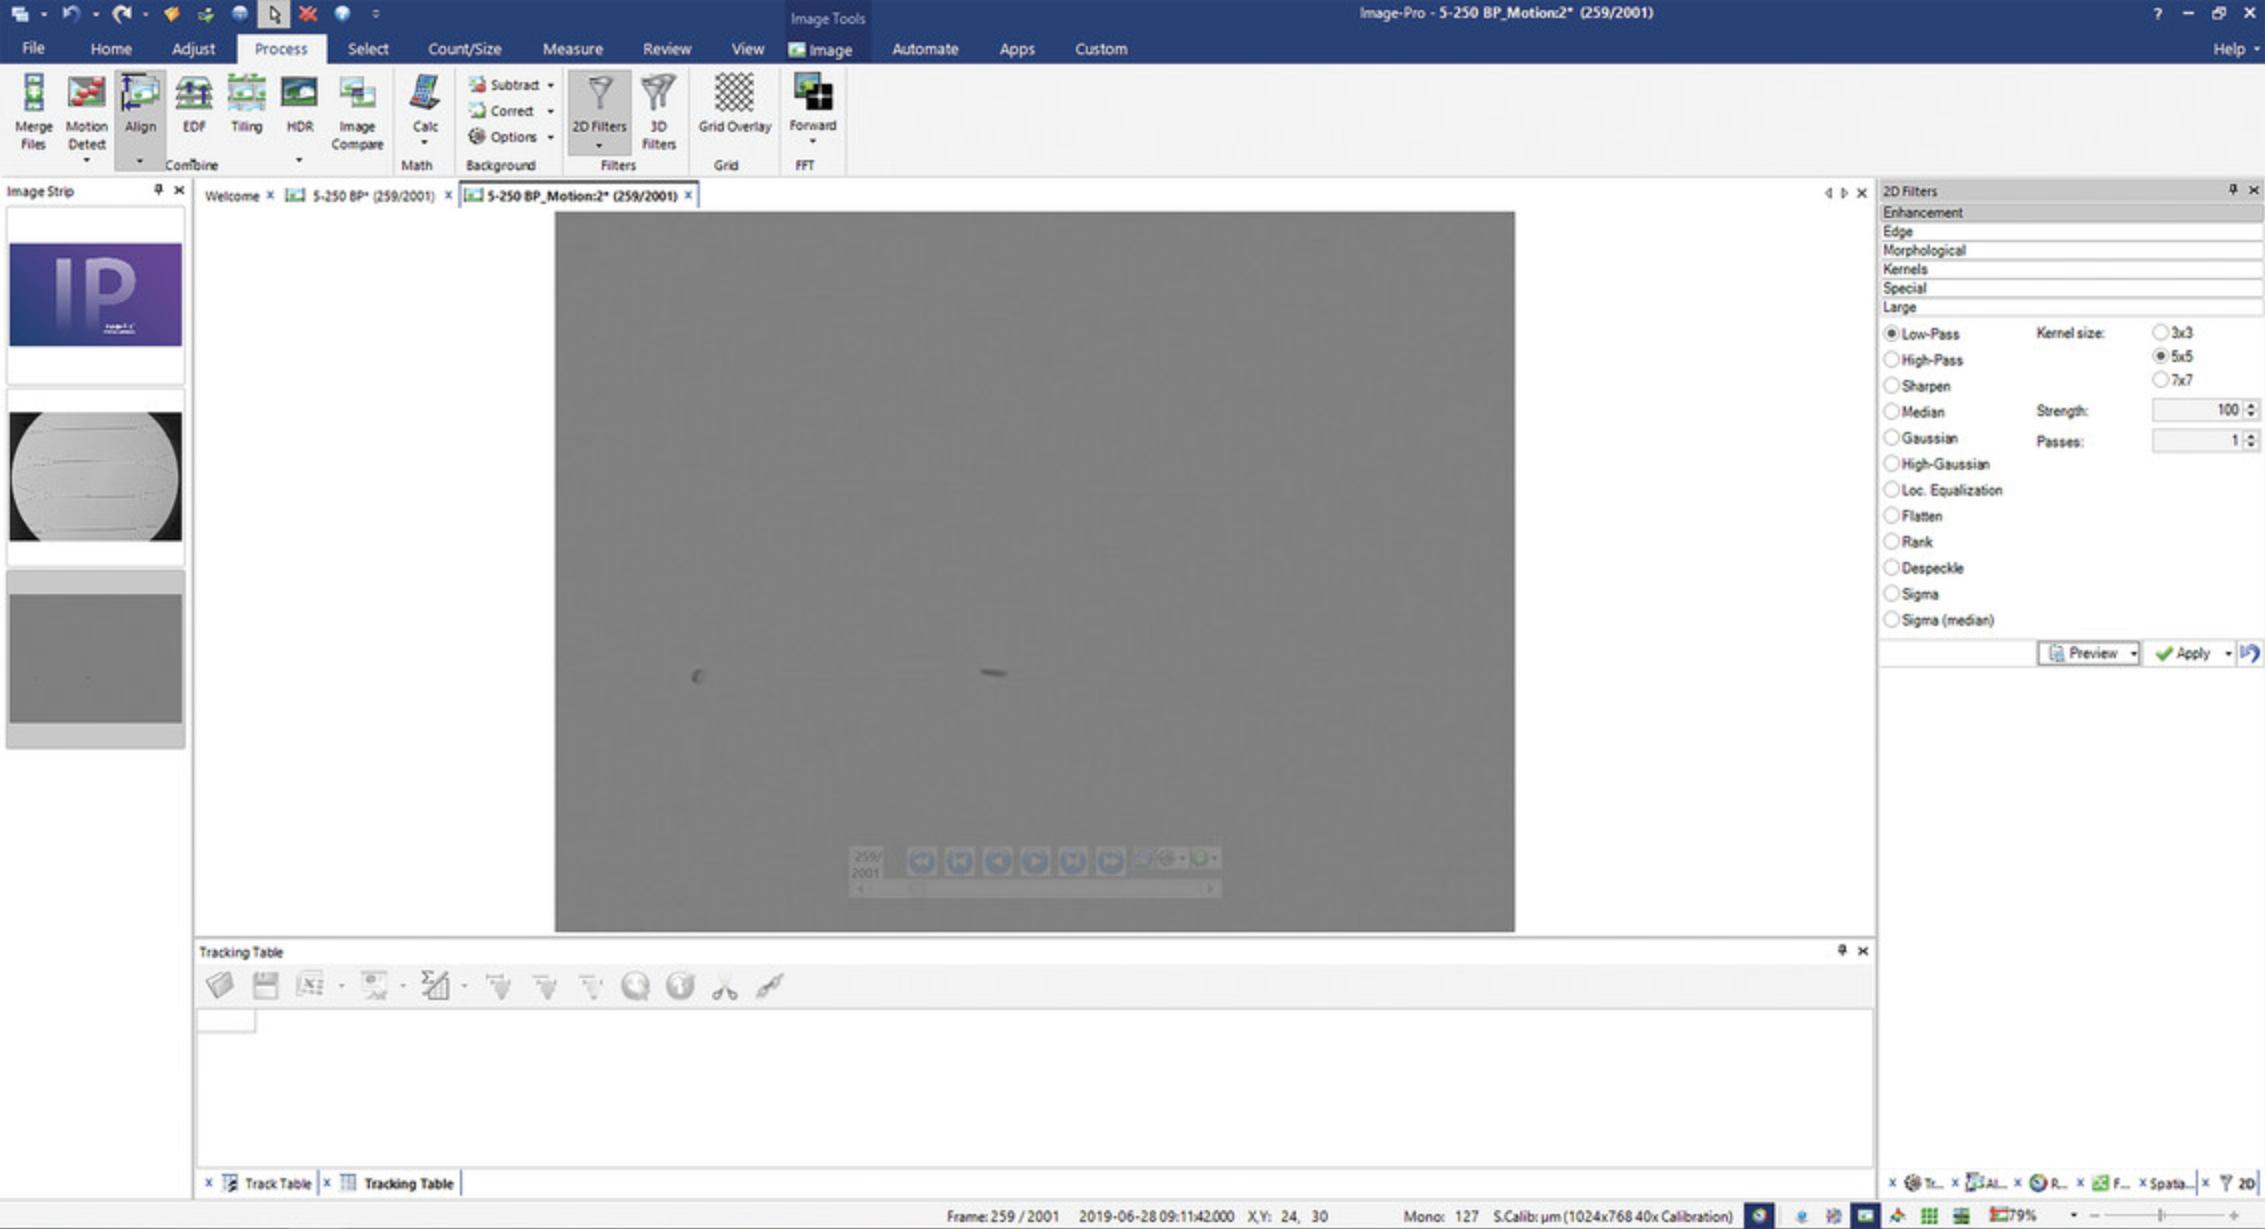
4.Under the Process tab, click on 2D Filters. Open Enhancements menu. Select Low-Pass filter, with Kernel size 5 × 5, Strength 100, and 1 Pass (Fig. 4). Click Apply.
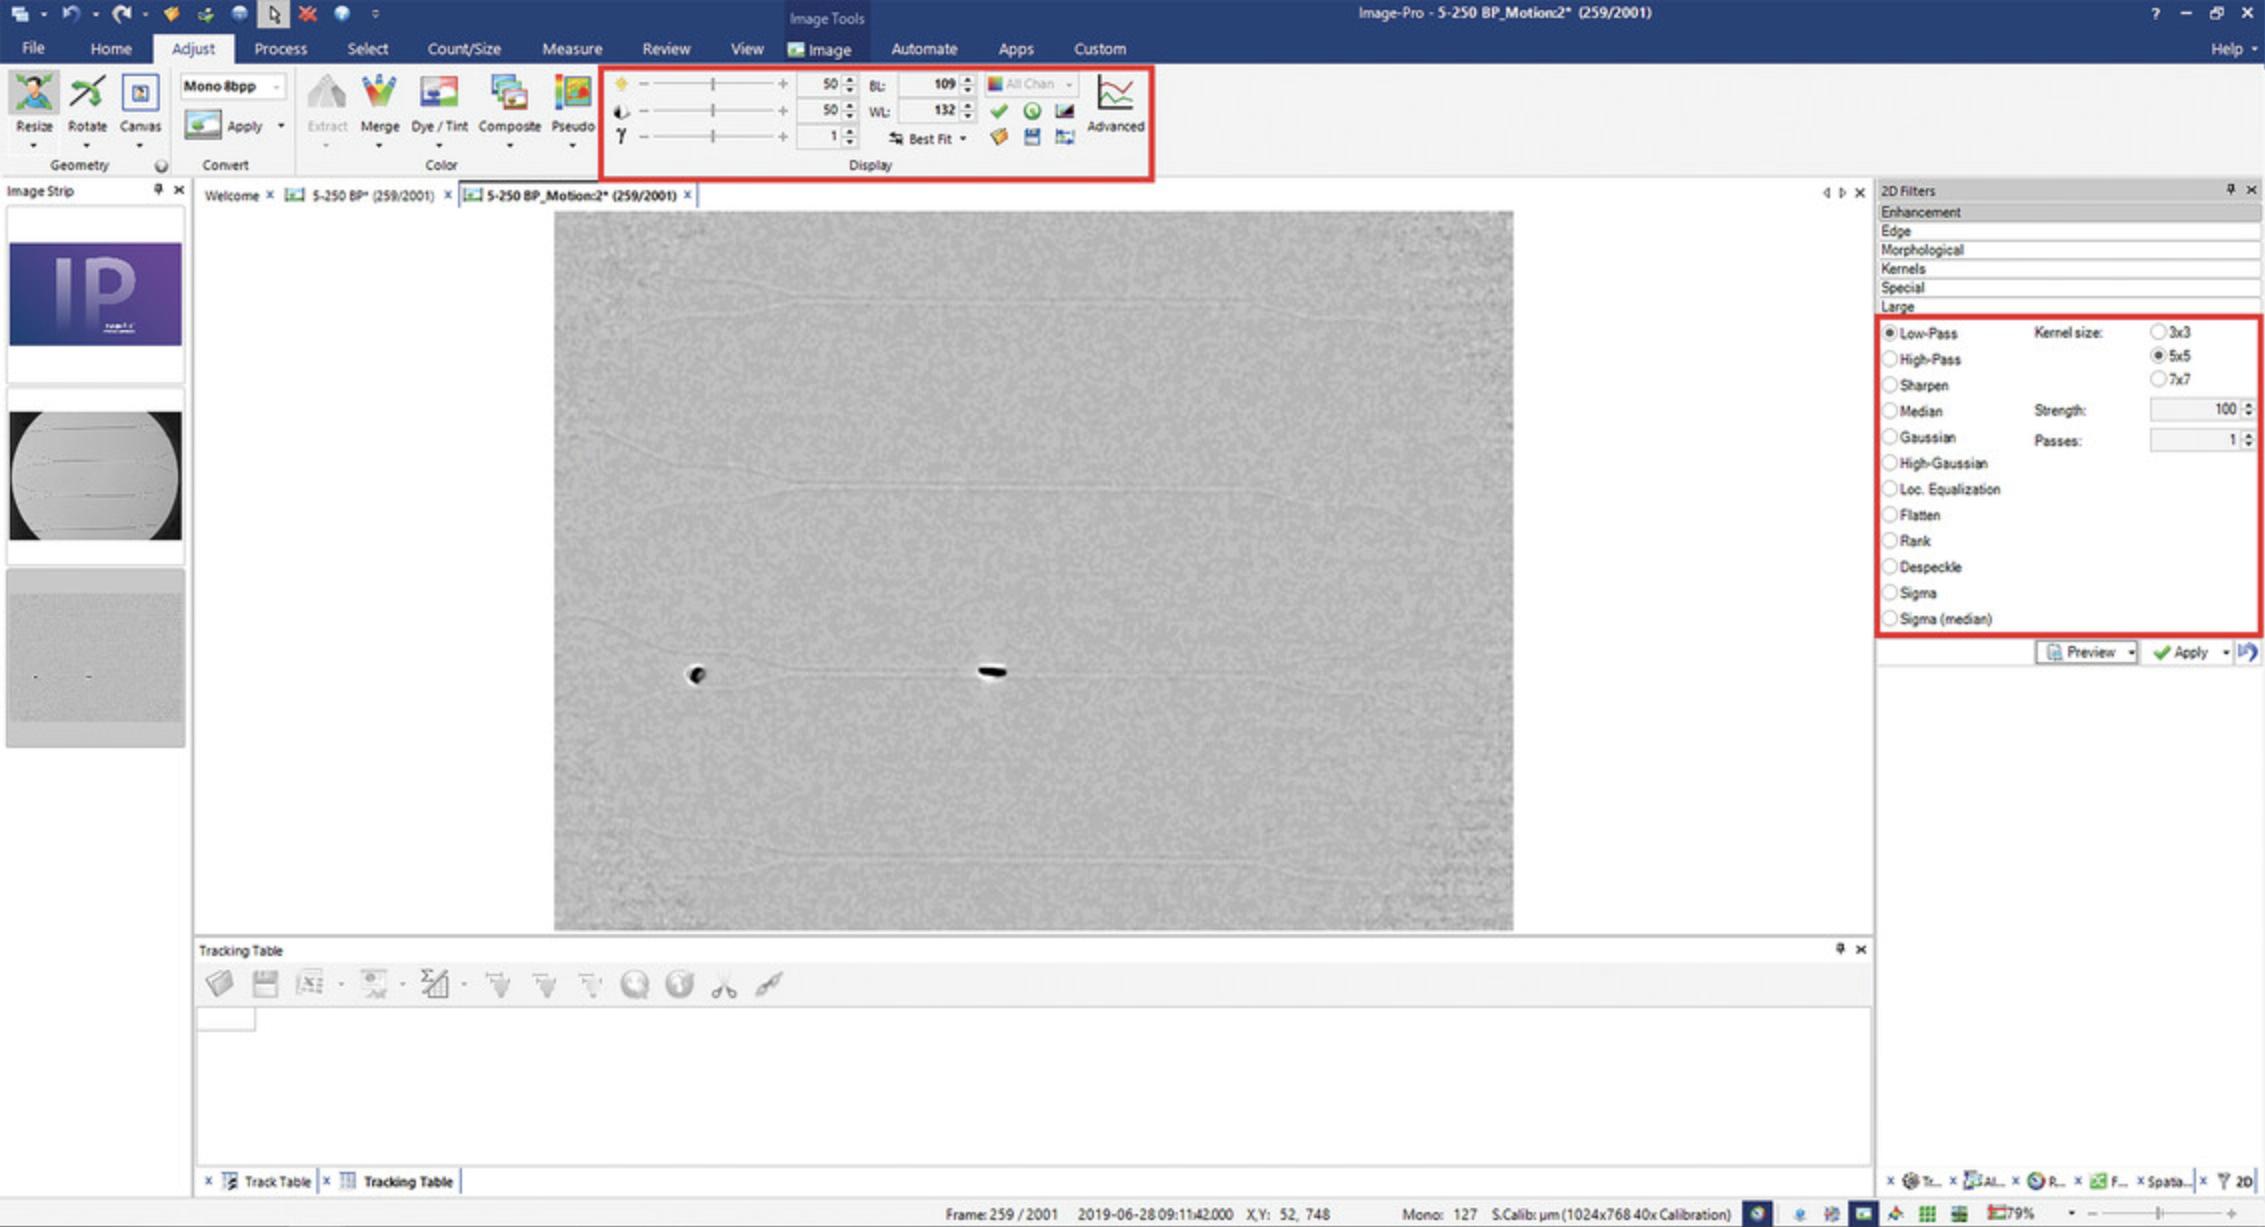
5.Under the Adjust tab, find Display section. Set Black Level (BL) to 109 and White Level (WL) to 132 (Fig. 4). Click Apply (checkmark button).
Basic Protocol 2: EXTRACTING MOTION TRACKING DATA FROM ENHANCED VIDEO
After the video has been enhanced for segmentation, the user can motion track the cells and extract a dataset. The following instructions provide an overview for selecting a Region of Interest (ROI), choosing tracking options, and exporting data. Finally, a macro can be created to execute all the steps listed.
Materials
- Windows 7 Professional and Ultimate 32- and 64-bit and/or Windows 8.0 and 8.1 Enterprise and Professional 32- and 64-bit (recommended: Windows 10 Enterprise and Professional 64-bit with 32 GB RAM or more)
- Image-Pro 10
- Enhanced images on Image-Pro (from Basic Protocol 1)
Select region of interest and tracking options
1.With the enhanced images from Basic Protocol 1 displayed, navigate to Select tab. In the Regions of Interest section, select Rectangle Tool. Draw a rectangular Region of Interest around the microfluidic channels (Fig. 5).

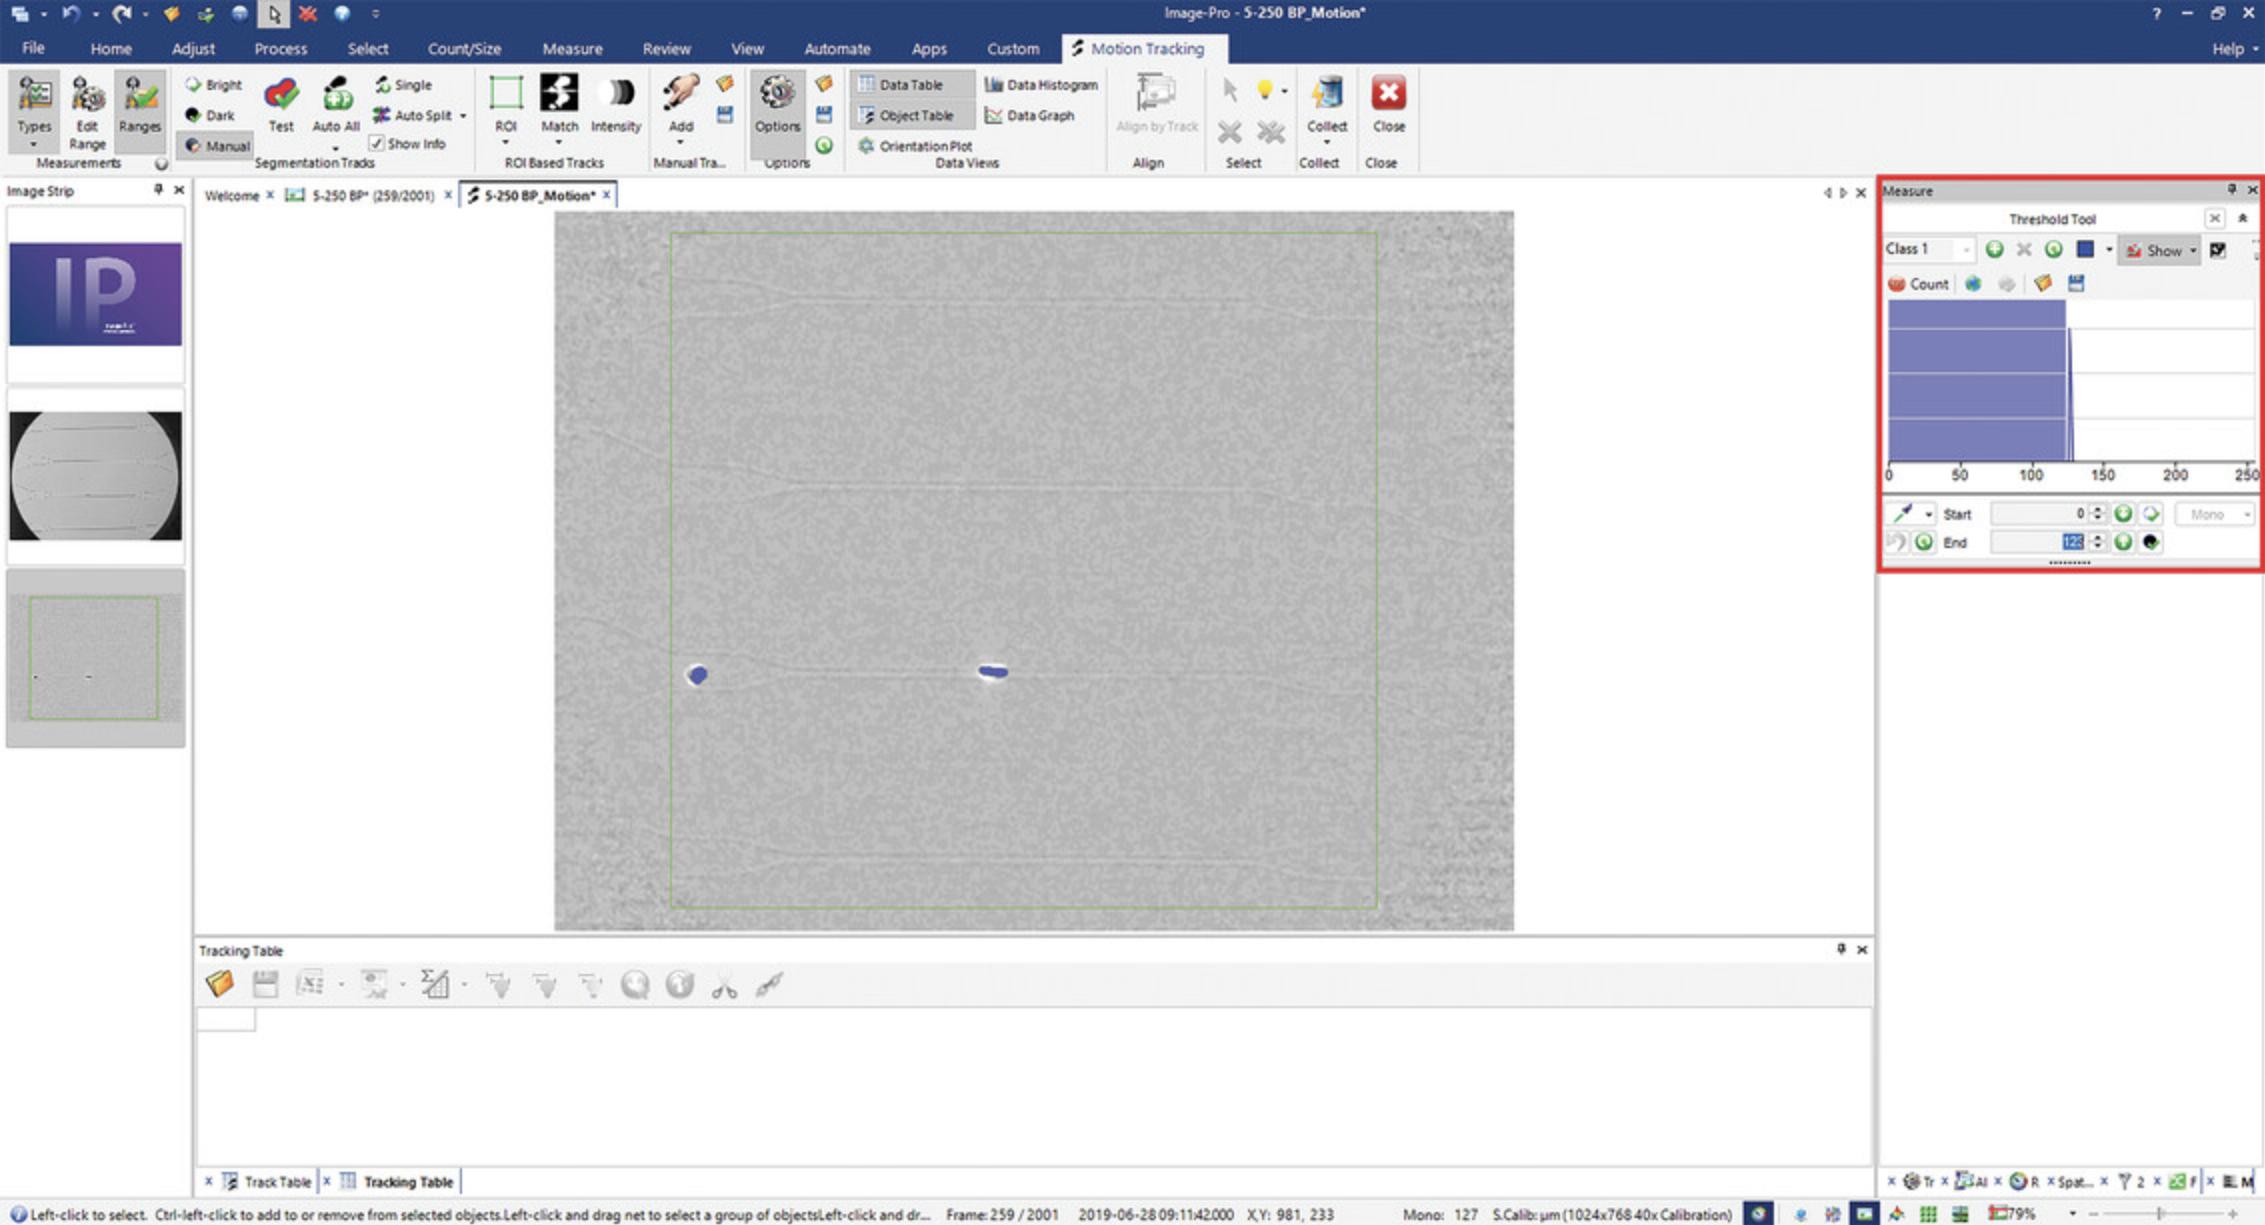
2.Under the Measure tab, click on Objects. The Motion Tracking tab will appear. In Segmentation Tracks section, click on the Manual button. In the Threshold Tool, set End value to 123 (Fig. 6).
3.Under the Motion Tracking tab, click on Types. Add Regions:Axis, Major, Tracking:Velocity, and Tracking:X Coord. Click on Edit Range. For Regions:Axis, Major, set Minimum and Maximum to 7 and 15, respectively (Fig. 7).

4.Click on Options in the Motion Tracking tab. Under the Auto Tracking section, set Minimum total track length to 600.
Begin auto tracking
5.Under the Motion Tracking tab, find Segmentation Tracks section. Click Auto All. Click Yes on the dialog box that appears, ensuring that the cells are outlined in red.
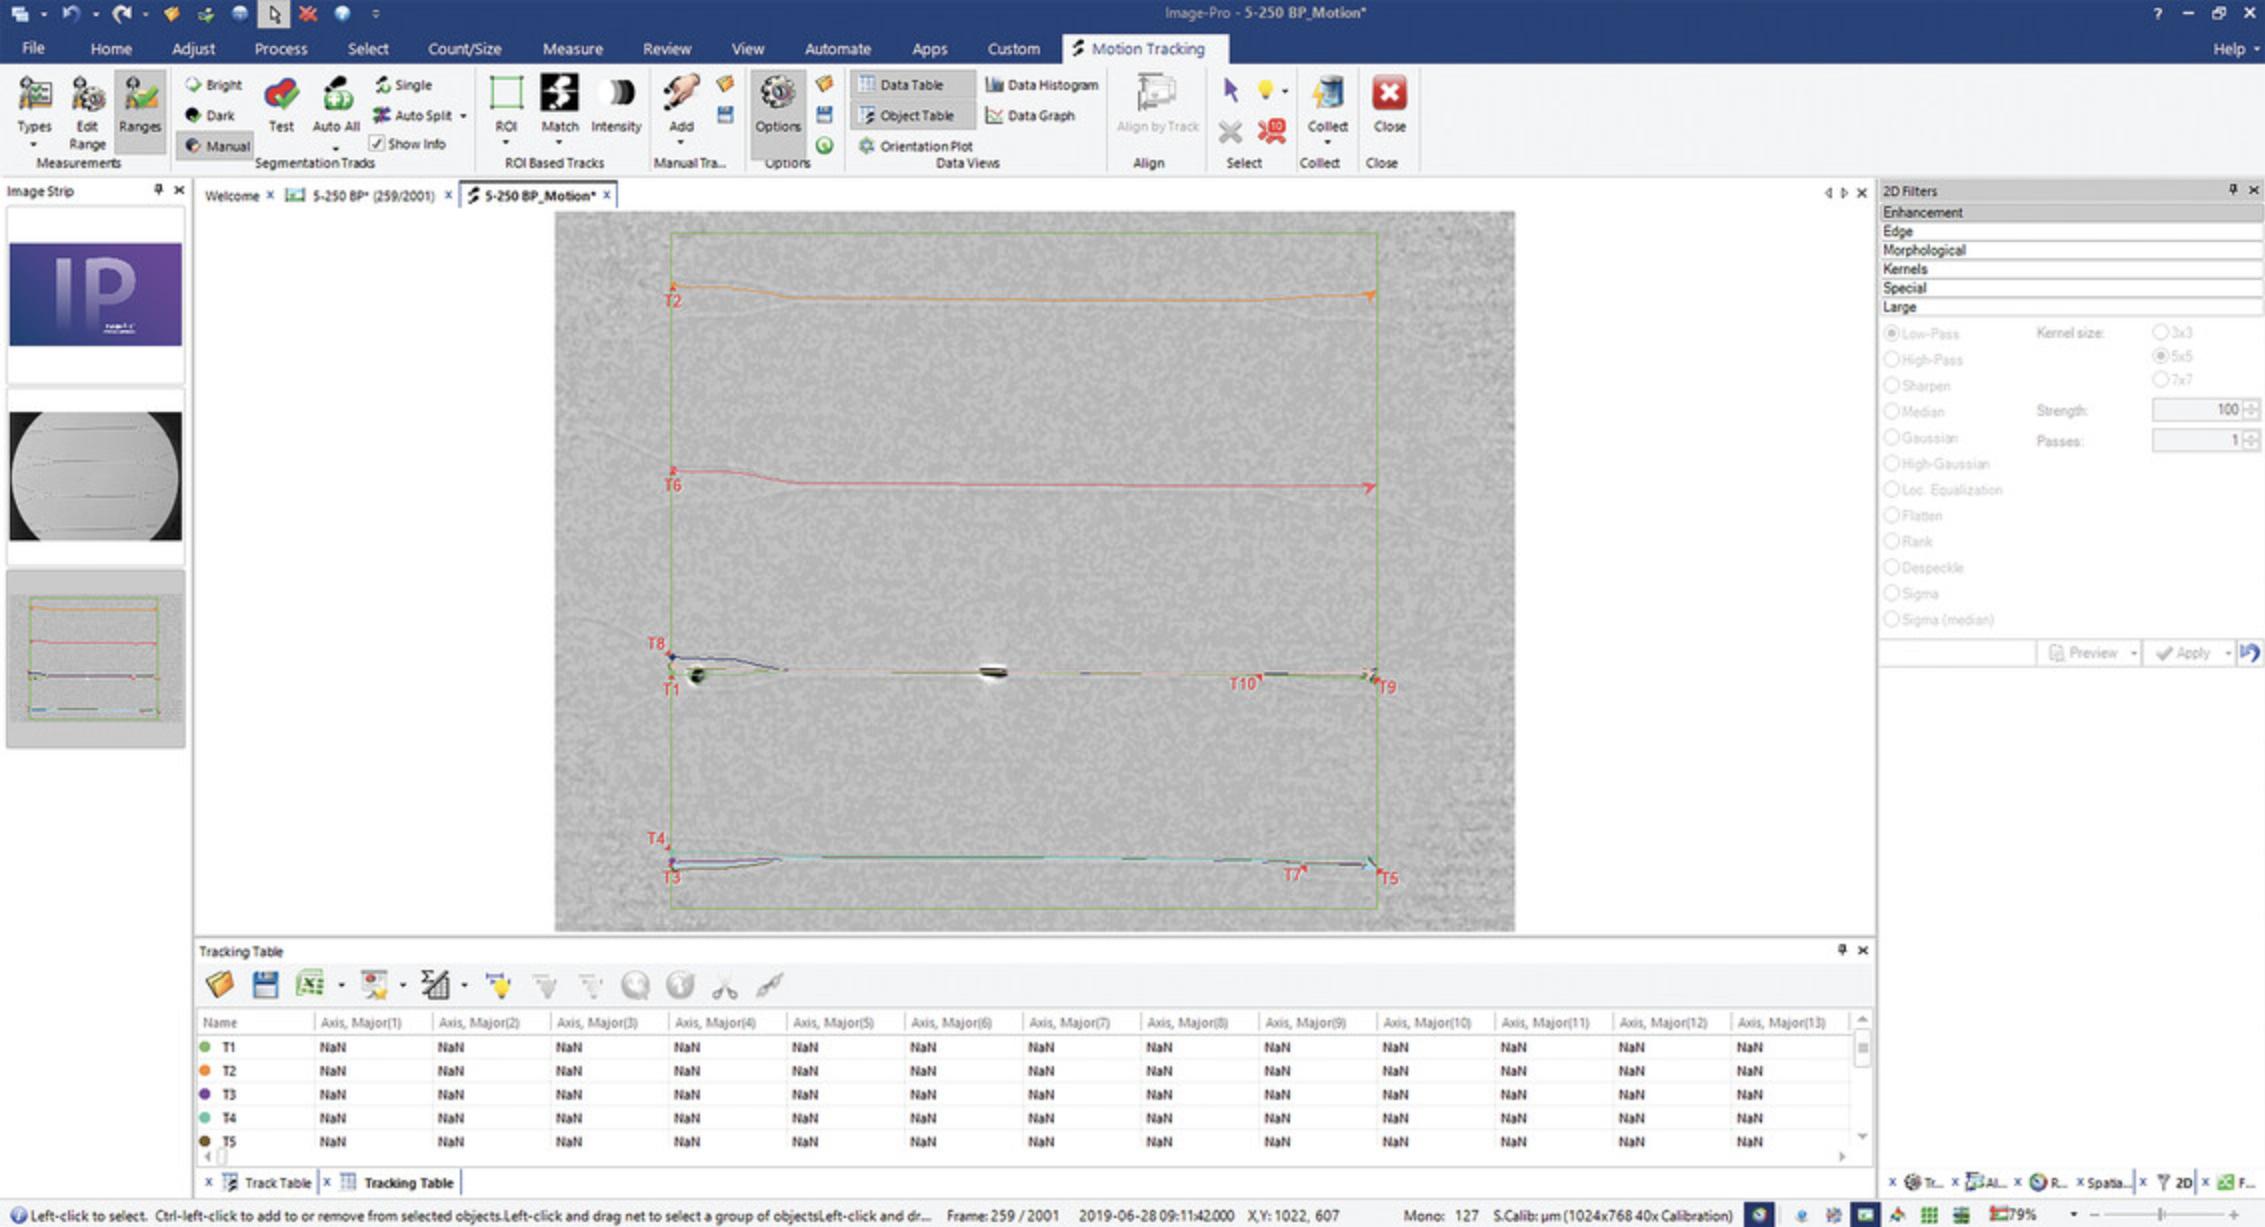
6.Under Data Views, click Data Table button. The data for all measurement types selected in step 3 are shown. Click on the arrow near the Excel icon and select a file format from the drop-down menu to export data.
Recording a macro
7.To automate the above steps, there is a Record Macro button under the Automate tab in Image-Pro that records the entire sequence and runs it with one click. A graphical user interface can also be created directly on Image-Pro for the macro, greatly increasing the ease of use for a user with little image processing experience.
COMMENTARY
Background Information
The experiments were conducted with RBCs isolated from whole blood of healthy individuals. Consent of human subjects was obtained following San José State University's Institutional Review Board (IRB) policies (SJSU IRB-F16184). The RBCs were diluted to 0.5% hematocrit in PBS with 0.01% glutaraldehyde and without glutaraldehyde (control). A 10-µl volume sample from each solution was separately perfused through the microfluidic device and a 2-psi pressure was applied to induce a flow. The fluid motion through the microcapillaries was recorded using high-speed photography at 40× magnification.
Using microfluidic systems to study RBC biomechanics has several advantages. Single cell analysis can be done rapidly with a very small blood sample. Unlike AFM and micropipet aspiration, high-throughput analyses are now possible. Another technique, ektacytometry, can be used to rapidly measure the deformability of thousands of cells. Ektacytometry analyzes laser diffraction patterns from RBCs under shear to calculate their elongation (Rabai et al., 2014). While this is a high-throughput method, it calculates mean measurements from populations of RBCs. Microfluidic systems with automated image analysis offer both high-throughput measurements and higher sensitivity than ektacytometry.
Critical Parameters
Some factors during the experiment can affect the results of the motion tracking process. Vibrations or movement artifacts should be reduced as much as possible while capturing a video. This can influence Image-Pro's ability to subtract the background during the Motion Detect step.
It is important to have a sufficiently dilute sample for the microfluidic system. Ideally, the RBCs in the suspension must be sparse enough that only one cell flows through each channel at a time. RBCs tend to aggregate and adhere to each other and a high concentration of RBCs could affect pressure differences between channels and result in erroneous measurements. The automated image analysis may also treat a group of cells as a single large object, which would be an inaccuracy.
When using the Threshold Tool, the background of the image after the Motion Detect step will be a homogenous shade of gray. The average pixel values of this area are ∼125. To select the dark cells, the threshold is set from 0 to the beginning of the left tail of the histogram. To verify the cells will be segmented, increase the threshold slowly until the cells are shaded in blue.
In the Tracking Options, appropriate parameters should be tailored to each experiment. The minimum track length can be decreased or increased to eliminate short tracks (cells getting stuck in the channels). If a time-dependent measurement is of interest (i.e., velocity), it is important to set a Custom Frame Interval. This is the time in seconds between each frame in the video or the reciprocal of the frame rate.
The image manipulation described in this protocol is intended for Image-Pro but similar processing can be done with open source software like ImageJ. ImageJ is a Java based image processing program commonly used for scientific analysis (ImageJ, n.d.). Fiji is a version of ImageJ that comes bundled with useful plugins to analyze images from life sciences and other fields.
The steps of motion detection and cell tracking above can essentially be performed on Fiji using third-party plugins. Two popular plugins commonly used for object tracking are TrackMate and MTrack2.
TrackMate is a tool with a simple interface that guides the user through the tracking options to find the most suitable tracking scheme (Tinevez et al., 2017). The principle steps of object motion tracking (segmentation, filtering, and particle linking) can be visualized directly on the sample image to preview the tracking efficiency before executing the commands. TrackMate includes many algorithms for automation but the user can choose to manually perform each step. The results can include simple computed measurements such as the velocities and radii of the moving objects. These measurements may be sufficient for experiments aiming to study basic morphological properties of cells in motion. More complex measurements like circularity cannot be computed directly on TrackMate and will need additional plugins or software. Data can be plotted directly in the program or exported to other analysis software.
MTrack2 is another tool that can be used through Fiji (Stuurman, , n.d.). This plugin is simpler than TrackMate and offers basic motion tracking. It detects objects in each frame and compiles their position data into tracks. The user sets a minimum and maximum object size, maximum velocity, and minimum track length. These input parameters are similar to Image-Pro's tracking settings and can produce similar results. However, the output data only includes the labeled tracks and the coordinate positions of each object. Some calculations such as velocity can be made but this tool may not be suitable for detailed morphological measurements.
TrackMate and MTrack2 will require preprocessing of the sample images before they can be motion tracked. TrackMate has best results with bright spot-like objects on a dark background. For images captured using a setup similar to ours (brightfield microscopy and high-speed camera), the background should be subtracted, and the contrast increased. The grayscale image should then be inverted so that the cells appear white and the background appears black. Appropriate filters and thresholding should be applied to aid segmentation. Settings will vary for every experiment but the steps in Basic Protocol 1 can serve as a general guide.
Troubleshooting
See Table 1 for common problems encountered when performing these protocols and suggested solutions.
| Problem | Possible cause | Solution |
|---|---|---|
| Poor background subtraction from Motion Detect | Movement artifact during image capture | Check microscope setup for shaking or vibrations |
| Partial segmentation of cell | Non-homogenous pixel values in each cell | Increase strength of a filter |
| Low number of tracks | Velocity limit may be excluding tracks | Raise velocity limit |
| Cell size filters may be excluding tracks | Adjust regions: Axis, major minimum and maximum values | |
| Threshold value may need adjustment | Use threshold tool to ensure the cell is shaded blue; end value of 123 may need to be lower or higher depending on the contrast of the image |
Understanding Results
The final products of this protocol are graphical representations of various measurements from the motion-tracked cells. The plots on MATLAB are created with the statistics toolbox (Statistics and Machine Learning Toolbox, n.d.) and functions downloaded from the MATLAB Central File Exchange.
In our experiments, RBCs were treated with glutaraldehyde which is known to decrease their deformability (Forsyth, Wan, Ristenpart, & Stone, 2010). Following this treatment, we used microfluidic flow and automated image analysis to quantify the effect of this treatment when compared to an untreated control group.
Glutaraldehyde nonspecifically crosslinks proteins in the cytoplasm and the cytoskeleton, resulting in stiffening of the entire cell. RBCs exposed to glutaraldehyde maintain a rigid discoid shape.
Our image analysis process lets us measure the precise extent of the stiffening effect on large samples of cells (thousands of cells depending on computer hardware). The experiments shown were done with ∼150 cells for each condition. Plotting the data on MATLAB shows that glutaraldehyde treated cells are easy to distinguish from the untreated cells. This is obvious from the decreased velocity, circularity measurements, and Area Deformation Index (ADI; Fig. 9).

In Figure 9C, the instantaneous velocities for each cell are averaged along their trajectory on x -coordinates. We can also see the acceleration and deceleration near the entrance and exit of the channels’ constrictions (marked by the black lines). Figure 9D and 9E show normalized frequency distributions for the ADI and circularity. The ADI is the ratio of each cell's projected area inside the constriction to the projected area before entering the constriction. Circularity (C) is calculated using the equation C = 4π[(area of circle)/(perimeter of circle)2],where a circularity value of 1 is a perfect circle and values approaching 0 indicate more of an elongated ellipsoid shape. Circularity values in Figure 9D are measured before the cells enter the constriction. We see that the glutaraldehyde treated cells have ADI values that are generally <1.The areas of cells inside the constriction are less than the areas before the constriction, suggesting that they are not elongating when confined. The cells also have higher circularity values so we can infer that glutaraldehyde treatment forces the cells to maintain a round shape even under light shear. The untreated cells begin to form an elongated parachute shape and thus have lower circularity values.
In diseases that affect the morphologies of RBCs, there can be a wide range of severities. Our method provides a test that is sensitive enough to track changes in single cell morphologies rapidly with high-throughput. We hope that clinical assays can be developed using this process as a proof of concept, and the results may be used in diagnostic tests. Combining automated software analysis with microfluidic systems opens possibilities for large scale rheological blood studies and better understanding of blood related diseases.
Time Considerations
The time required for this protocol is mostly dependent on the RAM and CPU of the computer used. For a video with ∼16,000 frames and 500 detected objects, a computer with 64 GB RAM and an Intel i7 CPU @ 3.70 GHz can complete the described processes in 20 to 25 min.
Acknowledgements
AKS, RWD, and AKR designed the study. AK, BRS, ZCS, and FY performed microfluidics flow experiments and data analysis. AKS designed the microfluidic devices. AK, ZCS, AKS, and AKR wrote the manuscript. The authors would like to thank the blood donors. The authors would like to thank Dr. Liat Rosenfeld for granting access to the high-speed camera used to image cells under flow. The authors would like to thank the Open Medicine Foundation for financial support.
Conflict of Interests
The authors declare no competing interests.
Literature Cited
- Alapan, Y., Matsuyama, Y., Little, J. A., & Gurkan, U. A. (2016). Dynamic deformability of sickle red blood cells in microphysiological flow. Technology , 04(02), 71–79. doi: 10.1142/s2339547816400045.
- Alonso, J. L., & Goldmann, W. H. (2003). Feeling the forces: Atomic force microscopy in cell biology. Life Sciences , 72(23), 2553–2560. doi: 10.1016/s0024-3205(03)00165-6.
- Forsyth, A. M., Wan, J., Ristenpart, W. D., & Stone, H. A. (2010). The dynamic behavior of chemically “stiffened” red blood cells in microchannel flows. Microvascular Research , 80(1), 37–43. doi: 10.1016/j.mvr.2010.03.008.
- Hochmuth, R. M. (2000). Micropipette aspiration of living cells. Journal of Biomechanics , 33(1), 15–22. doi: 10.1016/s0021-9290(99)00175-x.
- Huisjes, R., Bogdanova, A., Solinge, W. W. V., Schiffelers, R. M., Kaestner, L., & Wijk, R. V. (2018). Squeezing for life — Properties of red blood cell deformability. Frontiers in Physiology , 9, 656. doi: 10.3389/fphys.2018.00656.
- ImageJ. (n.d.). ImageJ. Retrieved from https://imagej.net/ImageJ.
- Learn Image-Pro. (n.d.). Media Library. Retrieved from http://www.mediacy.com/imagepro/learn.
- Lee, G. Y., & Lim, C. T. (2007). Biomechanics approaches to studying human diseases. Trends in Biotechnology , 25(3), 111–118. doi: 10.1016/j.tibtech.2007.01.005.
- Rabai, M., Detterich, J. A., Wenby, R. B., Hernandez, T. M., Toth, K., Meiselman, H. J., & Wood, J. C. (2014). Deformability analysis of sickle blood using ektacytometry. Biorheology , 51(2–3), 159–170. doi: 10.3233/bir-140660.
- Saha, A. K., Schmidt, B. R., Wilhelmy, J., Nguyen, V., Abugherir, A., Do, J. K., … Ramasubramanian, A. K. (2019). Red blood cell deformability is diminished in patients with Chronic Fatigue Syndrome. Clinical Hemorheology and Microcirculation , 71(1), 113–116. doi: 10.3233/ch-180469.
- Sinha, A., Chu, T. T. T., Dao, M., & Chandramohanadas, R. (2015). Single-cell evaluation of red blood cell bio-mechanical and nano-structural alterations upon chemically induced oxidative stress. Scientific Reports , 5(1), 9768. doi: 10.1038/srep09768.
- Statistics and Machine Learning Toolbox. (n.d.). Statistics and Machine Learning Toolbox. Retrieved from https://www.mathworks.com/products/statistics.html.
- Stuurman, N. (n.d.). MTrack2. Retrieved from https://valelab4.ucsf.edu/~nstuurman/IJplugins/MTrack2.html.
- Tinevez, J.-Y., Perry, N., Schindelin, J., Hoopes, G. M., Reynolds, G. D., Laplantine, E., … Eliceiri, K. W. (2017). TrackMate: An open and extensible platform for single-particle tracking. Methods , 115, 80–90. doi: 10.1016/j.ymeth.2016.09.016.
- Tomaiuolo, G., Lanotte, L., Dapolito, R., Cassinese, A., & Guido, S. (2016). Microconfined flow behavior of red blood cells. Medical Engineering & Physics, 38(1), 11–16. doi: 10.1016/j.medengphy.2015.05.007.
- Whitesides, G. M. (2006). The origins and the future of microfluidics. Nature , 442(7101), 368–373. doi: 10.1038/nature05058.
Citing Literature
Number of times cited according to CrossRef: 6
- Debbie Jiang, Katie L. Houck, Lydia Murdiyarso, Harrison Higgins, Nicole Rhoads, Sophia K. Romero, Rosemary Kozar, Angelo Nascimbene, Terry B. Gernsheimer, Zyrina Alura C. Sanchez, Anand K. Ramasubramanian, Reheman Adili, Jing-fei Dong, RBCs regulate platelet function and hemostasis under shear conditions through biophysical and biochemical means, Blood, 10.1182/blood.2024023887, 144 , 14, (1521-1531), (2024).
- Huijuan Guo, Yanjing Zhang, Bingyu Li, Chenwei Li, Qingyun Shi, Keyan Zhu-Salzman, Feng Ge, Yucheng Sun, Salivary carbonic anhydrase II in winged aphid morph facilitates plant infection by viruses, Proceedings of the National Academy of Sciences, 10.1073/pnas.2222040120, 120 , 14, (2023).
- Siming Wang, Yuchu Zhao, Junjie Yang, Shichao Liu, Weifeng Ni, Xueyuan Bai, Ze Yang, Daqing Zhao, Meichen Liu, Ginseng polysaccharide attenuates red blood cells oxidative stress injury by regulating red blood cells glycolysis and liver gluconeogenesis, Journal of Ethnopharmacology, 10.1016/j.jep.2022.115716, 300 , (115716), (2023).
- Mengduo Jiang, Meng Shao, Xiao Yang, Linna He, Tao Peng, Tao Wang, Zeyu Ke, Zixin Wang, Shu Fang, Yuxin Mao, Xilin Ouyang, Gang Zhao, Jinhua Zhou, Automatic Classification of Red Blood Cell Morphology Based on Quantitative Phase Imaging, International Journal of Optics, 10.1155/2022/1240020, 2022 , 1, (2022).
- Nida Ishtiaq, Amirali Khodadadian Gostar, Alireza Bab-Hadiashar, Jennifer Palmer, Reza Hosseinezhad, Interaction-Aware Labeled Multi-Bernoulli Filter with Road Constraints, 2022 11th International Conference on Control, Automation and Information Sciences (ICCAIS), 10.1109/ICCAIS56082.2022.9990395, (248-254), (2022).
- Zyrina Alura C. Sanchez, Vignesha Vijayananda, Devin M. Virassammy, Liat Rosenfeld, Anand K. Ramasubramanian, The interaction of vortical flows with red cells in venous valve mimics, Biomicrofluidics, 10.1063/5.0078337, 16 , 2, (2022).

