pHluorin assays, analysis, and fluorescence microscopy
Leonardo A Parra-Rivas
Abstract
pHluorin assays, analysis, and fluorescence microscopy
Steps
Vesicle recycling measurements
Neurons expressing sypHy were imaged at 12-14 DIV. Experiments were conducted in standard extracellular solution containing (in mM): NaCl 150, KCl 3,Glucose 20, HEPES 10, CaCl2 2, MgCl2 3, pH adjusted to 7.35. To block recurrent network activity, experiments were conducted in the presence of 10µM DNQX (6,7-Dinitroquinoxaline-2,3 (1H,4H-dione, Merck) and 50µM APV (DL-2-Amino-5-phosphonopentanoic acid, Merck). After each experiment, the bath was
perfused with saline in which 50 mM NaCl was replaced with N44Cl to visualize the total vesicle population.
For imaging, cultured neurons were placed in a stimulation chamber between parallel platinum wires
(RC-49MFSH, Warner Instruments). Stimulation (300 bipolar pulses of 10 V/cm, each of a duration of 1 µs, at 20 Hz for 15 s), was delivered using a high-power stimulus-isolation unit (SIU-102B, Warner
Instruments) driven by an isolated pulse-stimulator (2100, A-M Systems). 50 images were obtained (43 at 0.2 Hz and then 7 images at 0.125 Hz) per experiment. At least 30 synaptic regions of
interest (ROIs) were analyzed in each case. The baseline sypHy fluorescence0(F0)
in each synapse was the average value measured in 6 pre-stimulation images. The
fluorescence increment at time t [DF(t)=F0t)-F0] was normalized by the baseline value for each synapse. Synaptic DF0t)/F0 values were averaged across synapses in
each experiment (shown as symbols in bar-chart graphs). These were averaged to
obtain mean values for each experimental condition. Non-responding synaptic
puncta were excluded. Experiments were performed using at least three
independent cultures on different days. To confirm the presence of h-α-syn-mCherry and tagBFP-synapsins, fluorescent-tagged proteins were imaged before each experiment. All pHluorin assays were performed at room temperature. Fluorescence measurements were performed on a Nikon TiE
inverted microscope driven by the NIS-elements software package (Nikon). The
microscope was equipped with an Andor Neo 5.5 sCMOS camera (Oxford
Instruments), a 40X 0.75 NA Plan Fluor objective, EGFP and Cy3 filter cubes
(TE-series, Chroma), BFP, mCherry and Cy5 filter cubes (Semrock), and a
perfect-focus mechanism (Nikon).
Quantification of endocytosis rates
Endocytosis
rates were assessed based on the decay of sypHy fluorescence after the
termination of stimulation. Data were fit with a single-exponential
decay-function (32 data points, 160 seconds) starting 5 seconds after
stimulation cessation. The function is:
(eq. 1)
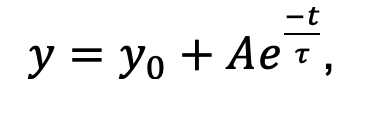
where A is an amplitude, y0 0 is an offset and t is the time constant,assuming stimulation starts at t=0 for all traces.Fit results were discarded if t was longer than 160 seconds (the duration of
the data being fit).
Measurement of the recycling pool relative size
The relative size of the recycling pool was
calculated based on imaging of cumulative exocytosis. Cumulative exocytosis was
achieved by blocking SV reacidification by adding 1 μM bafilomycin A1 (Enzo Life Sciences Cat# BML-CM110-0100) to the bathing medium itemized above. Neurons were imaged at 0.2 Hz throughout the experiment. 6 baseline images were acquired, and stimulation
was applied at t=0 for 2 minutes at 20 Hz (2400 action potentials), until
saturation. The fluorescence of the total vesicle populatiomaxFmax)
was measured at the end of each experiment by perfusing the chamber wi4h NH4Cl-saline.
Synaptic sypHy signals were measured from at least 30 ROIs as explained above,
subtracting from each its mean baseline value and normalizing maxby Fmax.
The relative size of the recycling pool was defined as the ratio of the mean of
the last three data points (at saturation, 4efore NH4Cl exposumax
and Fmax.
Evaluation of width of SV distribution
Neurons
were fixed using 4% paraformaldehyde (EMS) in phosphate buffered saline
(Biological Industries) for 10 minutes, washed thoroughly with PBS and
permeabilized with PBS supplemented with 0.1% triton X100 (Merck) for 1 minute
and washed three times. Blocking solution (PBS with 5% skim milk powder; Merck)
was applied for 1 hour. The coverslips were incubated for 1 h with the
indicated primary antibodies (see above) in blocking solution at RT, washed X3
and then incubated with secondary antibodies in blocking solution for 1 hour at
RT. Finally, the preps were washed X3 and mounted using immumount (Thermo
Scientific). Neurons were imaged using a 60X 1.4 NA oil-immersion Apochromat
objective (Nikon). Linear profiles were drawn manually along axonal segments
and through synaptic puncta in the vGlut1 channel using NIS elements (Nikon).
The intensity profiles were imported into Origin (2022) (RRID:http://www.originlab.com/index.aspx?go=PRODUCTS/OriginODUCTS/Originand fit
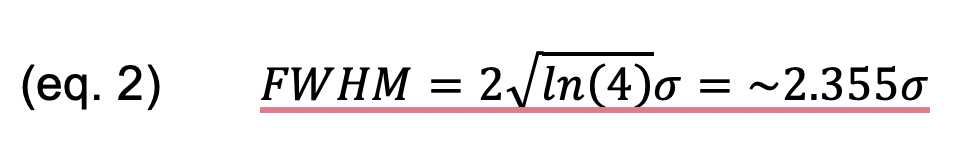
individually with Gaussian functions. The standard deviation parameter
(s) of the fit was extracted, and the FWHM was calculated thus:
Semi quantitative determination of synaptic fluorescence intensity
Synaptic puncta were detected by an in-house thresholding algorithm in which the
threshold is iteratively decreased, detected objects are filtered based on
their area and roundness (>0.7), saved, and then blanked to not be chosen
again. Subsequently, objects that the user judges by eye not to represent
synaptic puncta, or those which are out of focus are removed manually. The peak
fluorescence at the center-of-mass (2X2 pixels in size) in each punctum is recorded.
Synaptic intensity values were averaged per image. All experimental conditions
of fluorescence intensity experiments were performed and processed; in each
imaging session, the mean intensity value of the control condition was used to
normalize all recorded values, to reduce inter-session variability. Normalized
intensity values were then averaged across sessions.
Measurement of synaptic enrichment
Synaptic enrichment was measured as described previously (4). Neurons were
transduced at 5 DIV with either sypHy or sypHy-E-domain, h-α-syn-mCherry and
soluble tagBFP as a measure of local volume. At 14 DIV, the neurons were fixed
and immunostained with anti-vGlut1 antisera (secondary: NL-637) to visualize
synaptic puncta. Analysis lines (at least 30) were drawn in each image,
starting in the axon, through a synapse, and into the surrounding background.
The intensity profiles corresponding to the h-α-syn-mCherry and tagBFP channels
were fit with a Gaussian function to determine the a Faxon axon (Faxon)
and sy Fsyn synic (Fsyn) intensity values of each color thus:
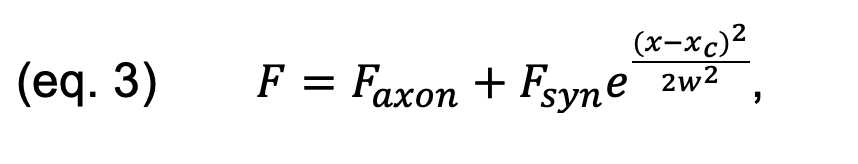
where xc is c is the center of the Gaussian (the synaptic center) and w i s its width.
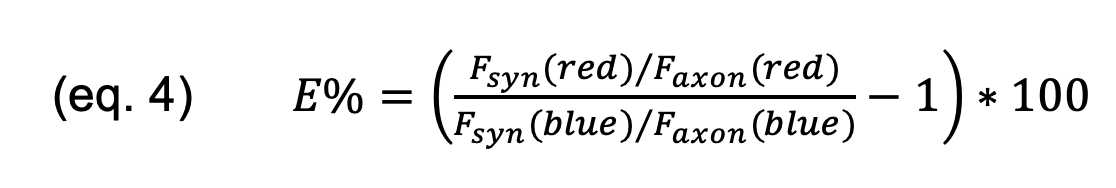
The percentage of synaptic enrichment ( E% ) of h-α-syn-mCherry is defined
thus: