Ultrasound-Guided Approaches to Improve Orthotopic Mouse Xenograft Models for Hepatocellular Carcinoma
Ghina Bou About, Ghina Bou About, Emilie Thiebault, Emilie Thiebault, Marie Wattenhofer-Donzé, Marie Wattenhofer-Donzé, Hugues Jacobs, Hugues Jacobs, Alain Guimond, Alain Guimond, Tania Sorg, Tania Sorg, Eric Robinet, Eric Robinet, Thomas F. Baumert, Thomas F. Baumert, Laurent Monassier, Laurent Monassier, Yann Herault, Yann Herault
Abstract
Hepatocellular carcinoma (HCC) is the second leading cause of cancer death worldwide. While curative approaches for early stage HCC exist, effective treatment options for advanced HCC are lacking. Furthermore, there are no efficient chemopreventive strategies to limit HCC development once cirrhosis is established. One challenge for drug development is unsatisfactory animal models. In this article, we describe an orthotopic xenograft mouse model of human liver cancer cell lines through image-guided injection into the liver. This technique provides a less invasive yet highly efficient approach to engraft human HCC into mouse liver. Similarly, image-guided injections are used to deliver chemotherapeutics locally, enabling reduction in potential systemic adverse effects, while reducing the required dose for a therapeutic effect. In summary, this image-guided strategy provides a novel and convenient approach to improve current HCC mouse models. © 2019 The Authors. This is an open access article under the terms of the Creative Commons Attribution-NonCommercial-NoDerivs License, which permits use and distribution in any medium, provided the original work is properly cited, the use is non-commercial and no modifications or adaptations are made.
INTRODUCTION
Hepatocellular carcinoma (HCC) is the most common cause of cancer-related deaths worldwide (Ferlay, Forman, Mathers, & Bray, 2012) and is the leading cause of death among patients with cirrhosis related to viral hepatitis (El-Serag, 2012). Survival rates remain poor—generally not more than 5 years—when HCC is diagnosed at an advanced stage (Davila et al., 2010). Early diagnosis of HCC using biomedical imaging allows improved prognosis. Until now, surgery has been the most effective treatment. From a pharmacologic point of view, chemotherapy and the multikinase inhibitor sorafenib enable survival improvements but demonstrate numerous adverse effects, especially in advanced or metastatic HCC (Llovet et al., 2008). Relevant preclinical animal models are crucial for the development of innovative approaches to HCC (i.e., electroporation, gene therapy, and immunotherapy). Various murine models (chemical induction, genetic modification, or xenogeneic tumor cell transplantation) have already contributed to defining the pathogenesis and the current knowledge of HCC (Heindryckx, Colle, & Van Vlierberghe, 2009). However, murine models that reproduce and recapitulate all HCC etiologies and steps are not available and will be difficult to obtain. For this reason, during drug development different complementary preclinical models (Wu et al., 2016) are used to assess efficacy and safety of innovative interventional therapies, as well as diagnostic modalities.
Early detection and confirmation of HCC using ultrasound imaging with or without contrast agent (Anton et al., 2017), computed tomography, and/or magnetic resonance imaging is a key goal to improve patient outcomes. Here, we describe a protocol to establish a xenogeneic orthotopic model of HCC through intrahepatic echo-guided injection of a hepatoma tumor cell line and the effect of local intratumoral delivery of the cytotoxic treatment doxorubicin on tumor progression. Basic Protocol 1 describes the technique of echo-guided injection. Basic Protocol 2 describes tumor size and volume monitoring.
NOTE : All protocols using live animals must first be reviewed and approved by an Institutional Animal Care and Use Committee (IACUC) or must conform to local regulations regarding the care and use of laboratory animals.
Basic Protocol 1: PREPARATION AND ECHO-GUIDED INJECTION OF TUMOR CELLS AND CYTOTOXIC DRUGS
The Huh-7-Luc human tumor cell line is transplanted into anesthetized 6-week-old mice weighing between 25 and 30 g by echo-guided intrahepatic injection with a high-resolution ultrasound imaging system. Injection of drugs into the tumor uses the same protocol. In this protocol one can expect that a tumor will be visible and measurable by ultrasounds 2 weeks after injection. One can follow growth until the ethical endpoint is reached, leading to sacrifice. Treatment efficacy is also discussed.
Materials
-
Doxorubicin hydrochloride powder (e.g., Sigma-Aldrich, cat. no. D1515-10MG)
-
0.9% (w/v) NaCl (saline), sterile
-
Huh-7- Luc cells
-
Cell culture medium (see recipe)
-
0.25% Trypsin-EDTA (e.g., Thermo Fisher Scientific, cat. no. 25200072)
-
Dulbecco's phosphate-buffered saline (PBS) without calcium or magnesium (e.g., Eurobio, cat. no. CS1PBS01-01)
-
0.4% Trypan blue (e.g., Bio-Rad, cat. no. 1450021)
-
Isoflurane, for anesthesia induction
-
6-week-old, 25 to 30 g, female NMRI-nu (Rj:NMRI-foxn1nu/nu) nude mice (e.g., Janvier Labs)
-
Hair removal cream
-
Lubricating eye gel
-
Ultrasound gel (e.g., EDM Medical Imaging)
-
Buprenorphine
-
1.5-ml microcentrifuge tubes
-
37°C, 5% CO2 cell culture incubator
-
37°C water bath
-
Centrifuge and microcentrifuge
-
75-cm2 cell culture flask (e.g., Falcon, part no. 353024)
-
Light microscope
-
15-, 30-, or 50-ml centrifuge tubes
-
Automated cell counter (e.g., Bio-Rad TC20) with corresponding counting slides (e.g., Bio-Rad, cat. no. 1450011)
-
Rodent anesthesia induction system with vaporizer/manifold
-
High-resolution ultrasound system with imaging station (e.g., VisualSonics Vevo), including microinjection apparatus, mouse handling thermally regulated table with real-time monitoring of key physiologic parameters (respiration, heart rate), rectal temperature probes, and anesthesia line connected to anesthesia face mask
-
Ultrasound transducer, 25 to 55 MHz for abdominal scanning (e.g., MS550D)
-
1-ml syringe with 30-G, 1-in. needle
-
Computer running ultrasound imaging software (e.g., Vevo LAB VisualSonics imaging software version 3.0.0)
-
Heating pad
Prepare doxorubicin
1.Dissolve 10 mg doxorubicin powder in 5 ml of 0.9% sterile NaCl to obtain a soluble, clear solution at a final concentration of 5 mg/ml. Prepare 5 aliquots with 1 ml stock solution, and store at −20°C for up to 12 months.
Prepare Huh-7-Luc cell line
2.Produce 4 × 10⁶ viable Huh-7-Luc cells per mouse.
3.Cultivate Huh-7-Luc cells as adherent cells in culture medium in a 37°C incubator with 5% CO2.To keep cell growth dynamic, do not allow cells to grow to complete confluency. Renew culture medium every 2 to 3 days. Perform trypsinization when cells reach around 90% confluency.
4.Thaw cryovial of 2 million (2 × 10⁶) Huh-7-Luc cells in a 37°C water bath until only a small block of ice remains (around 30 sec). Transfer cells as quickly as possible to culture medium, and centrifuge 3 min at 300 × g , 21°C to 23°C, to remove DMSO. Resuspend cell pellet into 15 ml culture medium, and transfer to a 75-cm2 culture flask. Incubate flask in a cell culture incubator.
5.Check cell growth and morphology at least every 2 days under a microscope.
6.Remove culture medium, and wash with around 5 ml PBS. When cells reach ∼90% confluency (generally after 3 days), harvest cells by adding 3 to 5 ml warmed trypsin to the side wall of the flask, and gently swirl to cover the cell layer. Pipette up and down with a 10-ml pipette to detach cells and obtain a unicellular suspension. Add 5 to 10 ml culture medium to inactivate trypsin.
7.Transfer cell suspension to a centrifuge tube (15-, 30-, or 50-ml volume, as convenient), and centrifuge 3 min at 300 × g , room temperature. Remove supernatant and gently resuspend cells in 10 ml culture medium.
8.Determine number of viable cells. To do so, take a 10-µl aliquot of cell suspension, and add 10 µl Trypan blue. Load 10 µl of this mixture on a counting slide, and proceed to counting. Determine percentage of viable cells and number of viable cells per ml. Multiply this number by 10 (volume in ml of cell suspension) to obtain the number of viable cells in the flask.
9.Split cells in as many 75-cm2 flasks as needed considering that you add 2–2.5 × 10⁶ cells per 75-cm2 flask. Incubate in cell culture incubator.
10.Repeat steps 4 to 9 until enough cells are produced, considering that 4 × 10⁶ cells need to be produced per injected mouse.
11.Repeat steps 4 to 9, when enough cells are produced, the day of mouse injection. Then, resuspend Huh-7-Luc cells in culture medium at a concentration of 20 × 106 cells/ml.
12.Aliquot cell suspension into sterile 1.5-ml microcentrifuge tubes (4 × 10⁶ cells in 200 µl culture medium). Prepare, at a minimum, 1 microcentrifuge tube per mouse to inject (generally 20).
13.Store tube on ice, and immediately proceed to step 14.
Prepare nude NMRI mouse
14.Set up heating platform at 37°C.
15.Place animal platform in an orientation that allows for correct placement of the MS550D imaging probe in front of the abdomen of the mouse and the isoflurane anesthesia nose clamp (Fig. 1A,B).
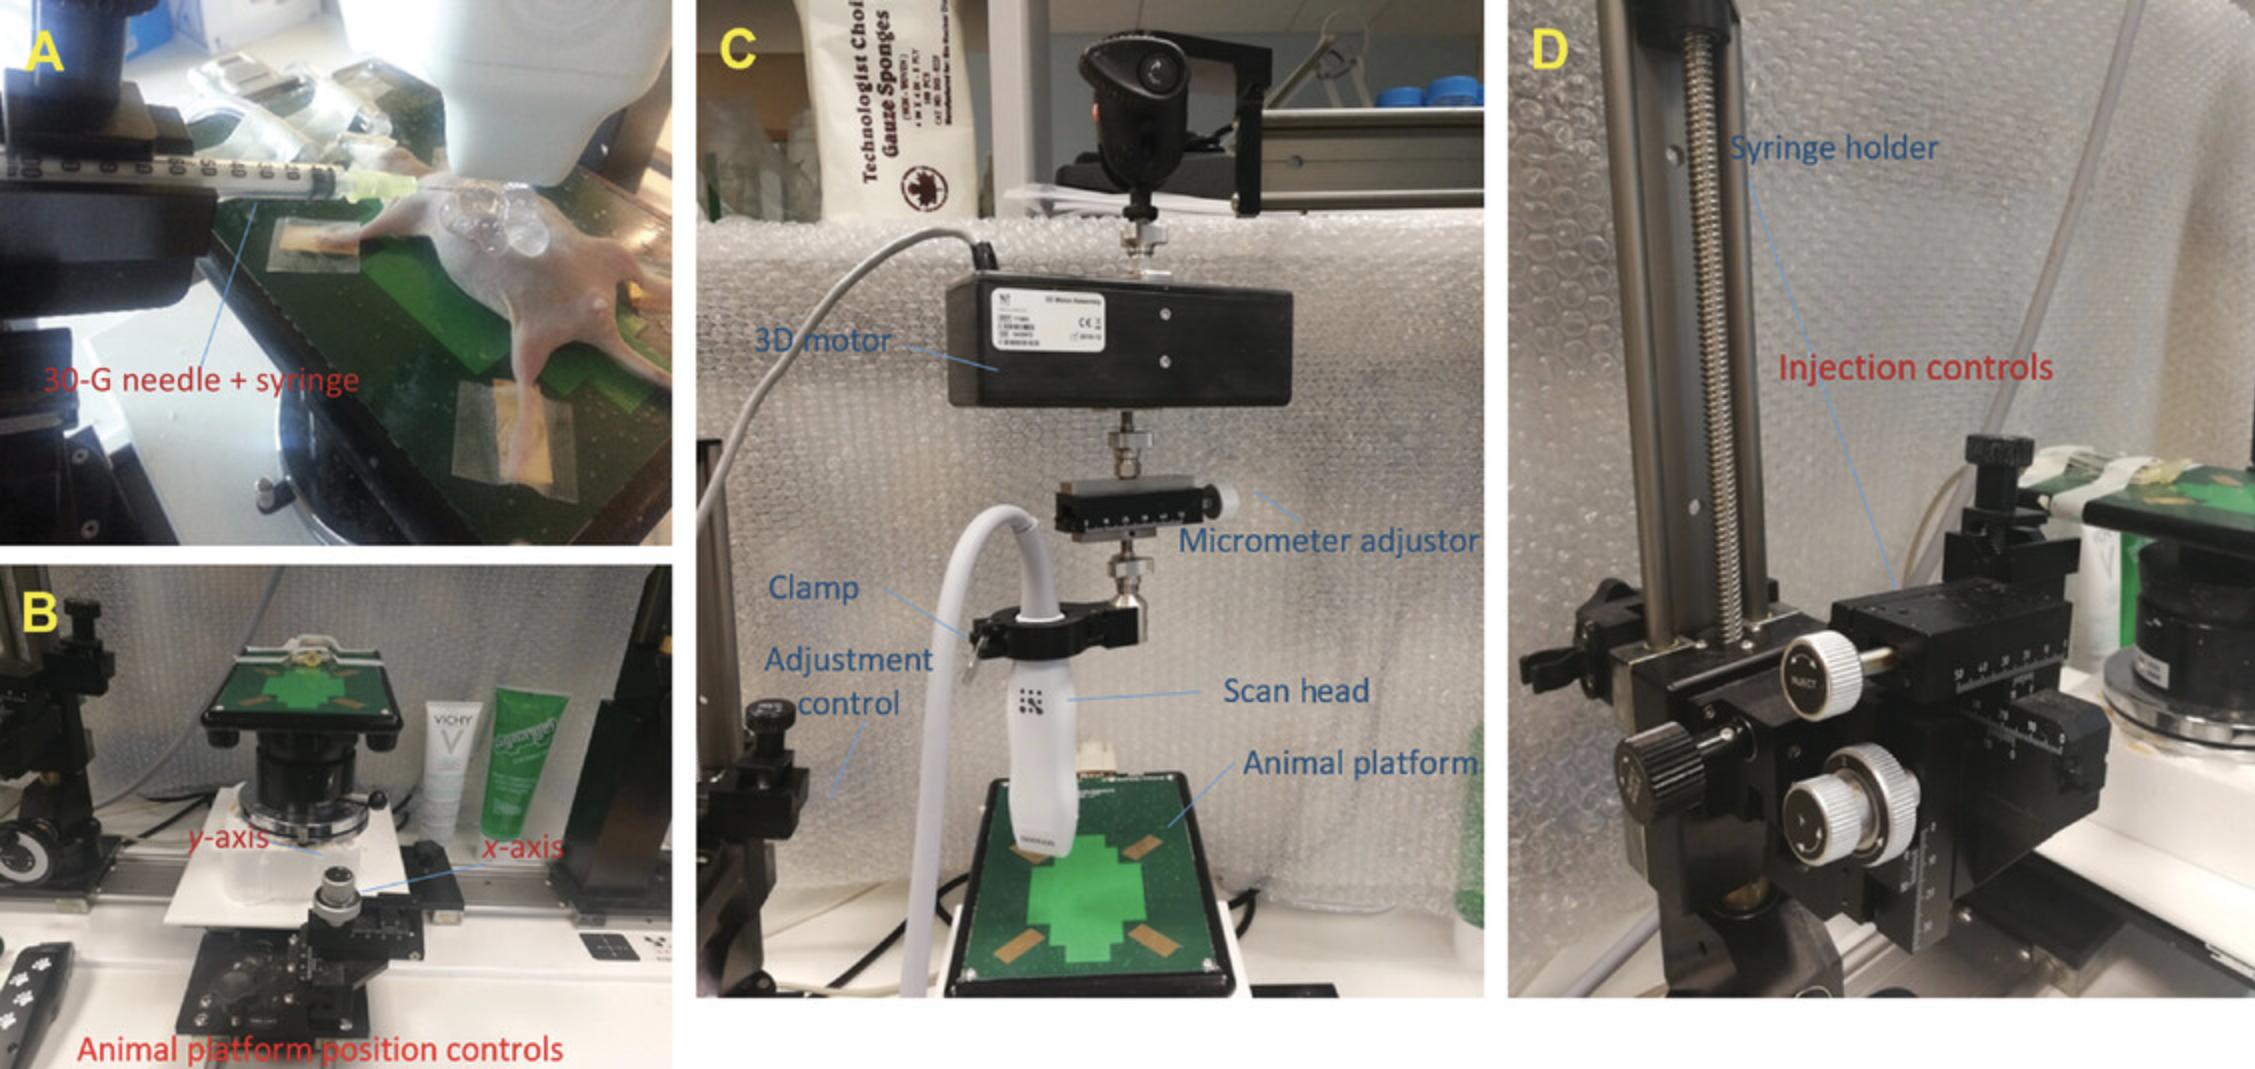
16.Anesthetize mouse in induction chamber with 3% to 5% isoflurane, and turn on flow meter between 500 and 1000 ml/min.
17.Place mouse on the platform, and maintain anesthesia with a nose cone delivering 1% to 3% isoflurane at a rate of 100 to 200 m/min to prevent movement during the imaging session.
18.Remove abdominal hair with hair removal cream, and apply lubricating gel to both eyes to prevent drying of the sclera.
19.Gently insert rectal temperature probe, and tape paws to the echography electrodes after having applied ultrasound gel for electrical contact.
Prepare coordinate of injection using the imaging station
20.Prepare 1-ml syringe with 30-G, 1-in. needle.
21.Place empty syringe with sheathed needle, bevel side oriented upward, in syringe clamp, and secure ultrasound transducer probe in the scan head clamp (Fig. 1C).
22.Align transducer parallel to the axis of the needle under visual control using fine manipulation.
23.Fix scan head position by tightening the clamp (Fig. 1C).
24.Cover head of the transducer tip with ultrasound gel along the ultrasound emission beam.
25.Scan superior abdominal area with the transducer to obtain a coronal section of the liver.
26.Move transducer in the anterior direction from the animal platform using the scan height control (Fig. 1C).
27.Load a new needle and syringe with injectate (see cell preparation in steps 2 to 14) to the final target volume. Be sure to remove air bubbles.
28.Place syringe into the syringe clamp without adjusting the x -axis alignment.
Inject mouse
29.Lower transducer onto the abdominal area using the scan head height control of the animal platform.
30.Use animal platform adjustment controls (Fig. 1C) to adjust the field of view and to target any desired injection site in the liver.
31.With syringe in the fully retracted syringe clamp, slowly advance syringe towards the mouse's abdomen by turning the injection control clockwise (Fig. 1D). To permit clear ultrasound visualization of both the liver and the needle tip as it approaches the abdomen, use ultrasound gel over the left side of the abdomen, and optimize the acoustic window by setting a wide field of view on the echography control panel.
32.Set focal point/zone at the target site for injection.
33.Activate needle guide software function to digitally extend a line along the long axis of the needle through to the target. Check that the tip of the needle is not in a large vessel (portal vein or inferior vena cava; Fig. 2A).
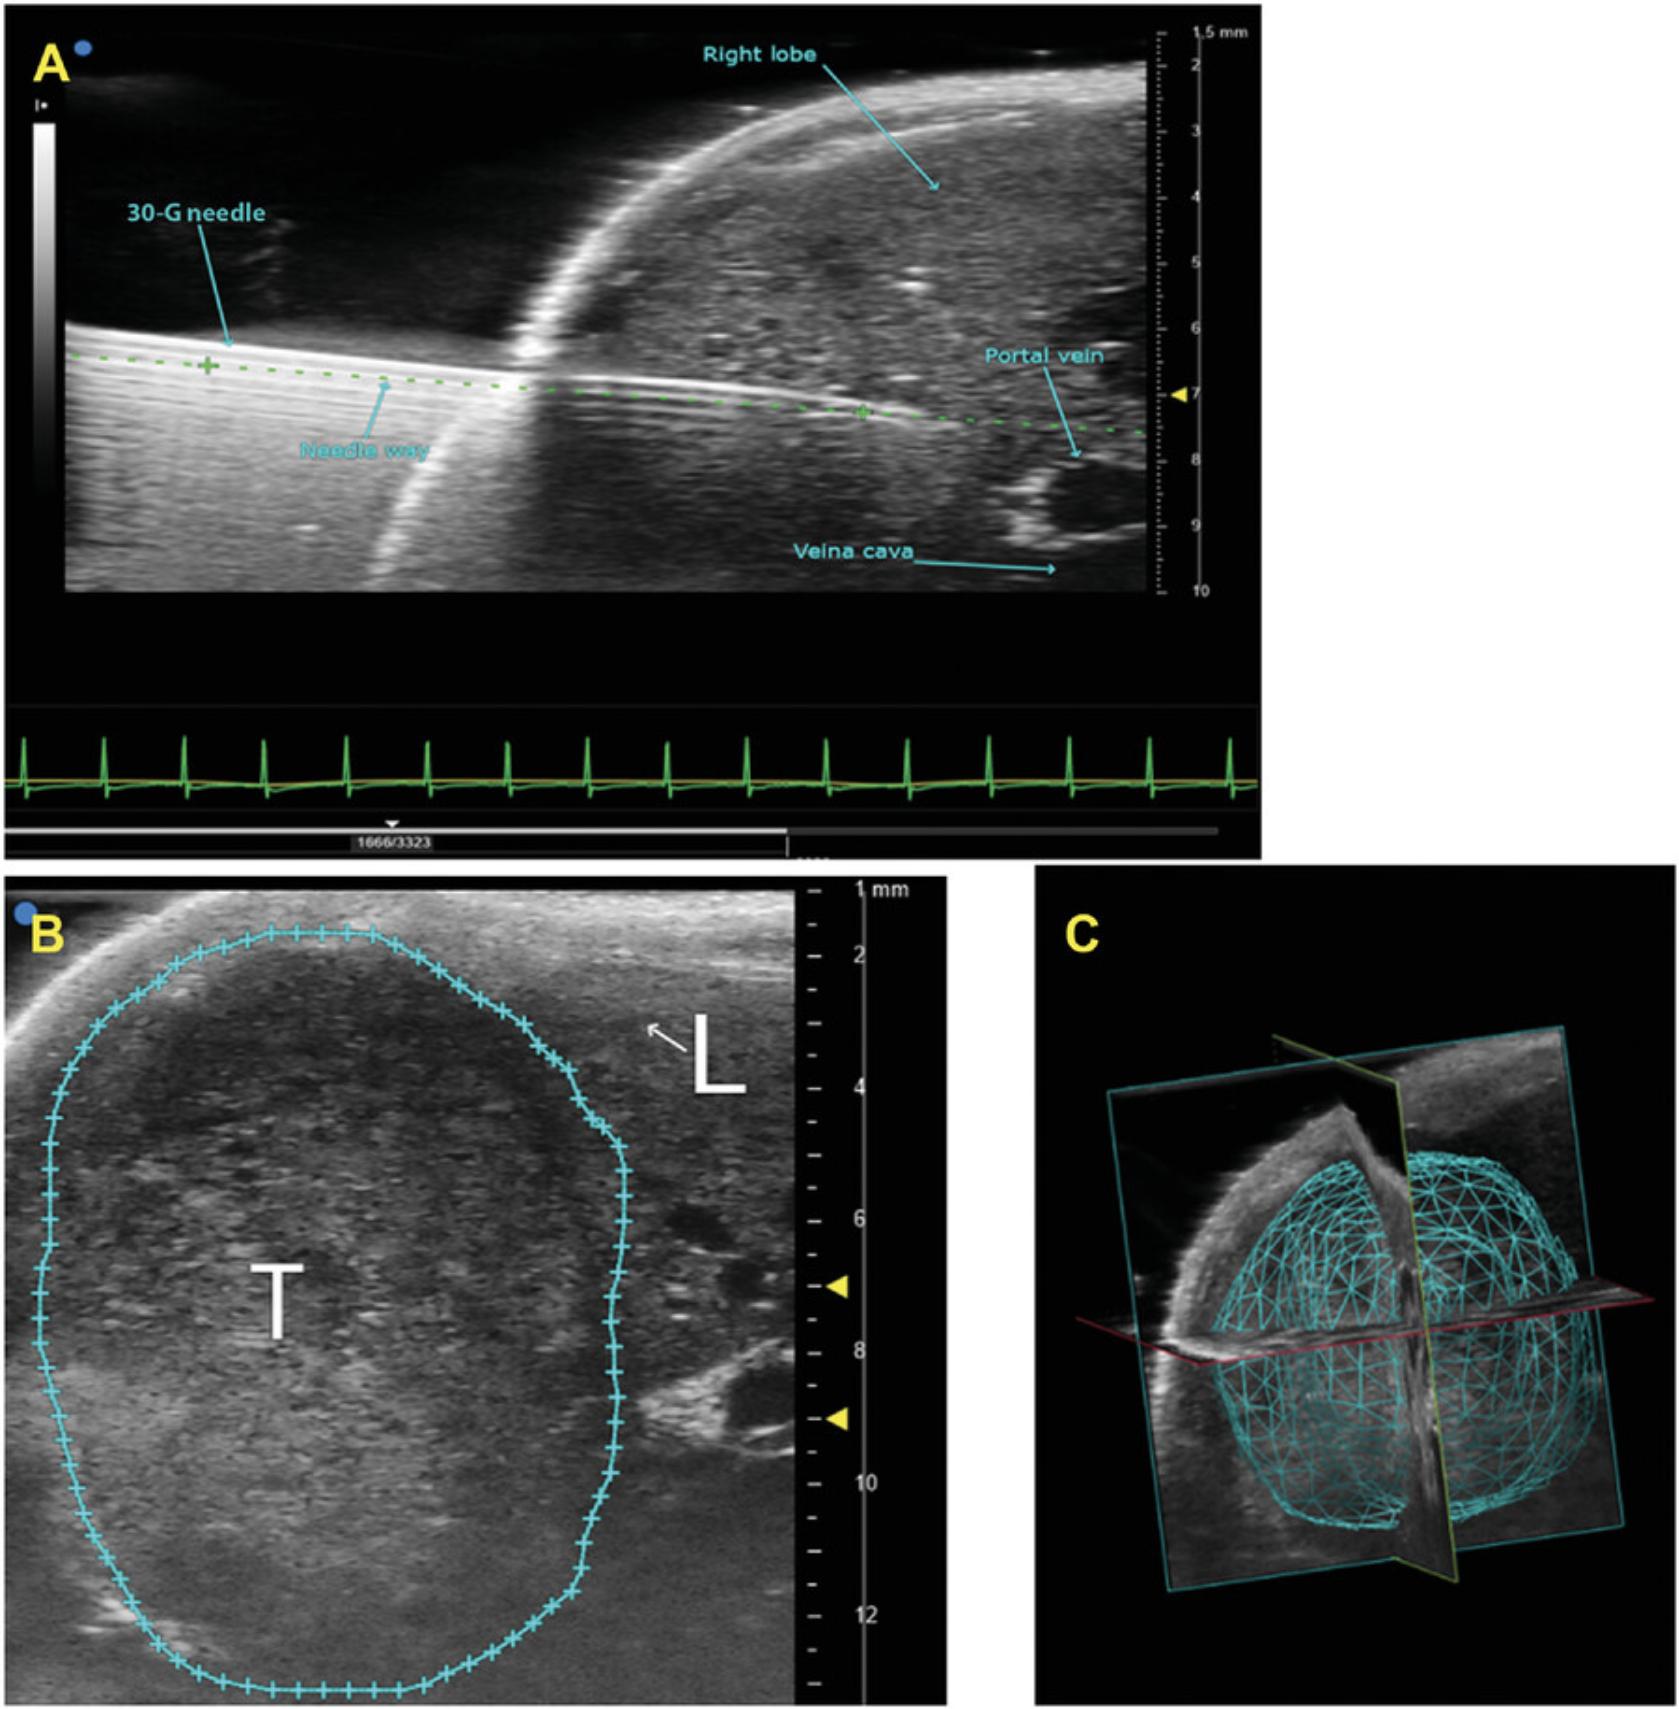
34.When tip is in the desired location, deliver injectate by pushing on the syringe plunger. Deliver 50 μl injectate (1 × 10⁶ cells/ml complete medium) slowly over 5 to 30 sec.
35.Once injectate has been administered, slowly withdraw needle by counter-clockwise rotation of the injection control knob.
36.Gently remove ultrasound gel from the tissue, and remove mouse from the anesthesia unit.
37.Put mouse in cage placed on a heating pad until full recovery (i.e., normal movements and response to noise).
38.Inject 0.1 mg/kg buprenorphine to minimize postprocedural pain.
39.Place mouse into its home cage with full access to water and food.
40.At 2 weeks after cell injection and when the tumor reaches 50 mm3, dilute doxorubicin stock solution to 4 different concentrations (4, 2, 1, and 0.5 mg/kg), and inject solution following the same technique as detailed in steps 14 through 39.
Basic Protocol 2: TUMOR SIZE AND VOLUME IMAGING AND POSTACQUISITION VOLUMETRIC ANALYSIS
At 4 to 5 days after tumor cell injection, we image the organ of interest using 2D and 3D imaging modes. We scan the changes in liver tissue, indicative of a potential tumor. The 3D mode allows for measurement of area, height, length, and volume of the tumor.
Materials
-
Injected mouse (see Basic Protocol 1)
-
Isoflurane, for anesthesia induction
-
Ultrasound gel (e.g., EDM Medical Imaging)
-
Rodent anesthesia induction system with vaporizer/manifold
-
High-resolution ultrasound system with imaging station (e.g., VisualSonics Vevo), including mouse handling thermally regulated table with real-time monitoring of key physiologic parameters (respiration, heart rate), rectal temperature probes, and anesthesia line connected to anesthesia face mask
-
Ultrasound transducer, 25 to 55 MHz (e.g., MS550D for abdominal scanning)
-
3D motor assembly (see Fig. 1C)
-
Computer running ultrasound imaging software (e.g., Vevo LAB VisualSonics imaging software version 3.0.0)
1.Place anesthetized mouse on the animal platform in a similar way as described in Basic Protocol 1, steps 14 to 17, for injection, and visualize liver tissue, vessels, and abdominal organs.
2.Locate a putative tumor, and adjust the x - and y -axis for optimal image quality. Then, scan the entire tumor volume.
3.Clip transducer onto the 3D motor. After adjusting the x - and y -axis positions, locate the tumor region, placing it in the center of the image display. Use the micrometer adjustors for fine adjustment (Fig. 1C).
4.Observe tumor image from distal to proximal, and note length and position of the transducer at the midpoint.
5.Scan a distance equal to the tumor length plus 3 to 4 mm on both sides.
6.Review images and save the scan only if the whole tumor was scanned.
7.Return mouse into its home cage.
8.Use the software study management function for 3D volumetric analysis. Load desired 3D scan file for analysis, and initiate the volumetric analysis function.
9.Trace tumor/tissue border around the perimeter of the tumor, and left-click to anchor specific points. When the entire border is traced, right-click to close the circle
10.Add the region of interest on every each slice (z -axis) through the tumor depth in both directions.
11.Complete volumetric analysis to derive a final, calculated tumor volume, and view as a solid surface.
REAGENTS AND SOLUTIONS
Cell culture medium
- Dulbecco's Modified Eagle Medium with high glucose and HEPES (e.g., Thermo Fisher Scientific, cat. no. 42430-025) supplemented with:
- Non-essential amino acids (e.g., Thermo Fisher Scientific, cat. no. 11140050 or 11140035)
- 35 μg/ml gentamycin (e.g., Duchefa Biochemie)
- 10% (v/v) fetal bovine serum (e.g., GE Healthcare, cat. no. SV30160.03)
- Maintain sterile technique when preparing
- Store at 4°C for up to 1 month
COMMENTARY
Background Information
Echo-guided injection in mice was previously developed for organs, such as the heart, and in embryos (Pierfelice & Gaiano, 2010; Zhou & Zhao, 2014). It is a technique currently employed in clinics. Nevertheless, no paper has standardized the method for the mouse liver. Moreover, no study has investigated the effect of cytotoxic compounds injected using the same route into the mouse liver. To develop and standardize the method, we employed the same number of cells that was previously administered in the liver parenchyma following laparotomy. This procedure was long lasting and painful for the animals, and a high mortality rate was observed likely because of vessel injury (Wu et al., 2016). As a consequence, we decided to use echography as a way to precisely locate the site of injection far from a vessel and to administer drugs locally. Compared to the surgical method (i.e., laparotomy implantation), this new method offers a better way to follow the 3R criteria (replace, refine, reduce) by improving the rate of success and reducing mortality. The tumor engraftment rate is 95% with image-guided injection versus 86% with intrahepatic injection in the left lobe after laparotomy (Wu et al., 2016). A lower mortality rate is also obtained (0.01% versus 5.2% for echo-guided injection and laparotomy, respectively).
In this article, we described injection of doxorubicin, but this method can be used for many other medications (e.g., other drugs, biotherapeutics, RNA).
Critical Parameters
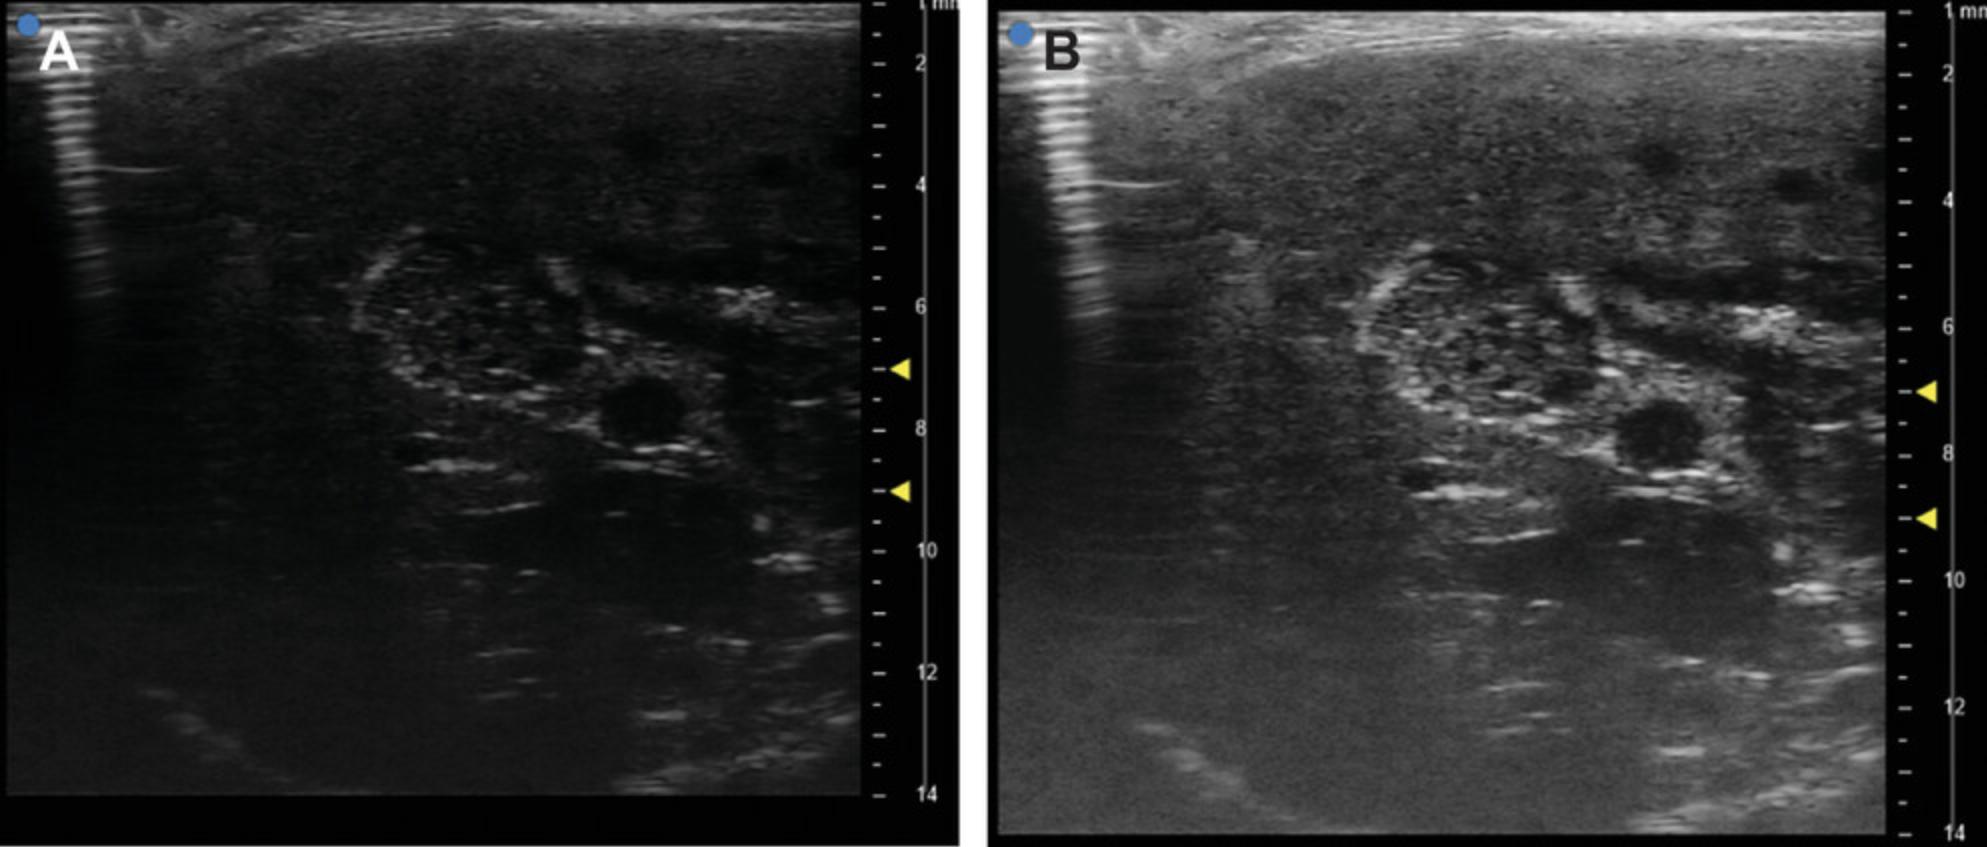
Several critical points must be taken into consideration. Consider using additional mice for late tumor onset. For the injection itself, the size of the needle should not exceed 30-G because larger gauges induce tissue injury and cell leakage outside the liver when the needle is removed. Mouse placement on the heating station must allow for proper alignment of the needle and the ultrasound beam, as the experimenter should be able to see the whole needle on the screen together with the site of injection in the liver. Settings of the ultrasound machine must be adjusted by changing contrast and gain to obtain the proper contrast between the tumor and the surrounding liver parenchyma (Fig. 4A,B). Vessels must be well localized to avoid intravascular injection that could provoke metastasis or hemorrhage. Nevertheless, some small vessels cannot be easily visualized. An injection in such vessel has no significant consequence on the mouse and future outcome of tumor development. Otherwise place the mouse in an optimal position for the experimenter.
Troubleshooting
In some cases (∼2%), we have observed a lack of tumor engraftment in the liver but surprisingly some tumors in ovaries and pancreas. Conversely, we have not observed tumors in lungs. Thus, we assume that our injection was outside the liver lobe. This could be prevented by placement of the tip of the needle not too deeply in the liver tissue. Nevertheless, when the tip is too close to the cutaneous surface, tumor development can be observed in subcutaneous tissue. Bleeding (immediate or delayed) causing the death of the mouse can be prevented by avoiding vessels at the time of needle placement.
Understanding Results
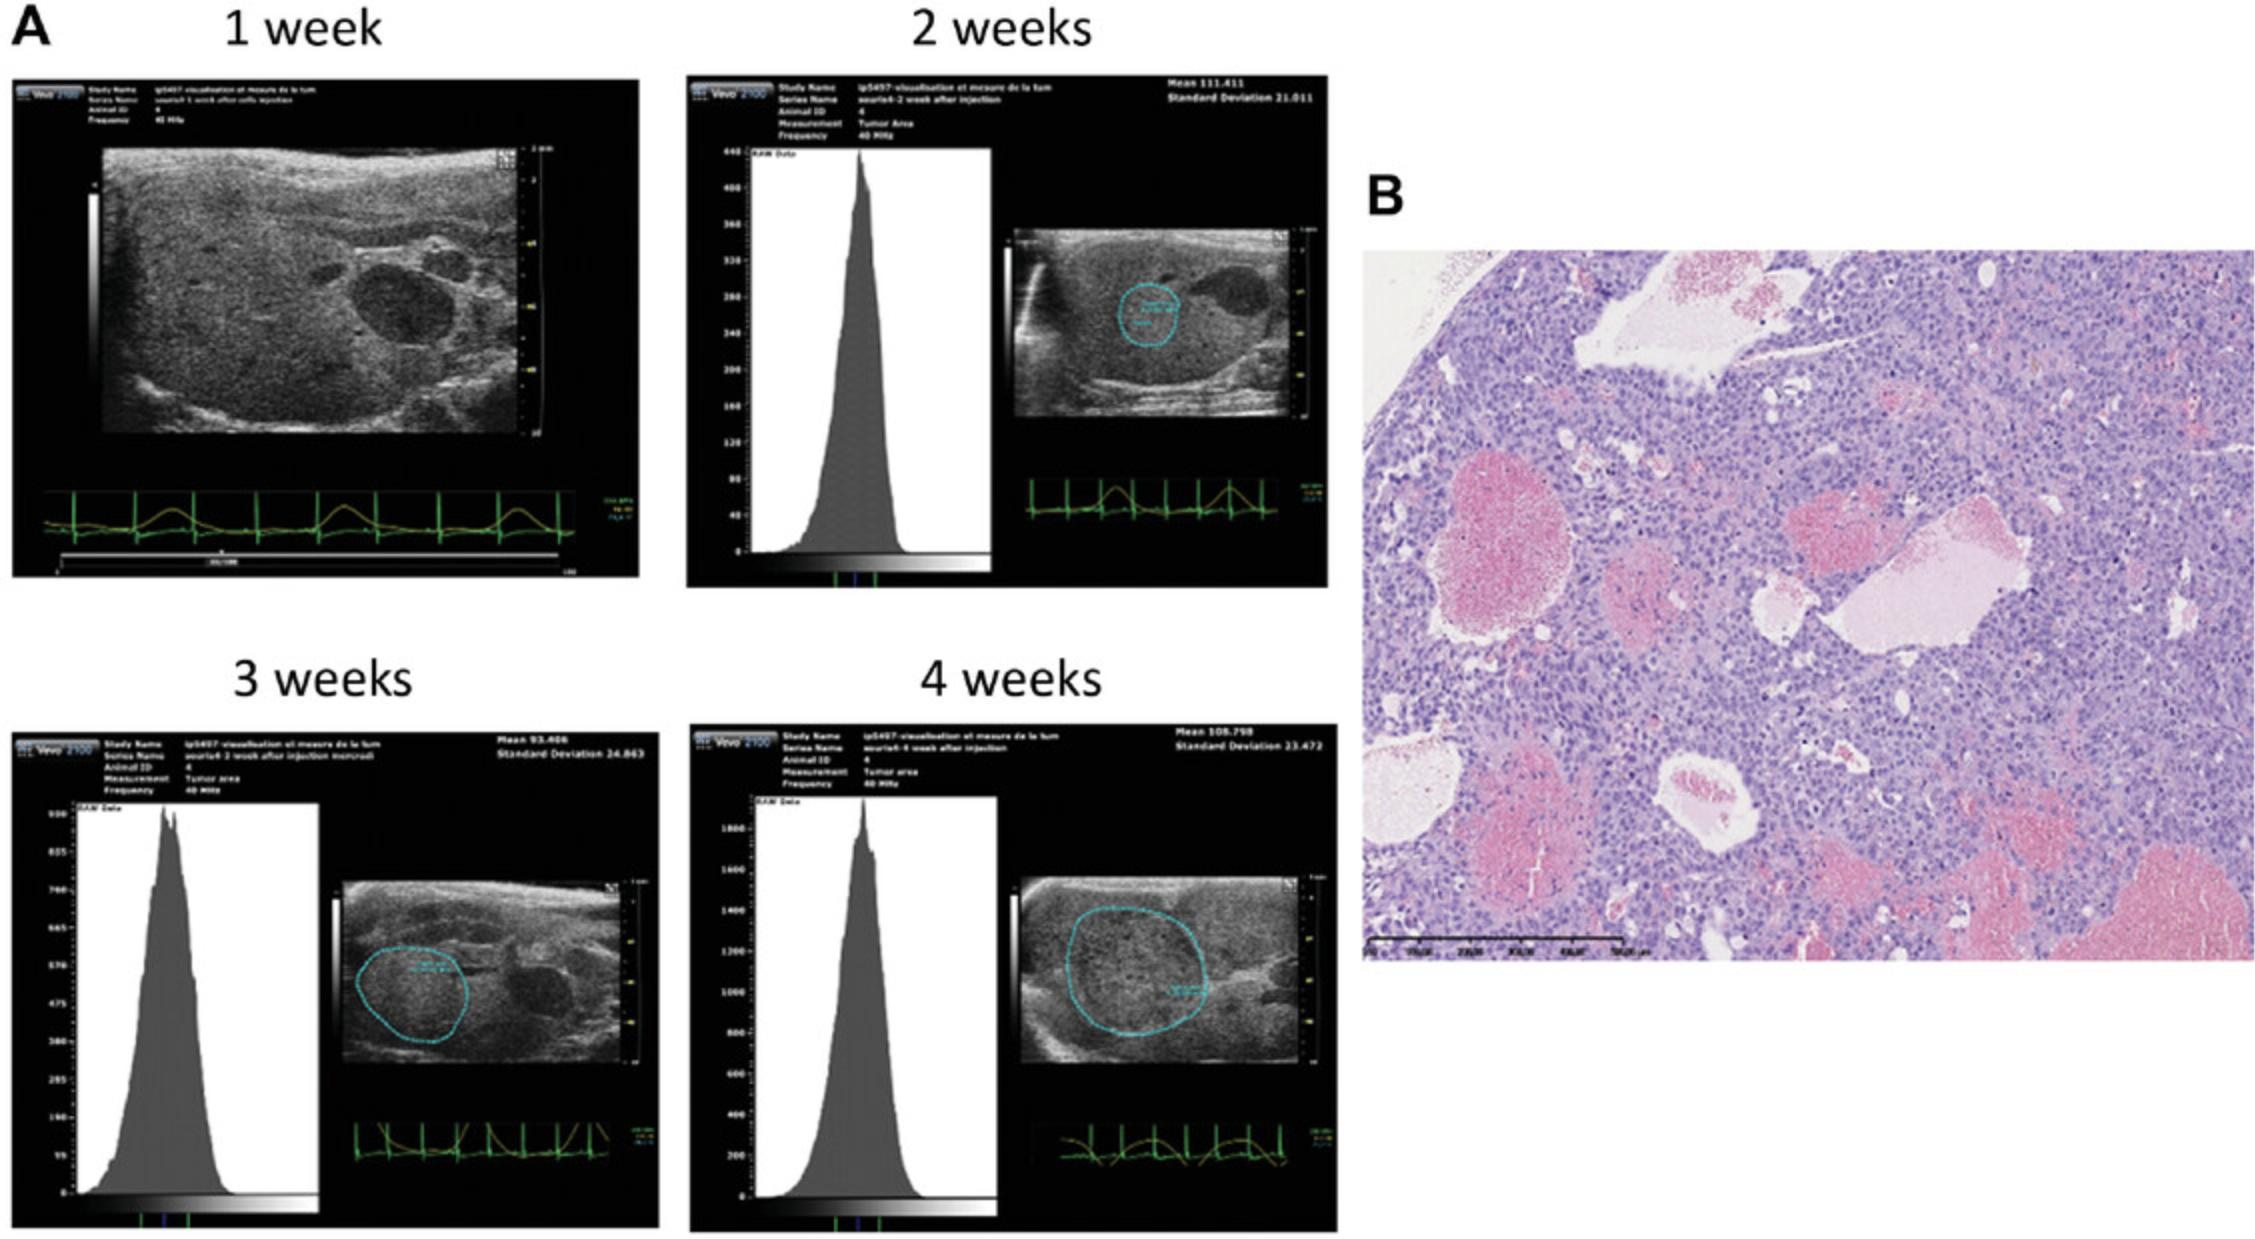
Tumorigenicity of the Huh-7 cell line was confirmed by less-invasive echo-guided intrahepatic injection into nude mice. We observed the presence of solid tumors 2 weeks after injection in 56 of 58 injected mice (95%) with no evidence of infection. The tumor grows quickly to reach ethical limits (1000 mm3) by 5 weeks after injection (Fig. 5A).
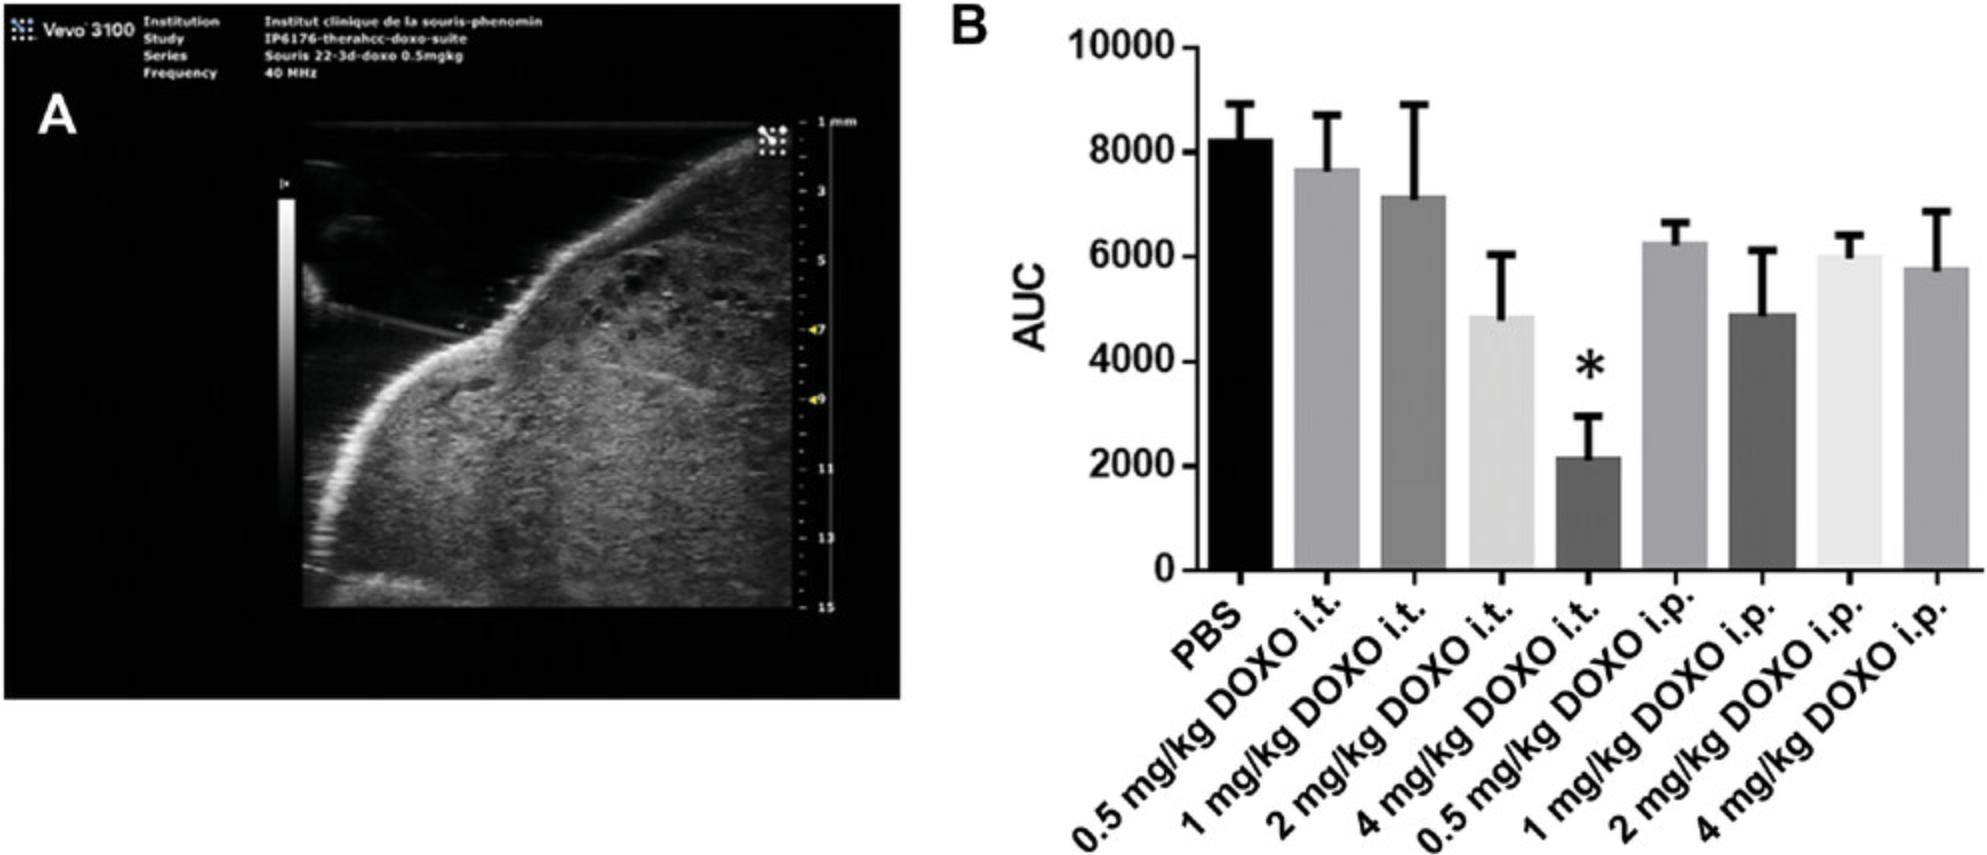
Sensitivity to doxorubicin of Huh-7 cells was compared using direct intratumoral (Fig. 5B) versus intraperitoneal injection of doxorubicin with increasing doses. The effect of intratumoral 4 mg/kg doxorubicin injection was more pronounced than in mice treated by intraperitoneal injection and in the control saline-treated group. A dose-dependent decrease in tumor size was observed by this local route of delivery (Fig. 5B). All data were extracted from longitudinal follow-up of tumor development. At each time point the volume of the tumor was measured as described in Basic Protocol 2. Doxorubicin-treated mice were compared to their respective controls. Results are expressed as mean of the tumor volume at each time point among mice of a given group. For each mouse, the area under the curve of tumor development is used as a single value giving information on both size and speed of growth.
Time Considerations
Cell culture
Timing is calculated for producing 80 × 106 cells, the quantity needed for injecting 20 mice. Thawing the cells requires 15 min. Culturing Huh-7-Luc cells requires about 20 to 40 min each day of cell passaging (days 3 and 6) and 5 min for other days. Preparing Huh-7-Luc cells the day of injection (day 9) requires about 1 hr. We generally start at 9:00 AM, and the cells are ready for injection around 10:00 AM. Cells are kept on ice until the beginning of the afternoon, when the last mouse is injected.
Mouse injection
Upon delivery, nude immunodeficient mice are housed in a maximum barrier facility with pressurized, sterile, individually ventilated cages and sterile food, water, and bedding. Animal caretakers should wear protective equipment, sterile scrubs, frocks, gloves, masks, and hair coverings at all times. Mice should be tagged or otherwise labeled using approved procedures 1 week after acclimation. The time required for these steps is 4 hr for care upon delivery and 1 hr for tagging/labeling. The injection procedure requires around 25 min per mouse, which takes into account preparation of the mouse (5 min), preparation of the materials (10 min), and injection (10 min). The same experimenter can prepare, anesthetize, and inject each mouse.
Acknowledgments
We are grateful to members of the Mouse Clinical Institute (MCI-ICS) for their help and helpful discussion during the project.
This project was supported by the French National Center for Scientific Research (CNRS); the French National Institute of Health and Medical Research (INSERM); the University of Strasbourg and Centres Européen de Recherche en Biologie et Médecine; French state funds through the Agence Nationale de la Recherche under the frame program Investissements d'Avenir (ANR-10-IDEX-0002-02, ANR-10-INBS-07 PHENOMIN); ARC, Paris and Institut Hospitalo-Universitaire, Strasbourg (TheraHCC IHUARC IHU201301187); the Foundation of the University of Strasbourg and Roche Institute (HEPKIN); and the European Union Horizon 2020 research and innovation program under grant agreement nos. 667273 and 671231. This work has been published under the framework of the LABEX ANR-10-LABX-0028_HEPSYS and benefits from funding from the state managed by the French National Research Agency as part of the Investments for the Future Program.
Funders had no role in study design, data collection and analysis, decision to publish, or preparation of the manuscript.
All protocols were reviewed and approved by the Institutional Animal Care and Ethical Committee of the French Research Ministry and conform to French and European regulations regarding the care and use of laboratory animals (authorization number: 2018032911411188; 14314).
Conflicts of Interest
The authors declare no conflicts of interest.
Literature Cited
- Anton, N., Parlog, A., Bou About, G., Attia, M. F., Wattenhofer-Donzé, M., Jacobs, H., … Vandamme, T. F. (2017). Non-invasive quantitative imaging of hepatocellular carcinoma growth in mice by micro-CT using liver-targeted iodinated nano-emulsions. Scientific Reports , 7, 13935. doi: 10.1038/s41598-017-14270-7.
- Davila, J. A., Morgan, R. O., Richardson, P. A., Du, X. L., McGlynn, K. A., & El-Serag, H. B. (2010). Use of surveillance for hepatocellular carcinoma among patients with cirrhosis in the United States. Hepatology , 52, 132–141. doi: 10.1002/hep.23615.
- El-Serag, H. B. (2012). Epidemiology of viral hepatitis and hepatocellular carcinoma. Gastroenterology , 142, 1264–1273. doi: 10.1053/j.gastro.2011.12.061.
- Ferlay, J., Forman, D., Mathers, C. D., & Bray, F. (2012). Breast and cervical cancer in 187 countries between 1980 and 2010. Lancet , 379, 1390–1391. doi: 10.1016/S0140-6736(12)60595-9.
- Heindryckx, F., Colle, I., & Van Vlierberghe, H. (2009). Experimental mouse models for hepatocellular carcinoma research. International Journal of Experimental Pathology , 90, 367–386. doi: 10.1111/j.1365-2613.2009.00656.x.
- Llovet, J. M., Ricci, S., Mazzaferro, V., Hilgard, P., Gane, E., & Blanc, J.-F., … SHARP Investigators Study Group. (2008). Sorafenib in advanced hepatocellular carcinoma. New England Journal of Medicine , 359, 378–390. doi: 10.1056/NEJMoa0708857.
- Pierfelice, T. J., & Gaiano, N. (2010). Ultrasound-guided microinjection into the mouse forebrain in utero at E9.5. Journal of Visualized Experiments , 45, 2047. doi: 10.3791/2047.
- Wu, T., Heuillard, E., Lindner, V., Bou About, G., Ignat, M., Dillenseger, J. P., … Robinet, E. (2016). Multimodal imaging of a humanized orthotopic model of hepatocellular carcinoma in immunodeficient mice. Scientific Reports , 6, 35230. doi: 10.1038/srep35230.
- Zhou, H., & Zhao, D. (2014). Ultrasound imaging-guided intracardiac injection to develop a mouse model of breast cancer brain metastases followed by longitudinal MRI. Journal of Visualized Experiments , 85, e51146. doi: 10.3791/51146.
Citing Literature
Number of times cited according to CrossRef: 3
- Juan Antonio Camara Serrano, Ultrasound Guided Surgery as a Refinement Tool in Oncology Research, Animals, 10.3390/ani12233445, 12 , 23, (3445), (2022).
- Li Yan, Le Li, Qing Li, Yu Zheng, Xiaodong Zhou, Dual-Modality Photoacoustic-Ultrasonic Imaging of Tumors under the Concept of Precision Medicine, 2022 8th International Conference on Big Data and Information Analytics (BigDIA), 10.1109/BigDIA56350.2022.9874203, (1-4), (2022).
- Jeremy Sanderson, Fundamentals of Microscopy, Current Protocols in Mouse Biology, 10.1002/cpmo.76, 10 , 2, (2020).

