Spatially selective stimulation of the pig vagus nerve to modulate target effect versus side effect
Evan N Nicolai, Kip Ludwig, Stephan L Blanz
Abstract
This protocol was used to collect data now published in the Journal of Neural Engineering, Spatially selective stimulation of the pig vagus nerve to modulate target effect versus side effect using the multi-contact ImThera stimulating device. https://doi.org/10.1088/1741-2552/acb3fd
Dataset has been published to pennsieve.io and can be found at: https://doi.org/10.26275/efbj-8evl
Steps
Electrochemical Testing
Cyclic Voltometry (CV) Testing:
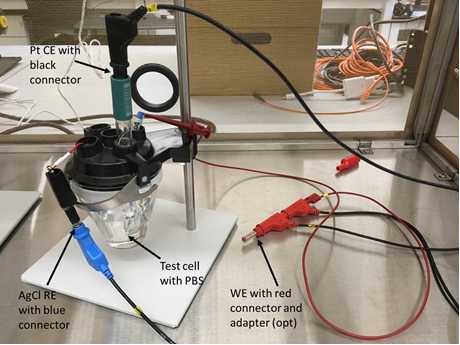
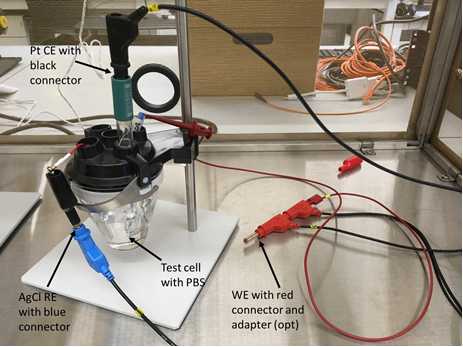
1.Fill test cell with appx. 100 mL phosphate buffered saline (PBS)
2.Put the test cell on the stand inside the Faraday cage and cap
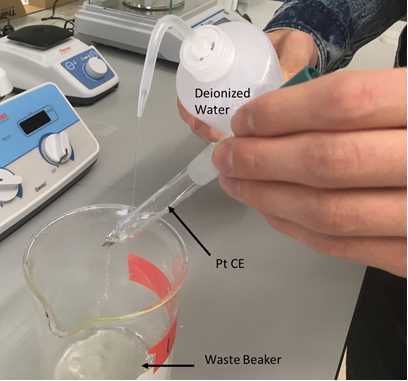
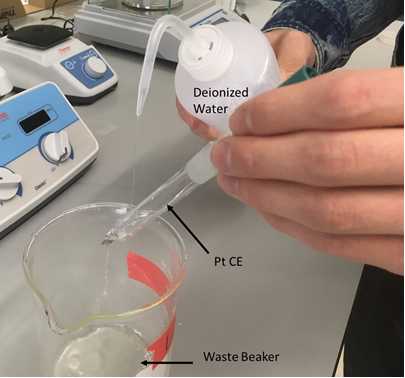
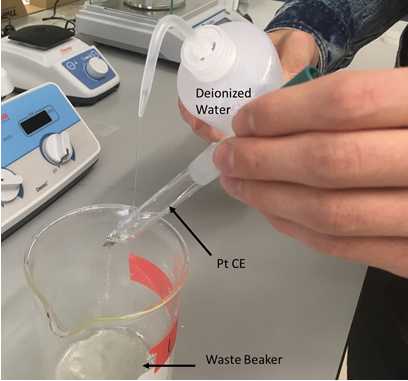
3.Remove Pt Counter Electrode (CE) and AgCl Reference Electrode (RE) from storage containers and rinse with deionized (DI) water over the waste beaker
4.Connect the CE to the black CE lead from the Autolab and place it in the test cell
5.Connect the RE to the blue RE lead from the Autolab using alligator clip adapter and place it in the test cell
6.Rinse the working electrode (WE) being tested with DI water
7.Connect the WE to the red WE lead AND the red S lead using adapters if necessary and place in the test cell.
8.Close Faraday Cage
9.In Nova (Metrohm, Riverview, FL) go to CV procedure open on the PC to check the following parameters are entered:

10.Adjust “Scan rate” and “Number of scans” as is appropriate for the electrode under test. For platinum electrodes a “Scan rate” of 0.01 V/s and a 5-20 scans is appropriate to acquire a stable CV.
11.Run procedure from PC by pressing the run button (looks like play button)
Electrochemical Impedence Spectroscopy (EIS) Testing:
1.Fill test cell with appx. 100 mL PBS
2.Put the test cell on the stand inside the Faraday cage and cap with latch
3.Remove Pt CE and AgCl RE from storage containers and rinse with DI water over the waste beaker
4.Connect the CE to the black CE lead from the Autolab and place it in the test cell
5.Connect the RE to the blue RE lead from the Autolab using alligator clip adapter and place it in the test cell
6.Rinse the working electrode (WE) being tested with DI water
7.Connect the WE to the red WE lead AND the red S lead using adapters if necessary and place in the test cell.
8.Close Faraday Cage
9.In Nova (Metrohm, Riverview, FL) go to CV procedure open on the PC to check the following parameters are entered:
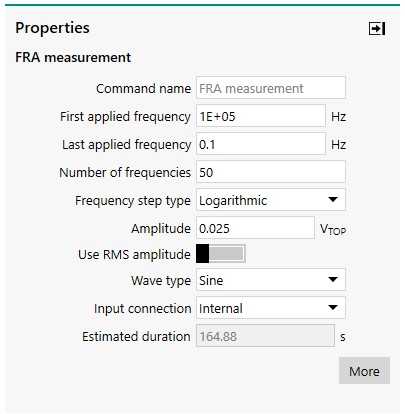
10.Run procedure from PC by pressing the run button (looks like play button)
Voltage Transient (VT) Testing:
1.Fill test cell with appx. 100 mL 1x PBS
2.Put the test cell on the stand inside the Faraday cage and cap
3.Remove Pt CE and AgCl RE from storage containers and rinse with DI water over the waste beaker
4.Connect the CE to the black lead from the Keithley, using adapters if necessary, and place it in the test cell
5.Connect the RE to the oscilloscope reference lead (alligator clip) and place it in the test cell
6.Rinse the working electrode (WE) being tested with DI water
7.Connect the WE to the red Keithley lead AND the oscilloscope probe using adapters if necessary and place in the test cell.
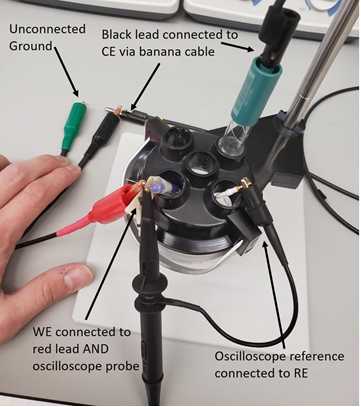
A.ENSURE THE OSCILLOSCOPE PROBE IS SET TO 1X
8.Close Faraday Cage
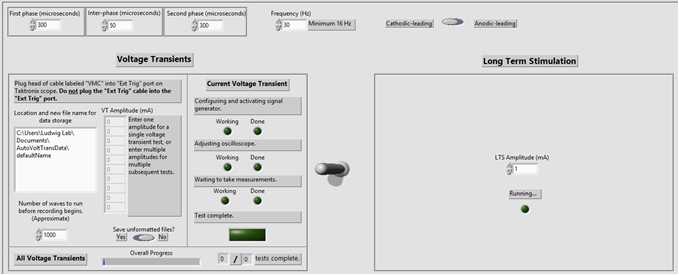
9.Run voltage transient experiment in LabVIEW (National Instruments, Austin, TX)
10.Afterwards, disconnect, rinse, and store all electrodes, clean all glassware, and shut down instruments.
Animal preparation and initial administration of anaesthesia
Weigh pig, and perform an intramuscular injection of a mixture of telazol (6 mg/kg) and xylazine (2 mg/kg). Intubate and ventilate the pig and anesthetize using isoflurane gas (0.5-3% in room air) and IV Fentanyl (12-30 mcg/kg/hr) via Landmark Veterinary Anesthesia Machine VSA-2100 (Louisville, KY) with Midmark Matrx Model 3000 ventilator (Dayton, OH) and SurgiVet SOMNI 3 vaporizer (Plymouth, MN).
Position the pig in supine position and record heart rate via EKG 5-lead EKG setup, pulse rate and SpO2 via infrared (IR) probe placed on either the tongue or lip (AD Instruments PowerLab 8/35).
Invasive blood pressure recording
Place an invasive blood pressure catheter (Millar Inc., Houston, TX, Model #SPR-350S) into either the right or left femoral artery.
Cervical vagus nerve preparation
Ensuring the pig is in supine position with neck extended (flexed), make a single incision on the right side of the neck, lateral to the thyroid cartilage (approximately 2 cm lateral to midline), using electrocautery. Continue the incision through the skin and superficial fat layers between the mandible and sternal notch. Use blunt dissection to expose the right carotid sheath and isolate the right vagus nerve from the carotid artery.
Use blunt dissection to locate the superior and recurrent laryngeal branches of the vagus nerve (VN).
The superior branch inserts into the vagus trunk near the nodose ganglion and projects towards the thyroid cartilage. The nodose ganglion should be near the carotid bifurcation of the carotid artery, and will look like an enlargement (diameter) along the length of the nerve. Place a loose suture tie around the branch to locate the branch easily later.
The recurrent branch inserts into the vagus trunk within the thorax, and thus cannot be identified within the cervical surgical window for the left or right side vagus trunk. The branch must be located along the length of the trachea projecting towards the thyroid cartilage. Place a loose suture tie around the branch to locate the branch easily later.
Use blunt dissection to expose as much length of the vagus trunk as possible. Ideally, at least 8 cm from the superior laryngeal branch insertion point (nodose ganglion) to a more caudal location.
Stimulation and Recording Equipment Setup
Place the six-contact ImThera cuff electrode (LivaNova, London, UK) on the right VN caudal to the nodose ganglion (~1.1 mm). Use a 7-0 silk suture tied around the device to keep it stationary. Ensure to minimize mechanical forces on the VN from implanting the device.
To ensure that no movement had occurred during the procedure, the placement of the cuff on the nerve (longitudinal location and relative rotation) was recorded and measurements to known landmarks (e.g., nodose ganglion) were made before and after the procedure.
Five Longtiudinam Intrafascicular Electrode (LIFE) devices were placed within the VN caudal to the ImThera cuff to record electroneurogram (ENG), caudal to the ImThera cuff. These devices were implanted longitudinally (caudal to cranial) such that the entirety of the recording window was parallel to the course of the nerve. The most cranial LIFE served as a reference electrode for the remaining four LIFE devices. The recording electrodes were staggered in the cranial/caudal direction to discern spatiotemporal aspects of the ENG signals. Cranial/caudal staggering ensured signals were confirmed as neural in origin if temporal differences were observed among recording electrodes. Medial/lateral staggering enabled sampling and later analysis of ENG signals from various locations within the nerve. The distance between the stimulating electrode and the recording electrodes was maximized within the surgical window to reduce the contamination of the neural signals with stimulation artifact. This resulted in an average distance of 7.93 ± 1.75 cm from the caudal edge of the cuff to the most cranial LIFE and 0.79 ± 0.38 cm from the most cranial to the most caudal LIFE.
EMG needle electrode pairs were placed in the cricothyroid, cricoarytenoid, and pharyngeal constrictor muscles.
Place a 18-gauge, stainless steel needle (152 mm2 surface area) within the thoracic wall to serve as the counter electrode.
Stimulation system / Recording system. We used the Tucker Davis Technologies (TDT) systems (Alachua, FL; W8, IZ2MH, RZ5D, RZ6, PZ5, and SIM) were used to control stimulation and to record EMG and ENG signals.
Physiological recordings such as heart rate (HR), pulse rate (PR), and blood pressure (BP), were captured via AD Instruments PowerLab 8/35 and visualized in real time via LabChart (ADInstruments, Sydney, Australia).
Record preliminary data and check background noise levels. Noise should be less than 10 microvolts peak to peak.
Given that these studies are performed in a surgical suite rather than a Faraday cage, additional grounding was performed to reduce noise levels. Specifically, grounding wires were used to connect large metal items (e.g., metal tables and IV poles) in the surgical suite to the ground on the subject interface module. Likewise, some items unnecessary to animal care were removed or unplugged, or turned off. For instance we unplugged devices like the cautery and water heater pump. Warmed blankets were used to keep the pig warm after recordings began.
Experiments
First, safe stimulation limits were determined for each of the six stimulating contacts of the ImThera device. A monopolar, symmetric biphasic rectangular pulse, with 0 ms interphase delay, 0.2 ms per phase, cathodic phase first, 0.4 ms total duration, at a frequency of 25 Hz was delivered between 10 and 30 seconds at 2000 µA. The amplitude was increased by 1000 µA until the animal displayed severe bradycardia (HR < 50 BPM). The amplitude was then decreased and a maximum amplitude was establish to ensure the safety and wellbeing of the aninmal (usually by 500 - 1000 µA).
While recording electroneurography (ENG) and electromyography (EMG) data, electrical stimuli were delivered via TDT to the ImThera device. Each stimulating contact was stimulated sequentially (Contact 1 through 6). The stimulation paradigm for each contact was as follows: 10 random amplitudes between 50 and 5000 µA were selected. For each amplitude the following stimulus was delivered: a monopolar, symmetric biphasic rectangular pulse, with 0 ms interphase delay, 0.2 ms per phase, cathodic phase first, 0.4 ms total duration, at a frequency of 25 Hz and a total of 750 pulses (pulse train). A 60 second delay was incorporated between each pulse train.
Note: this is referred to as the "intact" condition as both the neuromuscular junction and the various branches of the VN are still intact.
To temporarily remove EMG contamination from the ENG recordings, give a bolus of vecuronium (0.1 mg/kg) followed by a continuous drip of vecuronium (3 mg/kg/hour).
Before recording data, stimulate at 1 mA following the bolus injection until neck muscle contraction ceases. Additionally, if real time analysis are available, check the EMG traces for activity.
Begin recording data and repeat the set of stimulations performed in step 18 (stimulating at all 6 contacts at all 10 amplitudes), with the exception of only delivering 25 pulses instead of 750 pulses (1 second of stimulation vs 30 seconds of stimulation).
Wait at least 15 minutes for the vecuronium to wear off.
Stimulate at 1 mA to determine re-engagement of neuromuscular junction witness my muscle activation.
If muscle activation does not occur after 15 minutes, allow 5 minute increments to elapse while testing 1 mA determinant stimulation until muscle activity re-occurs.
The superior laryngeal (SL) branch of the VN was identified and transected, approximately 1 cm from its bifurcation from the VN.
Following transection of the SL branch, the same stimulation paradigm as in step 19 was conducted.
The recurrent laryngeal (RL) branch of the VN was identified and transected. (Step 8.2 has information on identification of RL branch)
Following transection of the RL branch, the same stimulation paradigm as in step 19 was conducted.
The VN was transected cranial and caudal to the ImThera stimulating device (approximately 1 cm away from the device). This was termed "double vagotomy."
Following the double vagotomy, the same stimulation paradigm as in step 19 was conducted.
Following the completion of the aforementioned steps, or 12 hours following initial anesthesia, whichever occurred first, the animal was euthanized using 75-150 mg/kg KCl.
Histological Analysis
All sections were placed in 10% neutral buffered formalin at 4 C for 24-48 hours. Samples then were embedded in paraffin wax and 5 m thick slices, approximately every 40 μm, were collected and mounted on charged slides (Sakura Tissue-Tek VIP).
Slices were stained with Gomori’s trichrome and were imaged with a Motic Slide Scanner (Motic North America, Richmond, British Columbia).
Data Analysis
The ENG and EMG data were digitally filtered using in-house developed software: pyeCAP. pyeCAP is available on PyPI https://pypi.org/project/pyeCAP/ and can be installed in Python using the "pip install pyeCAP" command.
Specifically, we subtracted the median filtered signal (kernel size: 201) from the original signal. Next, we applied a Gaussian filter (standard deviation for Gaussian kernel: 0.87) and a finite impulse response filter to reject common-mode noise and its harmonics (60, 120, and 180 Hz) with 1.0 Hz bandwidth. An additional median filter (kernel size: 11) was applied to EMG signals to eliminate intermittent spikes present only in EMG recordings.
After filtering, neural signals were averaged across pulse trains and segmented into five time-restricted windows based on known conduction velocities per fiber type (i.e., Aα, Aβ, Aϒ, Aδ, and B). The onset of stimulation was set as the time zero starting point. The boundaries of the time-restricted windows were calculated by dividing the distance from the stimulating device to the recording electrode by the conduction velocity of each fiber type.
For neural signals uncontaminated by stimulation artifact, the root mean square of the measured voltage (VRMS) within each time-restricted window was calculated to determine the magnitude of the evoked compound action potential (eCAP) generated by that nerve fiber type.
If neural signals contained noticeable eCAPs but were still contaminated by stimulation artifact despite the preprocessing steps, the signals were processed additionally to isolate the eCAP.
First, to find the onset and offset of the eCAP, the contaminated signals were filtered using a Savitzky-Golay filter to smooth the signal and eliminate false minima (Savitzky & Golay, 1964). Next, a peak-detection algorithm was applied to find the local maximum within the time window for each fiber type. The time points of the closest minima occurring before and after the maximum were classified as onset and offset of the eCAP. The later minimum (offset) could exceed the bounds of the time-restricted window by 25% to allow for the entirety of the signal to be captured. Once the onset and offset of the eCAP were found, these points were superimposed on the filtered signal (without Savitzky-Golay filter). We then calculated the definite integral of the eCAP.
To account for the stimulation artifact, a simplified model of the stimulation artifact was created by forming a line between the onset and offset of the eCAP. The definite integral of this simplified model was subtracted from the definite integral of the signal to give an area measurement of the eCAP.
Dose-response curves (DRCs) were generated for neural, muscle, and physiological responses to randomized stimulation amplitudes. The “intact” condition was used to analyze: 1) nerve fiber responses measured via ENG, 2) muscle response measured via EMG, and 3) changes in HR and BP from baseline measured via EKG and invasive arterial catheter, respectively.
As described above, the magnitude of the eCAPs was calculated either as VRMS or as area-under-the-curve following the peak-detection algorithm. The amplitude of the EMG response was calculated via VRMS; as evoked EMG responses occurred outside of the window contaminated by the stimulus artifact (~5 ms), no stimulus subtraction methods were required to measure the magnitude of the evoked signal.
Changes in HR and BP were defined as the maximum change during a stimulation pulse train from the baseline calculated over the interval immediately prior to stimulation (i.e., t-3 to t-1 seconds before stimulation).
