Resource 1: Scatter Detector Setting Incrementation for FCMPASS
Joshua A Welsh, Sean M Cook, Jennifer Jones
Disclaimer
This protocol summarizes key steps for a specific type of method, which is one of a collection of methods and assays used for EV analysis in the NCI Translational Nanobiology Section at the time of submission of this protocol. Appropriate use of this protocol requires careful, cohesive integration with other methods for EV production, isolation, and characterization.
Abstract
Flow cytometry (FCM) is a common extracellular particles (EPs), including viruses and extracellular vesicles (EVs), characterization method. Frameworks such as MIFlowCyt-EV exist to provide reporting guidelines for metadata, controls, and
data reporting. However, tools to optimize FCM for EP analysis in a systematic and quantitative way are lacking. Here, we demonstrate a cohesive set of methods and software tools that optimize FCM settings and facilitate cross-platform comparisons for EP studies. We introduce an automated small particle optimization (SPOT) pipeline to optimize FCM fluorescence and light scatter detector settings for EP analysis and leverage quantitative FCM (qFCM) as a tool to further enable FCM optimization of fluorophore panel selection, laser power, pulse statistics, and window extensions. Finally, we demonstrate the value of qFCM to facilitate standardized cross-platform comparisons, irrespective of instrument configuration, settings, and sensitivity in a cross-platform standardization study utilizing a commercially available EV reference material.
Steps
Sample preparation
Vortex FluoSpheres bottle on a high setting for 0h 0m 5s.
Create 3 mL of 5E6 p/mL solution of FluoSpheres in a FACS tube.
Pipette 2998.90µL of DPBS into a FACS tube. Label this tube '1E10 Intermediate'.
Pipette 1.10µL stock FluoSpheres into the tube labelled '1E10 Intermediate' . Reverse pipette the tube to mix.
Pipette 990µL of DPBS into a FACS tube. Label this tube '1E8 Intermediate'. Pipette 10µL "1E10 Intermediate" into the tube. Reverse pipette the tube to mix.
Pipette 2850µL of DPBS into a FACS tube. Label this tube 'Beads. Pipette 150µL "1E8 Intermediate" into the tube. Reverse pipette the tube to mix. This should result in a concentration of ~5E6 p/mL of FluoSpheres, and this tube will be used for acquisition.
Pipette 500µL of DPBS into a FACS tube. Label this tube 'DPBS'.
Cytometer Setup
Ensure cytometer is clean and that -Height and -Area statistics are set to be collected on all parameters and that all parameters are on.
On the Cytek Aurora, set window extension to 0. On the CytoFLEX platform turn on 'High Acquisition Mode'.
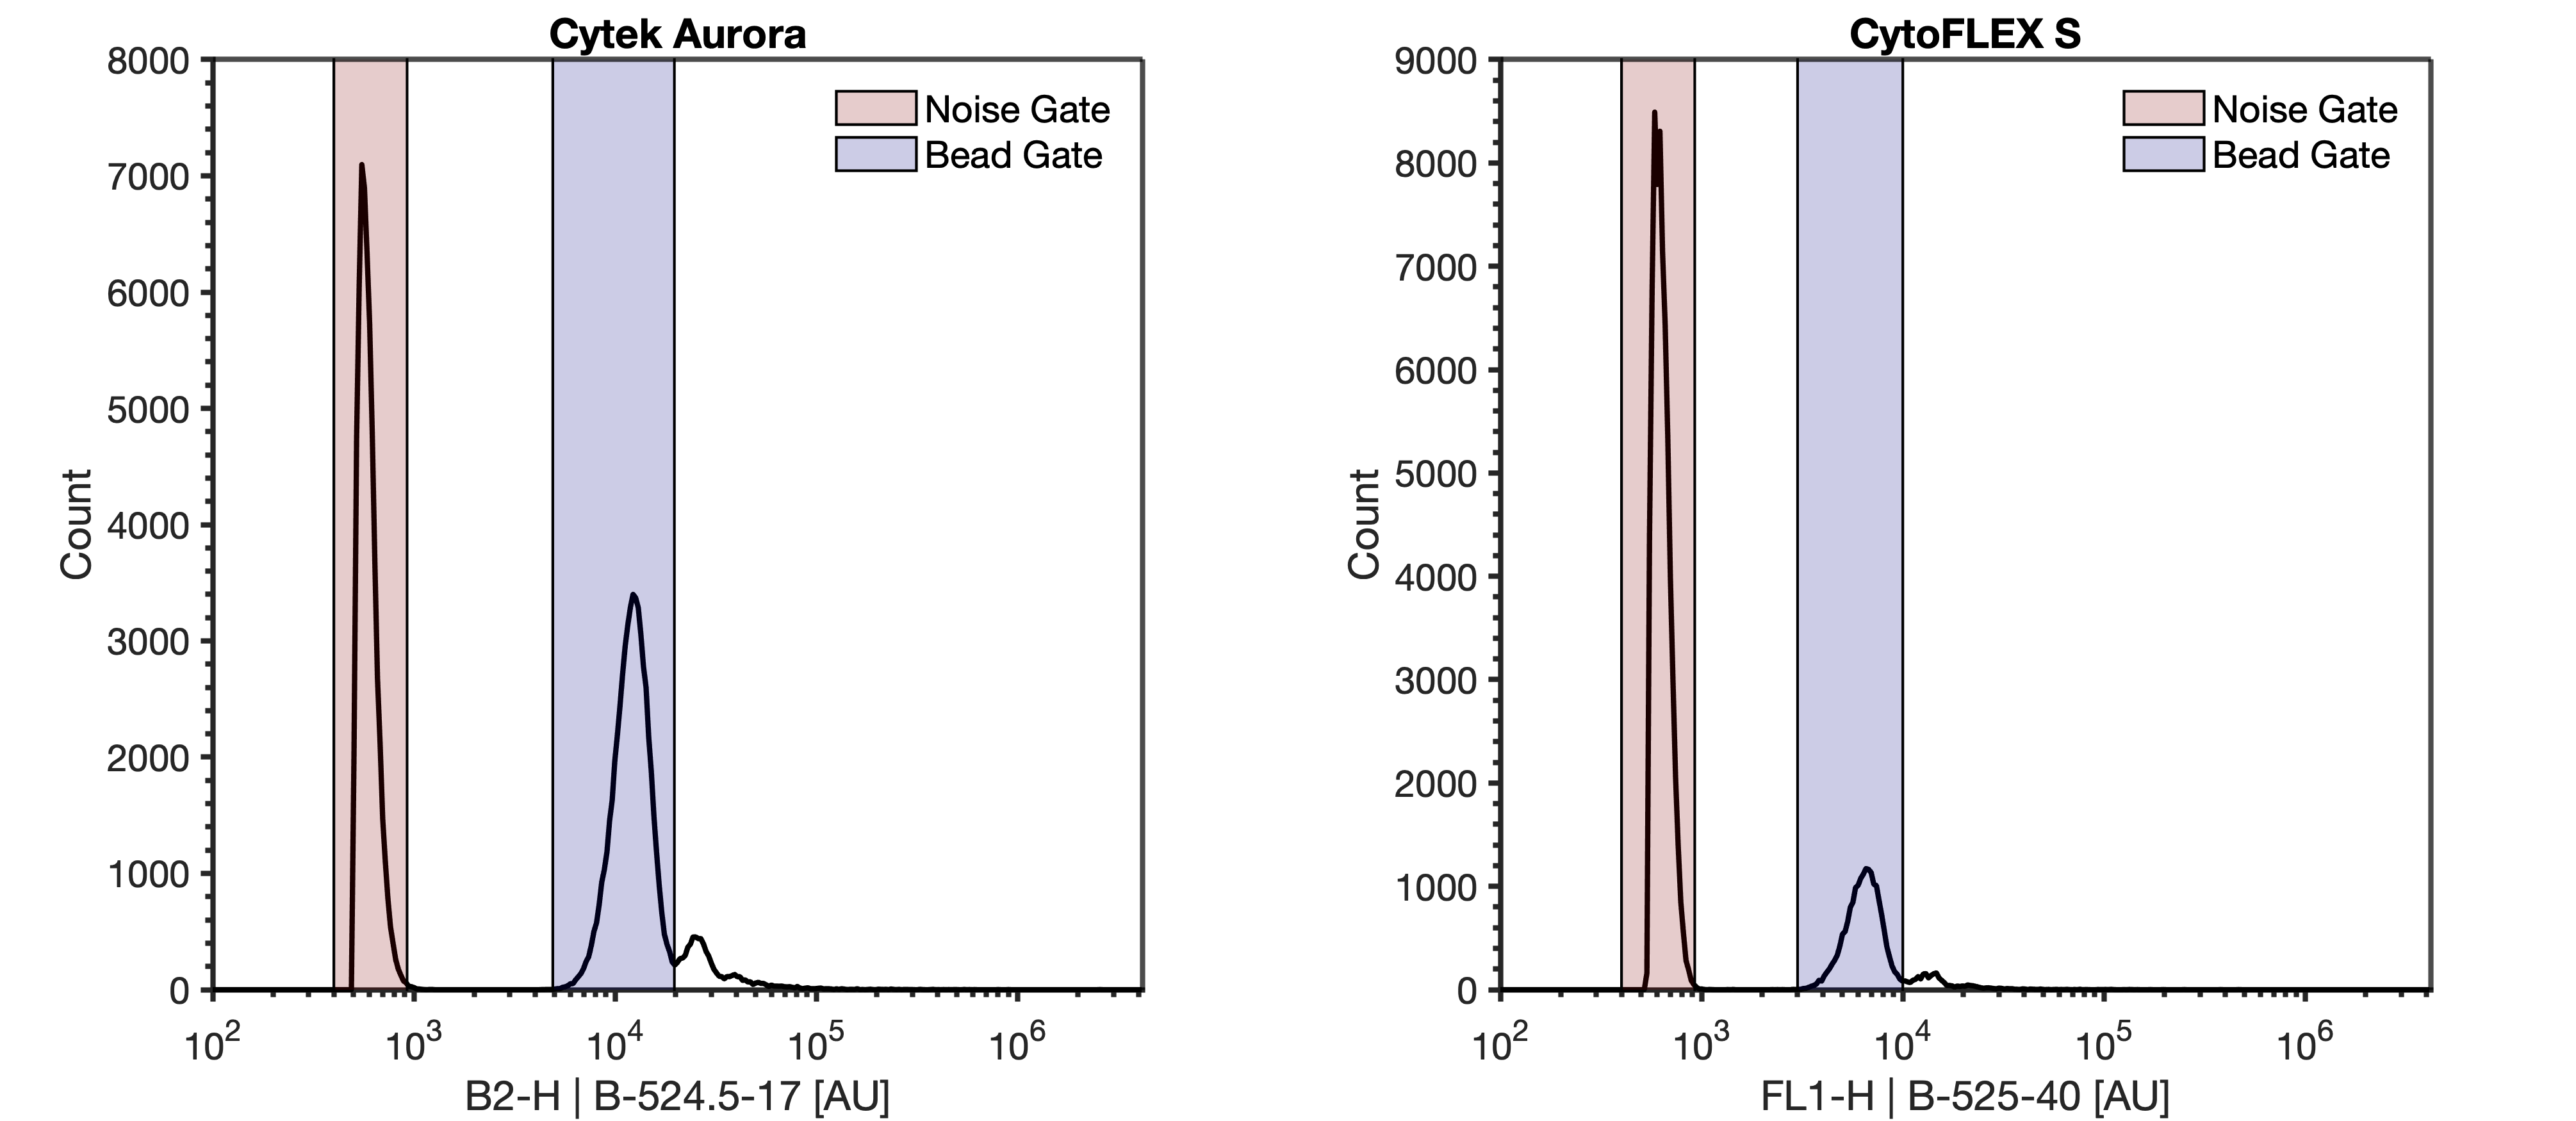
Create a histogram plot with the FITC height parameter (CytoFLEX: FL1-H | B-525-40, Aurora: B2 | B-524.5-17) on the X-Axis and make sure it is plotted on a log-scale.
Set the cytometer triggering threshold to the FITC parameter (CytoFLEX: FL1 | B-525-40, Aurora: B2 | B-524.5-17) . All samples should be acquired with the lowest flow rate, typically ~10-15 µL min-1. -1.
Acquire the 'DPBS' tube while viewing the FITC histogram plot from . Adjust the detector gain or trigger threshold until the instrument noise is being acquired at ~1000 events/sec.

Recording this noise is not necessary as this step is identifying optimal settings.
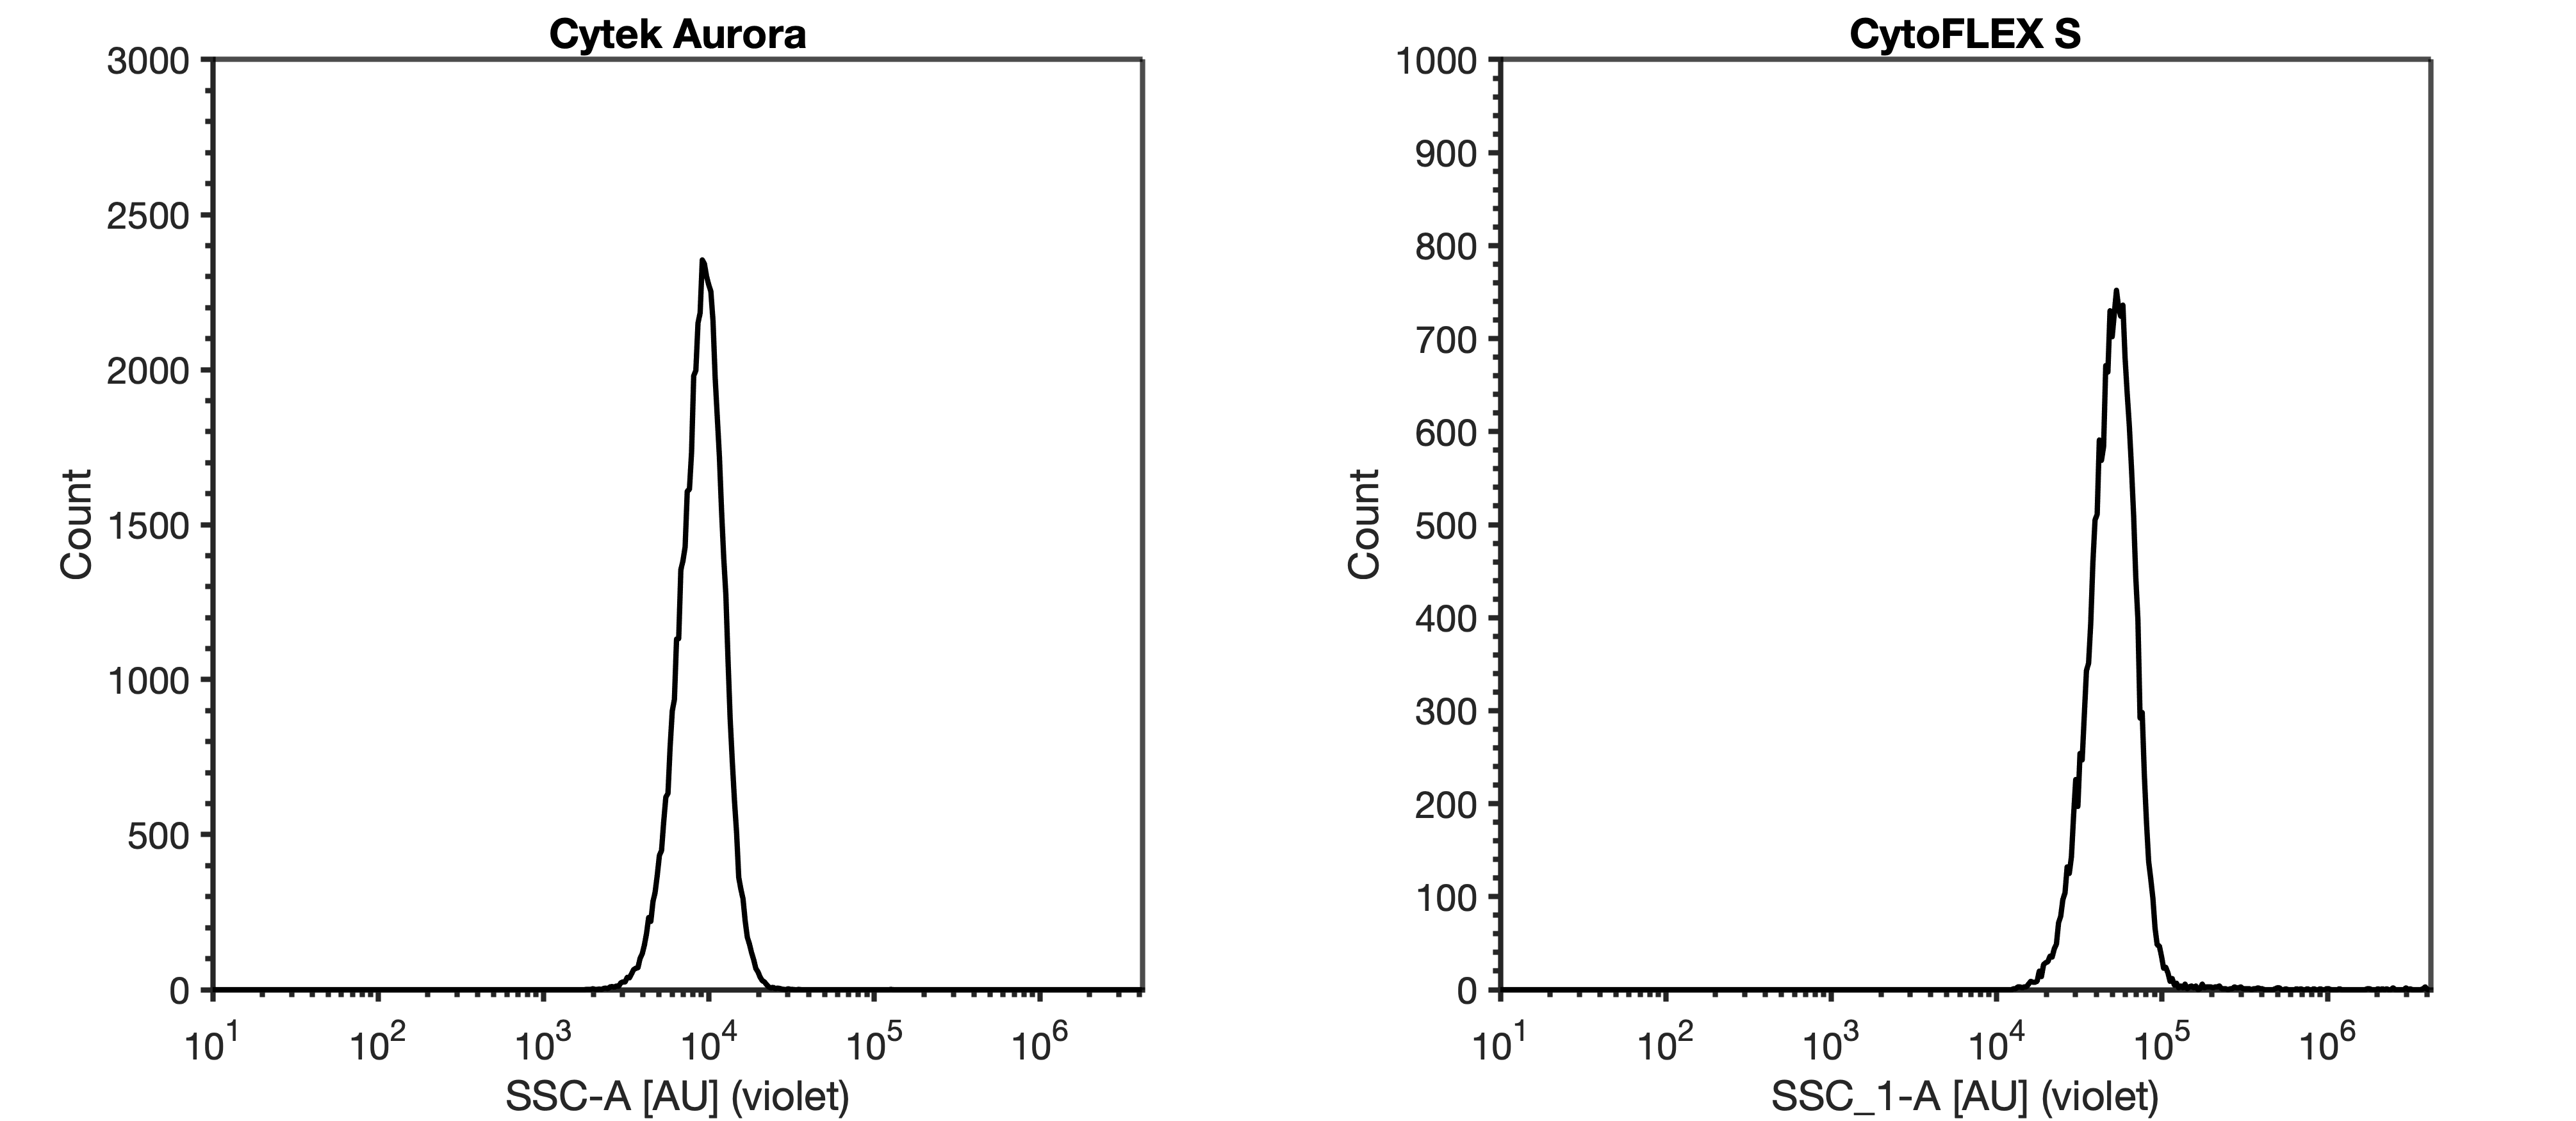
Acquire the "Beads" tube from . Using the plot from , ensure the FluoSpheres are visible on the FITC and violet SSC parameter. Use the FITC trigger settings identified in

Draw a gate around the FluoSpheres on the FITC parameter. Label this gate 'Bead Gate'
Adjust the stopping criteria of the instrument to record until at least 2,000 events are acquired on 'Bead Gate' drawn in .
Performing Voltration
Voltration can now be performed by recording the 'Beads' tube at multiple light scatter detector gains, leaving the trigger threshold and fluorescent gains consistent. It is recommended that a recording of at least 10 light scatter detector settings is taken. Including more increments within a voltration will result in being more confident of the subsequent optimal detector settings.Acquisition Template.xlsx
To ensure accurate data analysis, the FluoSpheres must separate from the noise population on the light scatter parameter on at least two of the selected gains. If they do not, repeat this protocol using a 200 nm FluoSphere population.


