PLATERO: A Calibration Protocol for Plate Reader Green Fluorescence Measurements
Alejandro Vignoni, Yadira Boada
Abstract
One of the most common sources of information in Synthetic Biology is the data
coming from plate reader fluorescence measurements. These experiments provide a measure of
the light emitted by certain fluorescent molecules, such as the Green Fluorescent Protein (GFP).
However, these measurements are generally expressed in arbitrary units and are affected by the
measurement device gain. This limits the range of measurements in a single experiment and
hampers the comparison of results among experiments. In this work, we provide a calibration
protocol to express fluorescence measures in concentration units of a reference fluorophore. The
protocol removes the gain effect of the measurement device on the acquired data. In addition,
the fluorescence intensity values are transformed to units of concentration using a Fluorescein
calibration model. Both steps are expressed in a single mathematical expression which returns
normalised, gain independent, and comparable data, even if the acquisition was done at different
device gain levels. The protocol embeds a Lineararity and Bias Analysis that provides an
assessment of the uncertainty of the model estimations, and a Reproducibility and Repeatability
analysis that evaluates the sources of variability originating from the measurements and the
equipment. All the functions used to build the model, exploit it with new data, and perform the
uncertainty and variability assessment are available in an open access repository.
Before start
Before beginning these protocols, please ensure that you are familiar with the measurement modes and settings of your instrument. For all of these calibration measurements, you must use the same plates and volumes that you will use in your cell-based assays. You must also use the same settings (e.g., filters or excitation and emission wavelengths) that you will use in your cell-based assays. If you do not use the same plates, volumes, and settings, the calibration will not be valid.
Steps
Stock Reference Solution
Start from at least1mL of10micromolar (µM)
[OPTIONAL] If you have access to a spectrophotometer, you can calculate the concentration of your Fluorescein reference stock solution even more accurately using the Beer-Lambert law.
Measure the solution's absorbance at 492 nm and calculate concentration using an extinction coefficient of 68.029 mM-1 cm-1
If the concentration of your stock reference solutions is different than 10micromolar (µM) then you need to recalculate the dilution of the next step to obtain a Dilution 1 solution of 0.625micromolar (µM)
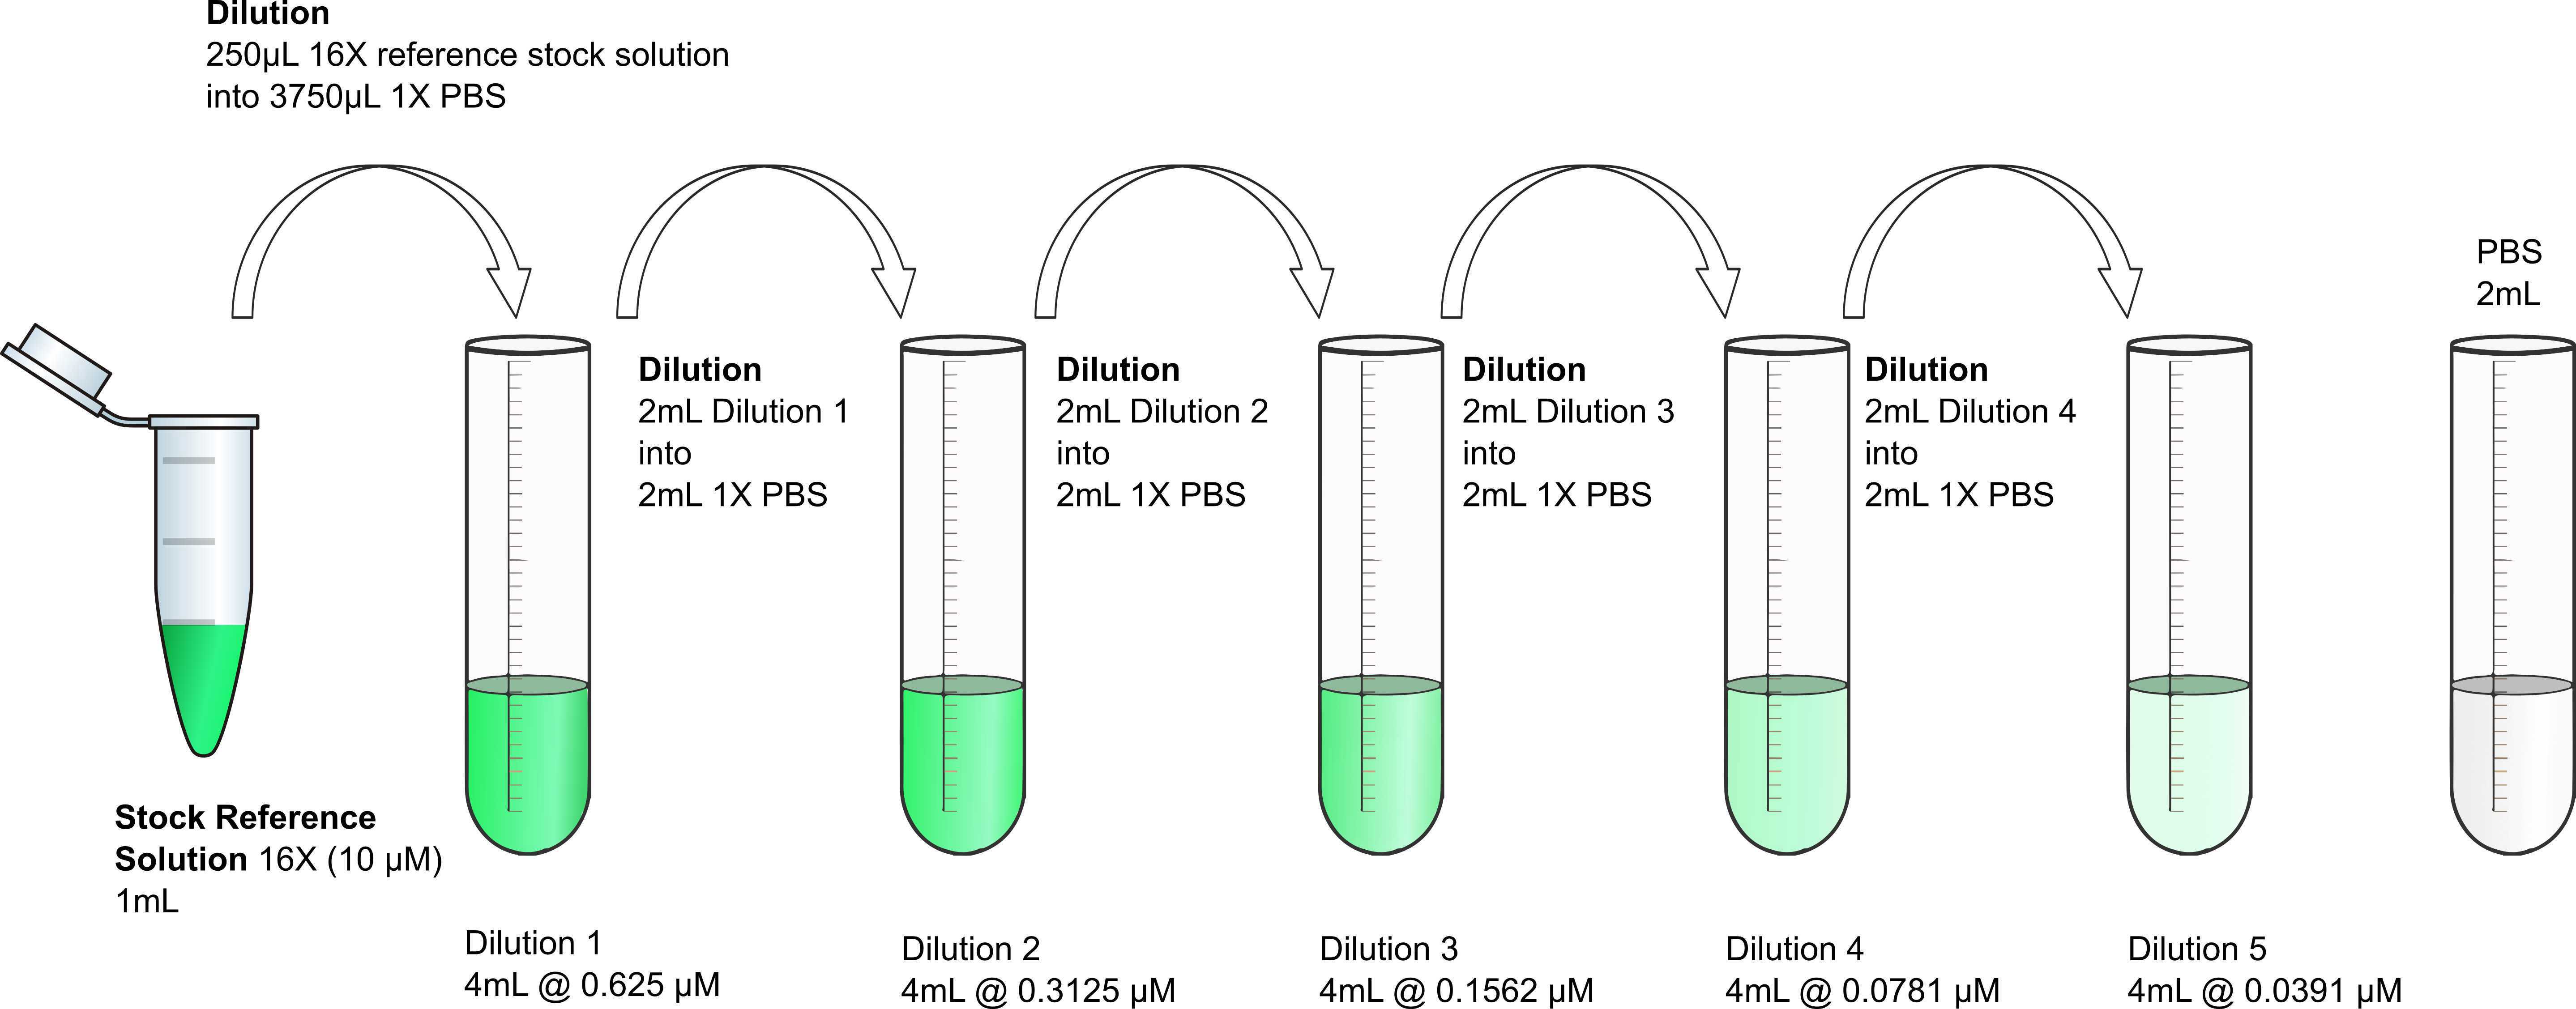
Prepare the starting dilution of Fluorescein solution
Dilute 250µL of the stock reference solution into 3750µL of 4mL of Dilution 1 @ 0.625micromolar (µM)
Prepare the serial dilutions of Fluorescein
Accurate pipetting is essential. Serial dilutions will be performed in 5 tubes. There will be a sixth tube that must contain PBS buffer only . Initially, you will set up 5 tubes labeled Dilution 2 to 5 and PBS, with 2mL of
Then you will perform a serial dilution by consecutively transferring 2mL from Dilution 1 to Dilution 2 and so on, always with good mixing (pipetting up and down three times or more).
Label four tubes with the names Dilution 2 to 5, and one tube with the name PBS.
Add 2mL of
Transfer 2mL of Dilution 1 into Dilution 2 tube. Mix thoroughly by pipetting up and down three times or more.
Transfer 2mL of Dilution 2 into Dilution 3 tube. Mix thoroughly by pipetting up and down three times or more.
Transfer 2mL of Dilution 3 into Dilution 4 tube. Mix thoroughly by pipetting up and down three times or more.
Transfer 2mL of Dilution 4 into Dilution 5 tube. Mix thoroughly by pipetting up and down three times or more.
Transfer 2mL of Dilution 5 into the liquid waste.
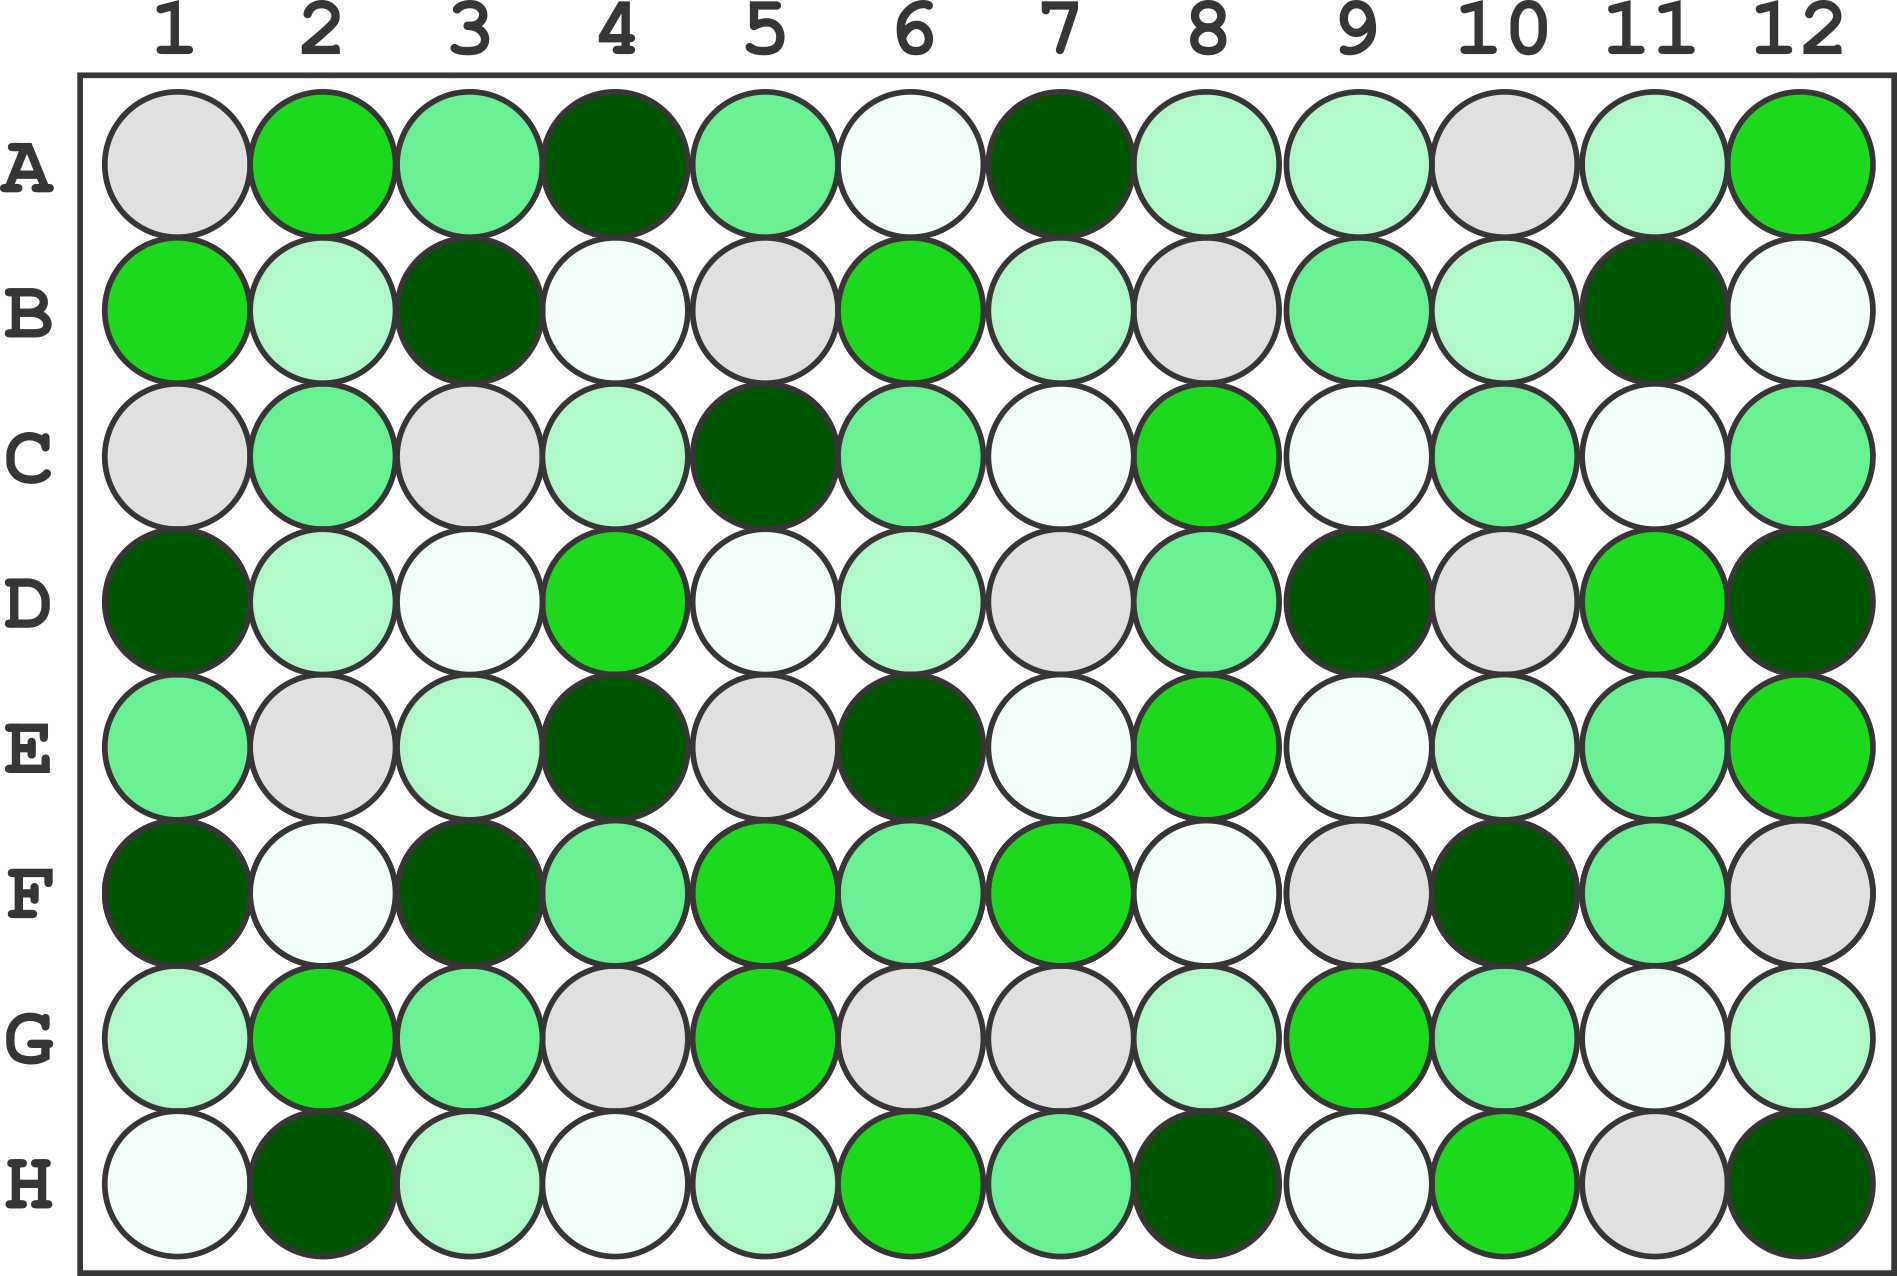
Micro-plate set up
Transfer 100µL of each dilution into the corresponding well using the following plate map:
| A | B |
|---|---|
| PBS | A1, A10, B5, B8, C1, C3, D10, D7, E2, E5, F12, F9, G4, G6, G7, H11 |
| Dilution 1 | A4, A7, B11, B3, C5, D1, D12, D9, E4, E6, F1, F10, F3, H12, H2, H8 |
| Dilution 2 | A12, A2, B1, B6, C8, D11, D4, E12, E8, F5, F7, G2, G5, G9, H10, H6 |
| Dilution 3 | A3, A5, B9, C10, C12, C2, C6, D8, E1, E11, F11, F4, F6, G10, G3, H7 |
| Dilution 4 | A11, A8, A9, B10, B2, B7, C4, D2, D6, E10, E3, G1, G12, G8, H3, H5 |
| Dilution 5 | A6, B12, B4, C11, C7, C9, D3, D5, E7, E9, F2, F8, G11, H1, H4, H9 |
Measure Fluorescence
Measure the fluorescence of all samples in your plate reader, repeat measurements using 4 different gain settings, and then repeat everything 8 times.
Record data
Save your measurements into an excel file with each repetition on a different sheet using the template.
