Modified Arabidopsis Root smRNA FISH Protocol
Susan Duncan, Hans Johansson
Disclaimer
DISCLAIMER – FOR INFORMATIONAL PURPOSES ONLY; USE AT YOUR OWN RISK
The protocol content here is for informational purposes only and does not constitute legal, medical, clinical, or safety advice, or otherwise; content added to protocols.io is not peer reviewed and may not have undergone a formal approval of any kind. Information presented in this protocol should not substitute for independent professional judgment, advice, diagnosis, or treatment. Any action you take or refrain from taking using or relying upon the information presented here is strictly at your own risk. You agree that neither the Company nor any of the authors, contributors, administrators, or anyone else associated with protocols.io, can be held responsible for your use of the information contained in or linked to this protocol or any of our Sites/Apps and Services.
Abstract
Single molecule RNA FISH (smRNA FISH) is an imaging method that labels individual mRNA molecules in cells to facilitate localization and quantitative studies. Here we present a modified protocol for mRNA labelling in Arabidopsis root meristem cells that retains GFP fluorescence. Although the processing steps impact GFP intensity, this protocol demonstrates visualization of RNA together with highly expressed protein. This protocol is presented together with simplified image analysis steps that aim to support inexperienced cell biologists through from experimental set up to mRNA quantification.
Before start
Before starting the fixation step, clean bench surfaces and equipment with RNase Away1. Ensure your 5 nmol dried oligonucleotide probe blend has been suspended in 400µL of TE buffer (10 mM Tris-HCl, 1mM EDTA pH 8.0). This creates a probe stock of 12.5micromolar (µM). To minimise freeze thaw cycles make small aliquots and store them at -20°C
- Prepare
50mL1xPBS using nuclease free 10x PBS and nuclease free water.
Steps
Plant Growth
Sterilize then sow a row of Col-0 Arabidopsis seeds onto half strength Murashige and Skoog Medium (1/2 MS) near the top of a 10 cm square petri plate.
Stratify the seeds at 4°Cfor two days.
Take the plate out of the cold and place it vertically in a growth cabinet set for 16 hours light and 8 hours dark at a constant 20°C (a plate holder can be useful to ensure stability).
Leave seeds to germinate and grow for 5 days
Root Fixation
Prepare 4mL 4% fixative in a 3 cm petri dish by diluting 1mL of 16% methanol free formaldehyde in 3mL of 1x PBS.
Use forceps to remove whole seedlings from the plate and submerge them in the 4% formaldehyde then leave to fix for 0h 30m 0s.
Move seedlings into a fresh petri dish and carry out three washes with 1 x PBS.
Sample Preparation
Arrange 3 plants on a slide, place a No 1 coverslip on top. Then, starting at the root tip, squash each seedling flat using a pencil eraser.
Whilst holding the seedlings under the coverslip with forceps, carefully immerse in liquid nitrogen for 0h 0m 10s.
Immediately after the slide is removed from the liquid nitrogen, flip off the coverslip using a razor blade and carefully scape away the frozen leaves. Leave the slide to air dry for 1h 0m 0s at Room temperature.
Immerse the slide in 70% EtOH in a coplin jar for 1h 0m 0s.
Probe Hybridization
Remove the slide from the ethanol, tip off residual liquid and leave for 0h 5m 0s at Room temperature.
Carry out 1 x 5 min 200µL wash on the slide with freshly prepared 10% (v/v) formamide Wash Buffer A.
Thoroughly mix 100µL of freshly prepared 10% (v/v) formamide Hybridization Buffer with 1µL of each probe type of interest (dissolved to250nanomolar (nM) concentration in TE buffer).
Add to the sample and cover with a Hybrislip , or other suitable plastic cut to size (good results have been achieved using the inside surface of an unused autoclave bag).
Place the slide in a humid, hybridization chamber to the 37°C incubator and leave overnight.
Note: You can make your own hybridization chamber by covering a 10 cm tissue culture plate with black insulation tape. Then line the base evenly with a flat water-saturated paper towels and apply a single layer of Parafilm on top to provide a dry flat surface for the slides. For more details see:
Sample Mounting
Wash slide with 200µL Wash Buffer A, then add another 200µL Wash Buffer A and cover with a fresh Hybrislip (or plastic alternative). Return to 37°Cincubator for 30 mins.
Tip off Wash Buffer A and add 100µL of 1 1µg /mL DAPI Solution (diluted in Wash Buffer A) to each slide. Cover again, place back in the hybridization chamber and return to 37°C incubator for 30 mins.
Tip the DAPI Solution from the slide , then carry out a 200µL Wash Buffer B wash for a minimum of 5 mins.
Tip Wash Buffer B off the slide, then add 20µL of Vectashield mounting media directly onto the root tip area. Carefully cover with a No.1 coverslip and press down firmly with forceps.
Imaging
A wide-field fluorescence microscope is required to image single molecules of mRNA. A high numerical aperture (>1.3) and ideally 100x oil-immersion objectives are ideal. Strong light sources, such as a mercury or metal-halide lamp are ideal, but successful imaging has also been achieved with LEDs. Filter sets must be appropriate for the fluorophores. An EM-CCD camera is ideal, but images can be also be obtained using a standard cooled CCD camera that is optimized for low-light level imaging, rather than speed. Z stacks should be set up to fully encompass cell depth and 200 nm steps should be used to provide adequate resolution for analysis.
| A | B |
|---|---|
| Microscope Model and Manufacturer | Zeiss Elyra PS1 inverted wide-field microscope |
| Acquisition software | Zen 2.3 (Black) |
| Objective | Plan-Apochromat 100x/NA 1.46 DIC |
| Immersion | Oil |
| Camera | Andor iXon 897 (512x512, QE>90%) |
| Voxel Size | x/y 100 nm, z 200 nm |
| Frame Averaging | 1 |
| Acquisition | Complete z-stacks were acquired for Q670 probes then DAPI, sequentially. |
| Q670 probe detection laser | 642 nm laser diode |
| Q670 probe emmission bandwidth | LP655 nm |
| Q670 probe exposure time | 1000 ms |
| Q670 probe EM Gain | 24 |
| DAPI detection laser | 405 nm laser diode |
| DAPI emission bandwith | 420-480 nm |
| DAPI exposure time | 300 ms |
| DAPI EM Gain | 25 |
Details of microscope set up used to acquire the images in this study
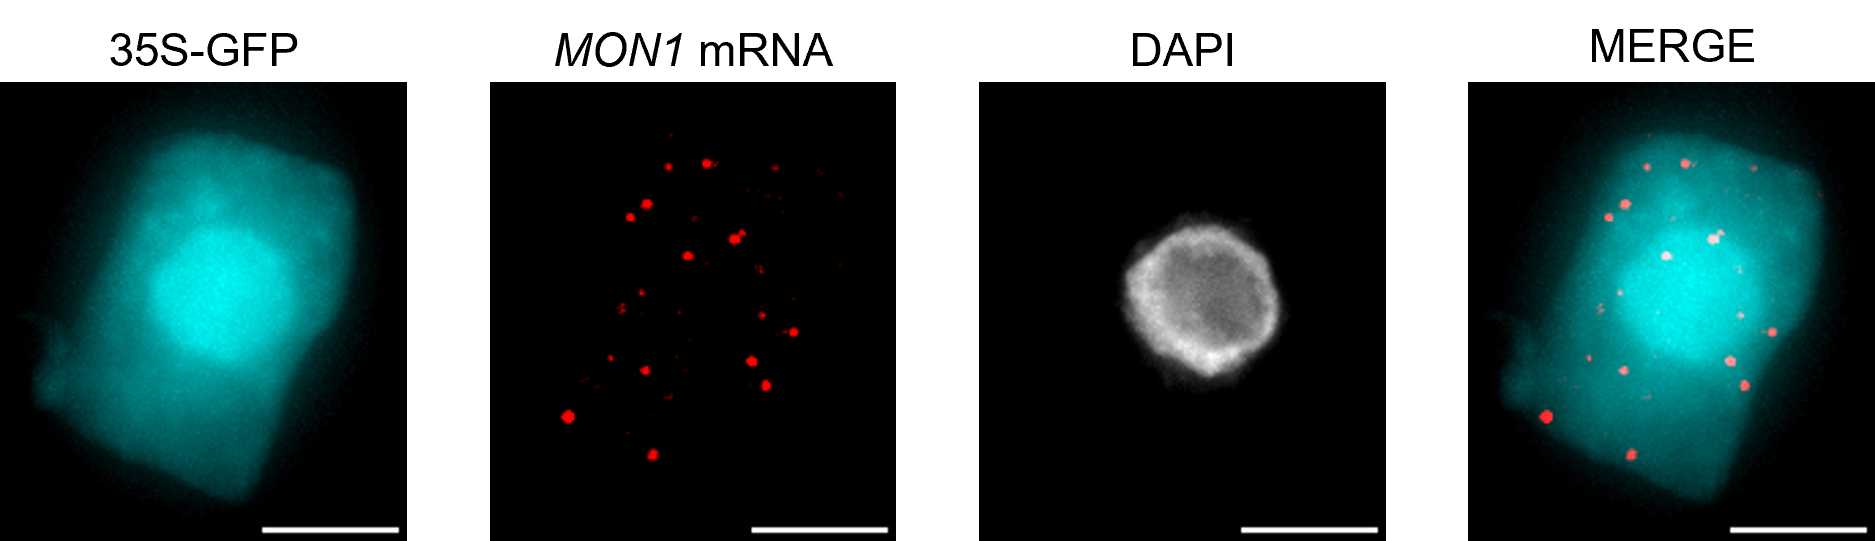
When imaging suitable transgenic lines it is worth checking whether GFP signal has been retained. Below is an example image showing MON1 mRNA in a cell expressing GFP under a 35S promoter.
Basic Image Analysis Steps
Per cell mRNA counts can be achieved by basic FIJI commands
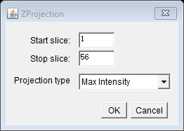
For automated image analysis it is essential that acquisition is completed carefully so that stacks do not include images above or below the cells. This is because if full stack projection is completed blindly it can allow high intensity out-of-focus light to impair smFISH spot detection. If max projection is being completed manually, it is worth specifying the exact top and bottom slices to ensure optimal downstream analysis.
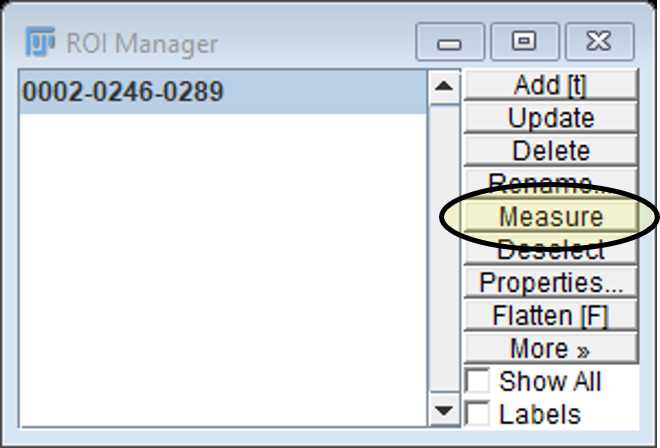
Use the freehand selection tool to draw around the perimeter of the cell. Select this as a region of interest (ROI) by pressing t. This will add the area to the ROI manager.

")
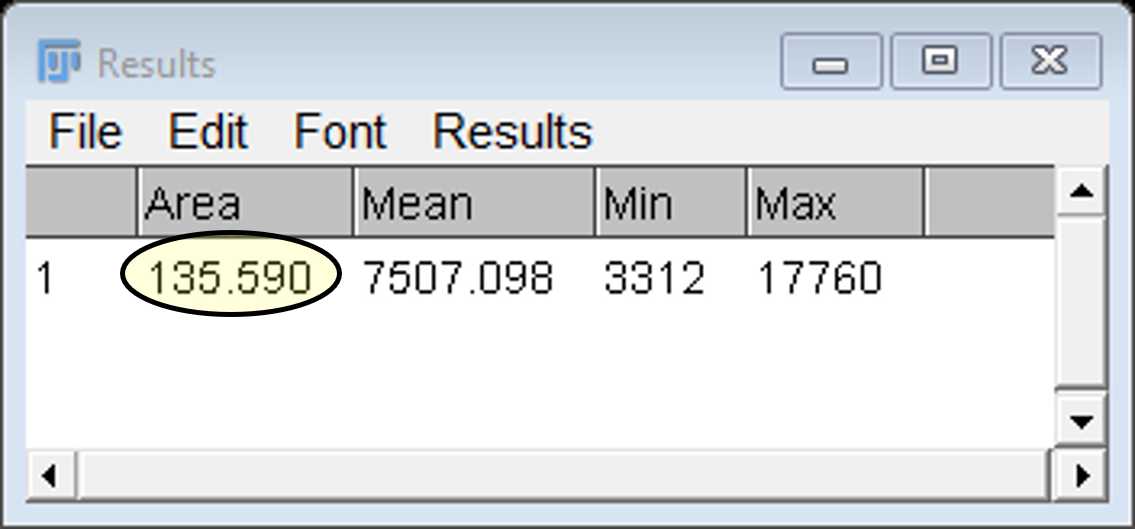
Select the ROI on the manager window and click on measure to open up a results window showing the area (μm2). The mean, min and max fluorescence intensity values of this region are also provided for the channel selected.
Note: Be sure to check that the image file has provided FIJI with calibrated data before trusting these values!

Split the DAPI and mRNA probe channels: Image -> Colour -> Split Channels.
Then select the probe channel to work on next.

We apply the Subtract Background command with a 3 pixel rolling ball radius. This radius setting will depend on you camera set up. We acquire images with 100 x 100 nm pixels so a 3 pixel radius is required to highlight the ~300 nm diameter smFISH spots.

Highlight the cell again again by selecting it in the ROI manager.
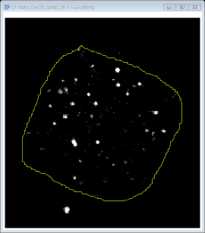
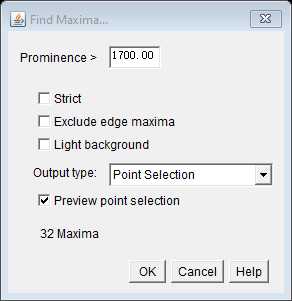
Use the Find Maxima command with a 1700 prominence setting (with preview selected) to highlight and quantify all mRNA signals in this cell. This setting should be considered as a starting point and will differ depending on the microscope set up and probe set. To determine the appropriate setting, compare no probe control and probe images (these must have been acquired using the same microscope settings.) Determine the lowest prominence level that retains spot detection in your probe images, but ignores almost all non-specific spots in the no probe controls. As a guide, for all our reference probe sets, we quantified mRNA labels using 1700 prominence setting and this detected an average of one non-specific signal every 3-4 cells.

Cell volumes can also be estimated for mRNA concentration measurements (mRNA per μm3):
Take the area measurement calculated in step 25 and multiply this by the Z depth
(i.e. the number of Z steps used during image acquisition multiplied by 0.2 μm).
