Liquid chromatography-mass spectrometry method for isomer separation and detection of sugars, phophorylated sugars and organic acids
Somnath Koley, Kevin L. Chu, Saba S. Gill, Doug K. Allen
Central metabolism
isomer separation
isotopic labeling
liquid chromatography-mass spectrometry
metabolite quantification
mixed-mode column chromatography
Abstract
This standard operating procedure is used to achieve effective separation of a wide range of polar metabolites found in central carbon metabolism via a hybrid liquid chromatographic method (ion-exchange chromatography and hydrophilic interaction liquid chromatography (HILIC)) using an Intrada Organic Acid column (Imtakt) coupled with triple quadrupole mass spectrometry. This method gives improved resolution while showing enhanced sensitivity for the detection of low abundance phosphorylated sugars compared with standard HILIC methods.
Before start
This protocol is part of the submitted paper "An efficient LC-MS method for isomer separation and detection of sugars, phosphorylated sugars, and organic acids".
Steps
Abbreviations:
CE: collision energy * CXP: collision cell exit potential
- ddH2O: double-distilled water
- DP: declustering potential
- EP: entrance potential
- FW: fresh weight
- HILIC: hydrophilic interaction liquid chromatography
- HPLC: high-performance liquid chromatography
- ID: isotopologue distribution
- LC-MS: liquid chromatography-mass spectrometry
- MRM: multiple reaction monitoring
- PES: Polyethersulfone
- PIPES: Piperazine-N,N′-bis(2-ethanesulfonic acid)
- PVDF: Polyvinylidene fluoride
Apparatus
Vivaclear Mini 0.8 µm PES clarifying filters (Sartorius #VK01P042)* Durapore membrane filter, PVDF hydrophilic, 0.22 µm , 47 mm (EMD Millipore #GVWP04700)
- HPLC pump: Shimadzu Prominence-xR UFLC system
- HPLC column: Intrada Organic Acid (
150 mmx2 mm,3 µm) - MS detector: Sciex QTRAP 6500 triple quadrupole-linear ion trap MS with a Turbo VTM electrospray ionization source
Preparing metabolite mixes for an external standard curve
A 500micromolar (µM) stock of alpha-ketoglutarate, 2-phosphoglycolate, 2-phosphoglyceric acid, 3-phosphoglyceric acid, 6-phosphogluconate, acetyl-CoA, adenosine diphosphate-glucose, aspartate, dihydroxyacetone phosphate, erythrose 4-phosphate, fructose, fructose 1,6-bisphosphate, glucose 1-phosphate, glucose 6-phosphate, glyceraldehyde phosphate, glucose, glutamine, glutamate, glycerate, malate, phosphoenolpyruvate, piperazine-N,N′-bis(2-ethanesulfonic acid), raffinose, ribitol, ribulose-1,5-bisphosphate, ribulose 5-phosphate, sedoheptulose 7-phosphate, succinate, sucrose, and uridine diphosphate-glucose standards was prepared in ddH2O containing 0.2% (v/v) formic acid.
Prepare a 250micromolar (µM) working stock in ddH2O containing 50% (v/v) methanol and 0.2% (v/v) formic acid.
Filter the 250micromolar (µM) stock through a 0.8 µm PES clarifying filter at 2000x g,4°C,0h 0m 0s for 0h 5m 0s.
Serially dilute the filtered 250micromolar (µM) stock in a filtered ddH2O containing 50% (v/v) methanol and 0.2% (v/v) formic acid to create a standard curve containing 250, 125, 62.5, 31.25, 15.625, 7.813, 3.906, 1.953, 0.977, 0.488, 0.244, and 0.122 µM standards.
Transfer 50µL of each standard concentration into separate 300µL LC vials with inserts.
Preparation of 100 μg/mL PIPES-Ribitol-Norvaline internal standards for sample extraction
These internal standards are used for calculation of extraction efficiencies (PIPES for organic acids, ribitol for sugars and phosphorylated sugars, and norvaline for amino acids).
Prepare separate 1mg/mL stocks for each internal standard in 1mL chilled ddH2O.
For 1mL of 100μg/mL standard mix, mix 100µL of each 1mg/mL stock with 700µL chilled ddH2O.
Add 15µL 100μg/mL PIPES-Ribitol-Norvaline as internal standards during sample extraction. Polar metabolites are extracted using the protocol adapted from Ma et al., 2017, with only a single water extraction step performed and samples being resuspended in 50µL ddH2O containing 50% (v/v) methanol and 0.2% (v/v) formic acid and subsequently filtered through 0.8 µm PES clarifying filters at 2000x g,4°C,0h 0m 0s for 0h 5m 0s.
HPLC conditions
Solvent A: ddH2O containing 100millimolar (mM) ammonium formate and 10% (v/v) acetonitrile * Solvent B: ddH2O containing 1% (v/v) formic acid and 75% (v/v) acetonitrile
- Seal wash: ddH2O containing
20% (v/v)methanol and0.5% (v/v)formic acid - Autosampler wash 1: ddH2O containing
25% (v/v)methanol - Autosampler wash 2: ddH2O containing
75% (v/v)methanol - Vacuum filter buffers using
0.22 µmPVDF hydrophilic membrane filters into clean bottles.
Table 1. HPLC mobile phase gradient
| A | B | C | D |
|---|---|---|---|
| Time (min) | Flow (mL/min) | %A | %B |
| 0 | 0.225 | 0 | 100 |
| 1 | 0.225 | 0 | 100 |
| 5 | 0.225 | 12 | 88 |
| 7 | 0.225 | 12 | 88 |
| 8 | 0.225 | 16 | 84 |
| 10 | 0.225 | 16 | 84 |
| 13 | 0.225 | 25 | 75 |
| 15 | 0.225 | 100 | 0 |
| 19.5 | 0.25 | 100 | 0 |
| 20 | 0.25 | 0 | 100 |
| 25 | 0.25 | 0 | 100 |
-
All samples are diluted in ddH2O containing
50% (v/v)methanol with0.2% (v/v)formic acid. -
A
3µLinjection volume is used, the sample tray in autosampler is held at4°C, and the column temperature is held at40°C.
LC-MS conditions (specific for QTRAP 6500 triple quadrupole MS)
Source temperature: 450°C* Ion spray voltage: -4500 V
- Curtain gas: 30 psi
- Ion source gas 1: 30 psi
- Ion source gas 2: 35 psi
Table 2. LC-MS parameters for each compound
| A | B | C | D | E | F | G |
|---|---|---|---|---|---|---|
| Q1 | Q3 | Compound ID | DP (v) | CE (v) | CXP (v) | EP (v) |
| 145 | 101 | Alpha-ketoglutarate | -5 | -12 | -11 | -10 |
| 155 | 79 | 2-phosphoglycolate | -70 | -20 | -12 | -10 |
| 275 | 79 | 6-phosphogluconate | -65 | -22 | -13 | -10 |
| 808 | 408 | Acetyl-CoA | -35 | -46 | -23 | -10 |
| 588 | 346.1 | Adenosine diphosphate-glucose | -30 | -32 | -21 | -10 |
| 132 | 88 | Aspartate | -20 | -16 | -43 | -10 |
| 199 | 97 | Erythrose 4-phosphate | -5 | -32 | -11 | -10 |
| 339 | 97 | Fructose 1,6-bisphosphate | -60 | -24 | -11 | -10 |
| 145.1 | 108.9 | Glutamine | -30 | -18 | -5 | -10 |
| 146.05 | 102 | Glutamate | -16 | -15 | -8 | -10 |
| 179 | 89 | Hexoses | -25 | -10 | -11 | -10 |
| 259 | 79 | Hexose phosphates | -10 | -28 | -7 | -10 |
| 133 | 115 | Malate | -40 | -20 | -3 | -10 |
| 229 | 79 | Pentose 5-phosphates | -25 | -60 | -15 | -10 |
| 167 | 79 | Phosphoenolpyruvate | -5 | -14 | -9 | -10 |
| 185 | 79 | Phosphoglyceric acids | -30 | -20 | -11 | -10 |
| 301 | 193 | PIPES | -35 | -34 | -31 | -10 |
| 87 | 43 | Pyruvate | -10 | -15 | -3 | -10 |
| 151 | 89 | Ribitol | -50 | -16 | -9 | -10 |
| 309 | 79 | Ribulose 1,5-bisphosphate | -55 | -70 | -9 | -10 |
| 289 | 79 | Sedoheptulose 7-phosphate | -60 | -58 | -9 | -10 |
| 104.001 | 74 | Serine | -16 | -15 | -8 | -10 |
| 117 | 73 | Succinate | -5 | -16 | -7 | -10 |
| 341 | 179 | Sucrose | -110 | -18 | -13 | -10 |
| 169 | 97 | Triose phosphates | -10 | -12 | -11 | -10 |
| 565 | 323.1 | Uridine diphosphate-glucose | -125 | -32 | -2 | -10 |
All analytes are measured in negative ionization mode, with ions being detected using a targeted MRM approach.
Determining sample metabolite concentrations from an external standard curve
Run a full set of all 12 concentrations of the external standard mix on the LC-MS three times total, at the start, middle, and end of sample runs.
Integrate peak areas for each standard peak using the quantitation wizard tool in the Analyst instrument control and data processing software (v.1.6.2) and export the data to Excel.
In Excel, convert peak area units from µM to µmols of compound by multiplying by sample volume (50µL).
Plot the peak areas vs the standard concentrations and fit a linear regression to the data.
For sample runs, compare the measured amounts of PIPES, ribitol, and norvaline internal standards with the known amounts added during sample preparation to calculate the percent metabolite recovery, using PIPES for organic acids, norvaline for amino acids, and ribitol for sugars, nucleotide sugars, and phosphorylated sugars.
For each metabolite, correct for metabolite loss during extraction using the relevant factor.
For each metabolite, calculate the concentration from the sample by solving for x using the linear regression equation of that metabolite’s standard curve.
Calculation of limits of detection (LOD) and limits of quantitation (LOQ)
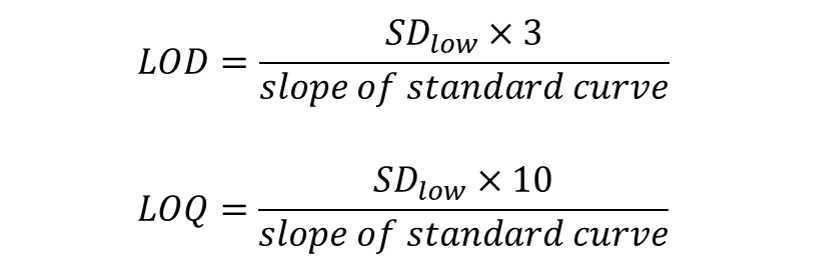
For each metabolite, determine the lowest concentration on the standard curve that still showed a change in peak area. Calculate the standard deviation of this concentration (SDlow) for all three injections.
Calculate the limits of detection and quantitation for each metabolite by multiplying this standard deviation by 3 or 10 and dividing by the slope of the standard curve.
Interpreting 13C-labeling in metabolites
For sample runs investigating 13C-tracer incorporation, the MRM list for compounds of interest was expanded with the set of possible labeled carbon isotopologues in the Q1 ion and the Q3 fragment (if applicable). Since the Q3 fragment for a compound like 3-PGA does not contain any carbons, an increase in label is only possible in the Q1 ion.
Table 3. Monitored isotopologue distribution (ID) for select metabolites
| A | B | C |
|---|---|---|
| Q1 | Q3 | Compound ID (13C in Q1/13C in Q3) |
| 133 | 115 | MAL-0/0 |
| 134 | 116 | MAL-1/1 |
| 135 | 117 | MAL-2/2 |
| 136 | 118 | MAL-3/3 |
| 137 | 119 | MAL-4/4 |
| 185 | 79 | PGA-0/0 |
| 186 | 79 | PGA-1/0 |
| 187 | 79 | PGA-2/0 |
| 188 | 79 | PGA-3/0 |
Once runs are completed, extract the peak intensities (or areas) of the set of isotopologues for each compound.
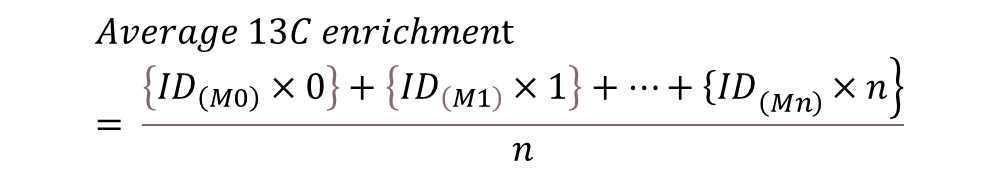
To determine isotopologue distribution (ID) of a particular isotopologue (Mi), divide the abundance (A) of that isotopologue by the sum of all isotopologue abundances for that compound.

Once all of the isotopologue distributions have been determined, the average 13C-enrichment for each compound can be calculated by determining the sum of each isotopologue multiplied by the number of labeled carbons present and dividing by total number of carbons in that compound.