Isolation of Neuronal Nuclei From Human Frozen Post-Mortem Prefrontal Cortex Brain Tissue Using Fluorescence-Activated Nuclei Sorting (FANS) For Methylation Analyses
Alexandra Del Favero-Campbell, Gabriel R Fries
Abstract
There is a need for disentangling the role of transcriptional and epigenetic variation in mental health, disease, and mortality. Although alterations in DNA methylation patterns have been found to be particularly stable and highly concentrated in the brain, the study of bulk tissue, which contains several types of cells, can be limited and potentially significantly mask different alterations driven by specific cell types. Therefore, there is a need for methods to be able to purify specific cell-type populations that can be used in downstream molecular analyses. This protocol describes a methodology that uses fluorescence-activated nuclei sorting (FANS) to overcome these limitations and analyze, specifically, neuronal nuclei from frozen post-mortem prefrontal cortex tissue. Specifically, this protocol was based on recently-published protocols with the same goal with adaptations that have proven to improve yield and quality of the samples in our laboratory using the BD FACSJazzTM cell sorting system. To our knowledge, this is the only published protocol where a methodology for a flow cytometry instrument with a manual laser and sorting alignment is described in detail. This method can be used to purify populations of neuronal (NeuN+) and non-neuronal (NeuN-) nuclei from adult frozen post-mortem brain tissue, with tissue samples yielding purified populations of nuclei amenable to be able to perform analyses of DNA methylation, genotyping, and potentially, open chromatin analysis (via ATAC-seq).
Before start
A day prior to performing immunostaining, prepare your BSA-coated tubes. Add 1mL of 10% BSA solution in ice cold 1x PBS (RNAse-free) to autoclaved 1.5mL Eppendorf tubes (one for each planned nuclei sample). Incubate them for 10 minutes on ice. Rinse them with ice cold 1x PBS (RNAse-free) and let them dry at 4oC overnight ( open lid ).1. A day prior to performing FANS, prepare your coated collection tubes. Add 500uL of ice cold 1x PBS (RNAse-free) solution, 25uL of RNAse Inhibitor (40U/uL), and 500uL of 10% BSA solution to your autoclaved and prechilled 1.5mL LoBind Eppendorf tubes that you will be using to collect your sorted nuclei samples (you should create at least 2 tubes for each sample: one for NeuN+ nuclei and one for NeuN- nuclei. It is recommended to make at least 4 tubes for each sample to better prevent potential overflow of sorted nuclei). Close lids and gently invert tubes a few times. Incubate tubes on ice for 10 minutes. Rinse each tube with 1mL ice cold 1x PBS (RNAse-free) and let it dry at 4oC overnight ( open lid ).
Steps
Part A. Nuclei Isolation [~1-2 hours]
100mg of frozen human post-mortem prefrontal cortex tissue. It is important to note that recovery may vary from sample to sample due to high inter-sample variability. Refer to Tables 1, 2, and for details about equipment items that are required and for the specifications of the reagents that are required for each section of this protocol. Prepare Homogenizing Buffer (HB) solution and keep it On ice. Pre-chill (i.e., Fast temp) your centrifuge to ,4°C,0h 0m 0s before starting. Make sure that homogenizers and pestles are pre-chilled and sitting On ice before use. Place the autoclaved forceps and scalpel at -80°C. (Note: you can also place a Petri dish on dry ice, if you would like to chop up the brain sample into smaller pieces before transfer).
Weigh Eppendorf tubes with sample tissue (you want around 100mg) of sample tissue to be placed in each homogenizer (keep these at -80°C).
Transfer the 100mg brain chunks to their corresponding homogenizers (On ice ). Use the pre-chilled/frozen forceps and scalpel to help you do this.
While On ice, place 600uL of Homogenizing Buffer into each homogenizer. Use 600uL of Homogenizing Buffer to “wash out” the tubes that contained the tissues 3 times (if the tissue came out of multiple tubes, wash out each tube once or twice (i.e., 600uL of Homogenizing Buffer to wash out the tube twice)). This helps make sure that you are getting as much of the tissue as possible out of the Eppendorf tubes. Your homogenizer should have a final volume of around 2.4mL of Homogenizing Buffer in them (plus the brain tissue sample) once this process is done.
Use a spray of RNaseZapTM on a KimwipeTM to lightly wipe the pestle before using it to homogenize (Note: Make sure it is dry before using it to administer your manual strokes). With the homogenizer in a beaker of ice On ice , administer 30 slow and gentle manual strokes to homogenize the tissue using the pestle to move the pestle up and down, using a gentle grinding motion when touching the bottom of the homogenizer tube. (Note: Try not to lift the pestle completely out of the liquid, as this will create bubbles and foaming, which can cause problems).
Once this homogenizing is complete, use a hemocytometer (10uL of sample + 10uL of Trypan Blue) to check whether there are still remaining clumps (or whether too many strokes have been administered). If there are cell clumps visible, then this means you must administer more manual strokes (too few strokes administered). However, beware because too many strokes can result in damaged nuclei.
Use sterile cell strainer caps to filter the homogenate from each homogenizer into a 15mL Falcon Tube On ice.
Take an aliquot (10uL) to check the sample for nuclei and removal of debris using the hemocytometer again (10uL of sample + 10uL of Trypan Blue).
Repeat steps 8-9 ( and ) several times to try to remove as much debris as possible (around 1 to 3 times, checking with a hemocytometer for appearance of nuclei and removal of debris each time).
Separate filtered homogenate samples into 2 pre-chilled autoclaved 1.5mL LoBind Eppendorf tubes (4 tubes used if running 2 samples of tissue (100mg each); if running only 1 sample, split homogenate into 2 pre-chilled autoclaved LoBind Eppendorf tubes On ice). Make sure to evenly transfer sample(s) into tubes.
Centrifuge tubes at 1000rcf for 8 minutes at 4oC. 1000rcf,4°C
Gently discard the supernatant from the tubes On ice . Try your best not to disturb the pellets (it is okay to leave just a small amount of liquid in the tubes, if it is not possible to get it all out without disruption of the pellet).
Gently resuspend each pellet in each tube in 225uL of cold Homogenization Buffer On ice . Once resuspended, pool split tubes back together On ice . Do this by placing the pooled resuspended liquid into a prechilled 2mL LoBind Eppendorf tube (1 tube for each original sample) On ice . Final volume in each tube should be about 450uL.
Place 450uL of ice cold 50% (v/v) Iodixanol solution into each 2mL LoBind Eppendorf tube with pooled resuspended pellets and gently mix together with a pipet (by gently pipetting up and down a few times) On ice . Final concentration of Iodixanol will be 25%.
Place 900uL of ice cold 29% (v/v) Iodixanol solution into a new pre-chilled 2mL LoBind tube (1 tube for each re-pooled sample) On ice .
Gently and slowly overlay the 29% Iodixanol solution with 900uL of the 25% Iodixanol solution (i.e., the mixed 50% Iodixanol solution + the re-pooled sample solution) by slowly adding it from the top edge of the tube, so that it slowly trickles down into the tube On ice (see Figure 1 ).
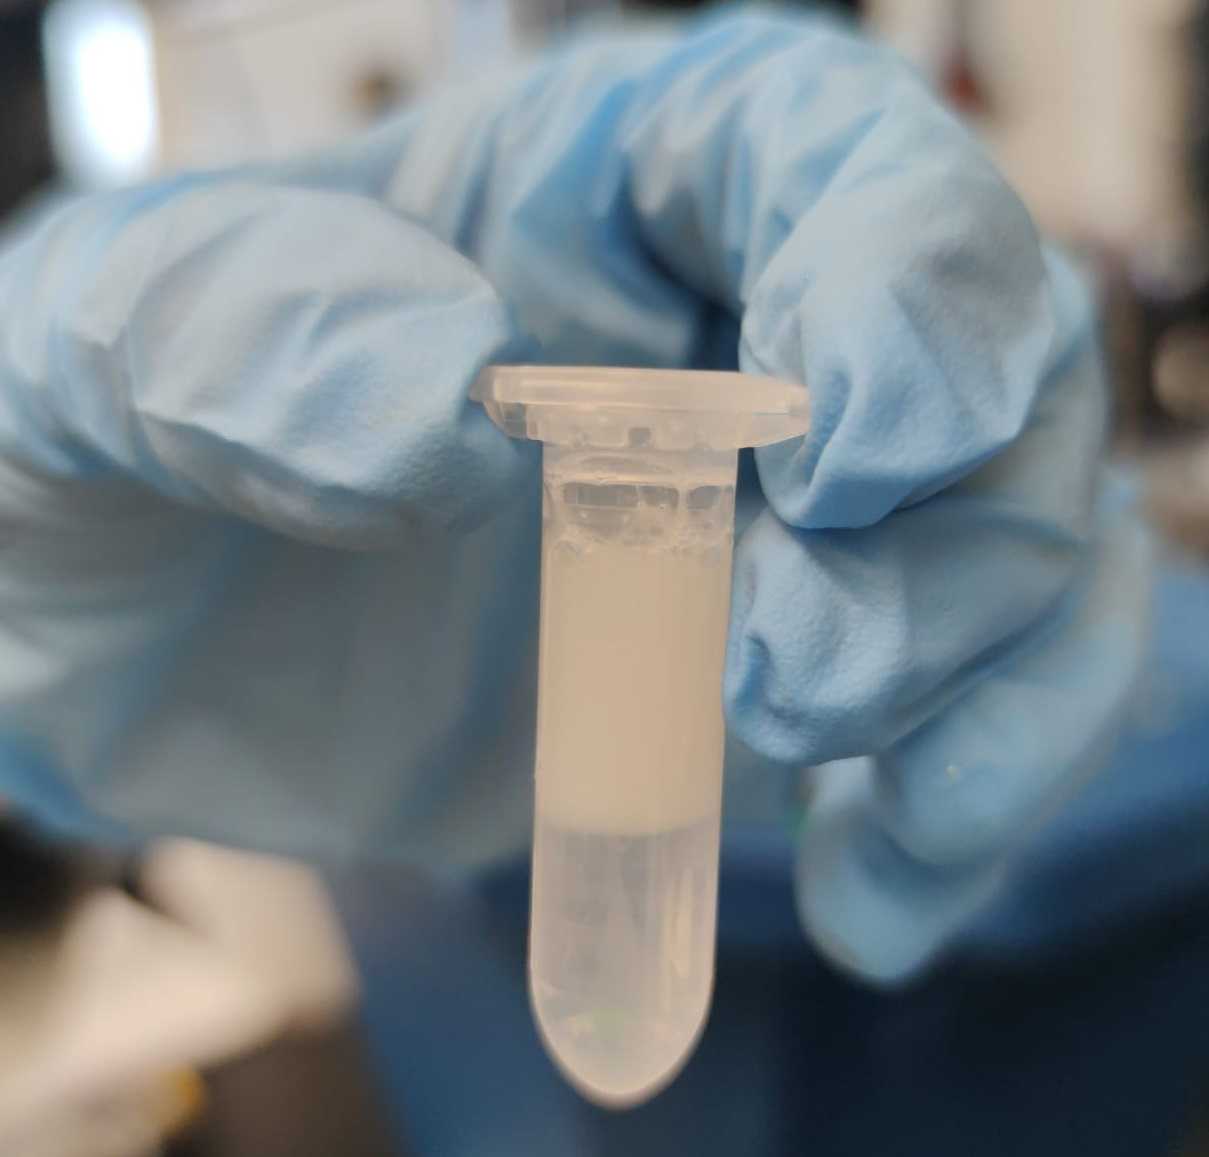
Place samples (opposite from one another) in the 4oC pre-chilled centrifuge and spin them at 13500 rcf at 4oC for 20 minutes . 13500rcf,4°C
After centrifugation, remove and discard the myelin-rich debris layer on the top (see Figure 2 ). Then, remove and discard the aqueous supernatant, without disrupting the nuclei pellet On ice .
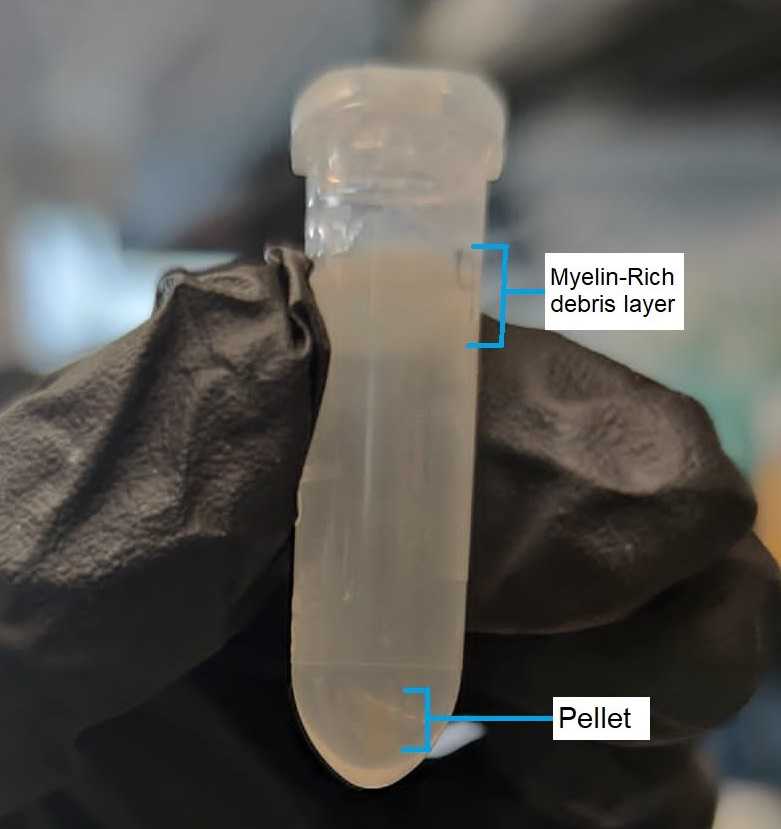
If planning on performing FANS the same day as nuclei isolation, then continue directly onto Part B (Immunostaining). If not, resuspend the pellet in 1mL of 10% DMSO in ice cold 1x PBS (RNAse-free) On ice , place it in a cryovial, and then in a Mr. Frosty overnight within a -80°C until further analysis.
Part B. Nuclei Immunostaining [~4-5 hours]
A day prior to performing immunostaining, prepare your BSA-coated tubes On ice . Add 1mL of 10% BSA solution in ice cold 1x PBS (RNAse-free) to autoclaved 1.5mL Eppendorf tubes (one for each planned nuclei sample). Incubate them for 10 minutes On ice. Rinse them with ice cold 1x PBS (RNAse-free) and let them dry at 4°C ( open lid ).
Fast temp your centrifuge to 4oC. ,4°C,0h 0m 0s
If performing nuclei isolation the same day as immunostaining and FANS, then you may skip steps 24-29. If you have frozen your nuclei sample at -80°C, you must perform these steps before moving on to step 30. Thaw cryovial with nuclei sample completely On ice. Once completely thawed, gently pipette the sample up and down.
Transfer the sample to an ice cold (pre-chilled) 1.5mL LoBind Eppendorf tube On ice .
Rinse out cryovial with 150uL of ice cold 1x PBS (RNAse-free) and transfer that liquid into your LoBind tube On ice , as well.
Centrifuge sample at 2050 rcf for 15 minutes at 4oC.2050rcf,4°C
Discard supernatant On ice , being careful not to touch and disturb the pellet.
Gently resuspend pellet in 1mL of ice cold 1x PBS (RNAse-free) solution On ice .
Add 500 uL of ice-cold Antibody Incubation Buffer solution to each pellet (in 2 ml tubes from Optiprep protocol - from step 21 of protocol part A , if you skipped steps 24-29) and let it sit on ice for 20 minutes On ice. This allows for the pellet to dissolve a little on its own, making it easier to later mechanically dissolve it by pipetting up and down, which lessens the amount of stress the nuclei experience.
After the nuclei have been incubated on ice for 20 minutes, mechanically (and gently) pipette the solution up and down to completely dissolve them in the buffer On ice .
Remove the nuclei-containing solution from the LoBind tube and transfer it to a 1.5 mL Eppendorf tube (pre-coated with BSA the day before) On ice . Place the sample On ice. Use 500uL of ice-cold 1X PBS to rinse out each tube and place that liquid into your corresponding pre-coated BSA tube, as well (final volume of nuclei solution will be 1mL) On ice . Check and count the nuclei with a hemocytometer by adding 10uL of sample into a new 1.5mL Eppendorf tube and mixing it with 10uL of Trypan Blue (see Figures 4 and 5 ).
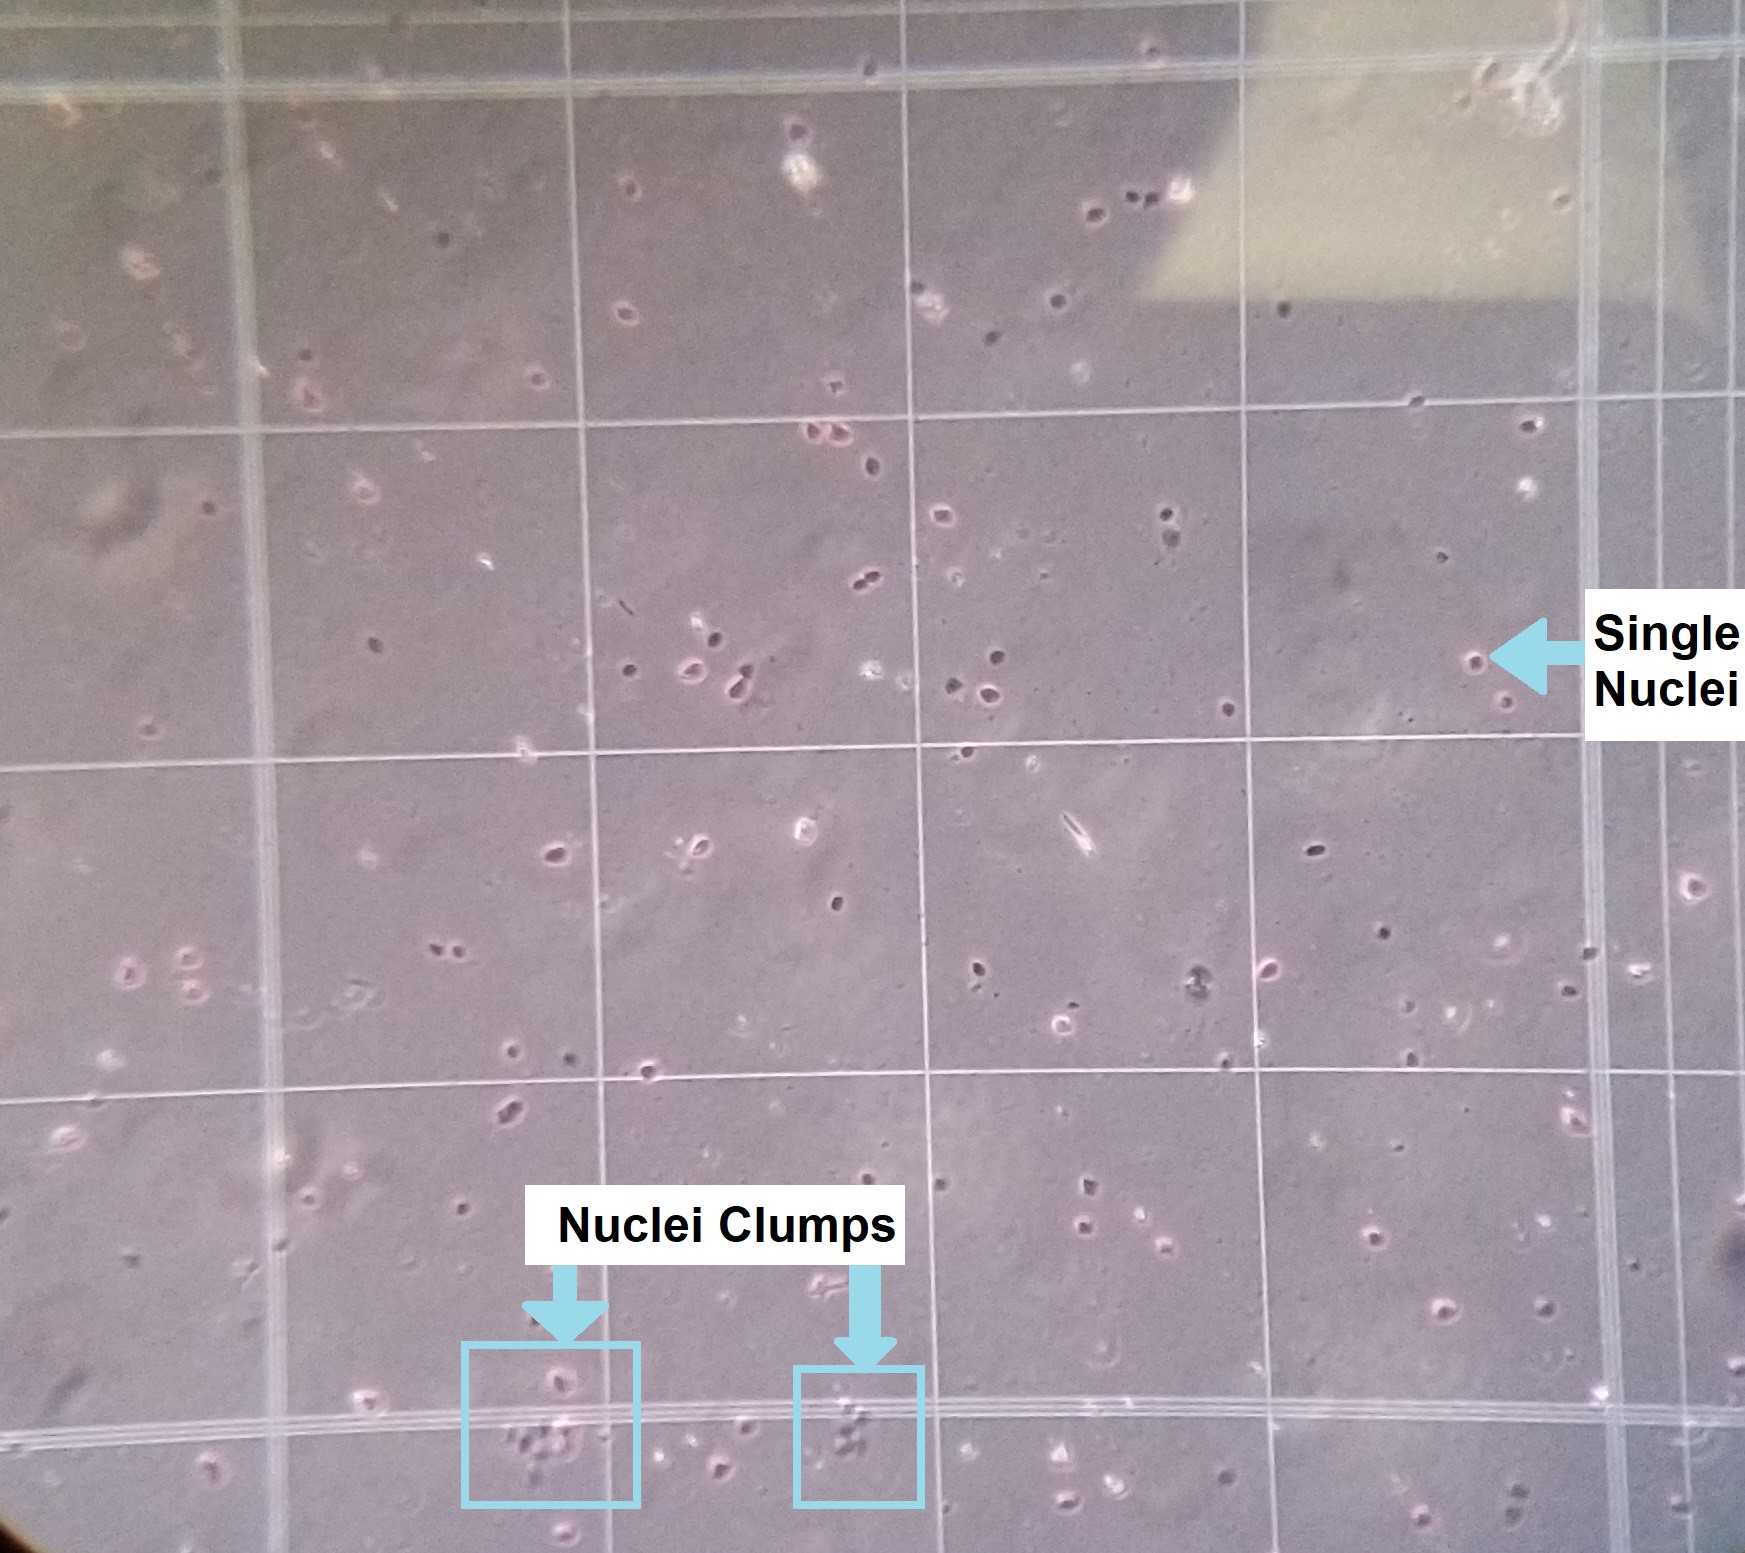
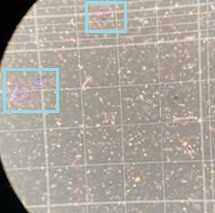
Prepare the NeuN immunostaining mixture in an 1.5 mL LoBind Eppendorf tube On ice (enough for 1 sample - adjust volume for more samples): 300 uL of 1X RNase-free PBS, 1.2 uL of NeuN antibody (Anti-NeuN Antibody, clone A60, Alexa Fluor®488 conjugated), and 100 uL of Blocking Mix (0.5% BSA and 10% Normal Goat Serum).
Vortex the immunostaining mixture for at least 10 seconds and incubate it at Room temperature (using aluminum foil).
Prepare 1.5 mL LoBind Eppendorf tubes with the samples On ice (final volumes will be 1 mL), labeled as following (3 for each sample):
Unstained Control: pipette 70 uL of the nuclei-containing solution (from step 32) into 830 uL 1X PBS (RNAse-free).
Hoechst Control: pipette 70 uL of the nuclei-containing solution into 830 uL 1X PBS (RNAse-free).
Nuclei Sample: pipette 860 uL of nuclei-containing solution (what was left of it) into 140 uL 1X PBS (RNAse-free).
Add the immunostaining mixture (from step 34) to the Nuclei Sample tube.
Add 2uL of Hoechst 33342 (20mM) to the Hoechst control and Nuclei Sample tubes (do not not add it to the Unstained Control ).
Take the samples to the cold room (4°C ) and rotate them in the dark (rotisserie rotator) for 1.5 to 2 hours (cover tubes/rotator with foil to protect them from light).4°C 2h 0m 0s
After the samples have incubated in the dark for 1.5 to 2 hours, place them On ice and centrifuge tubes at 2050 rcf for 5 minutes at 4ºC 2050rcf,4°C and discard supernatant (by pipetting off) On ice .
Gently pipette sample up and down using a P1000 pipette within the sample tube On ice. Then, use P1000 Pipetman to transfer the sample through a 5mL polystyrene round-bottom with cell-strainer cap filtration (blue cap tube) tube while On ice. Once the sample has been filtered, transfer the sample to a new 5mL sample tube made of polypropylene that is covered in aluminum foil (to protect the sample from light) and that is kept On ice``rpm .
Lightly vortex sample tubes at lowest vortex setting for 10 to 30 seconds to make the mixture homogeneous (not clumped) right before loading the 5mL polypropylene round-bottom tube into the FACS chamber. Make sure that aluminum foil covers the sample tube while vortexing.
Part C. Fluorescence-Activated Nuclei Sorting, FANS
For machine start-up, CST and Accudrop calibrations, refer to BD-FACSJazz-Software-UserGuide.pdf for guidance and troubleshooting of the BD FACSJazzTM machine, specifically. The following instructions describe FANS using BD FACSJazzTM. Other cell sorting platforms can be used but might require modification to this protocol.
A day prior to performing FANS, prepare your coated collection tubes On ice . Add 500uL of ice cold 1x PBS (RNAse-free) solution, 25uL of RNAse Inhibitor (40U/uL), and 500uL of 10% BSA solution to your autoclaved and prechilled 1.5mL LoBind Eppendorf tubes that you will be using to collect your sorted nuclei samples (you should create at least 2 tubes for each sample: one for NeuN+ nuclei and one for NeuN- nuclei. It is recommended to make at least 4 tubes for each sample to better prevent potential overflow of sorted nuclei). Close lids and gently invert tubes a few times. Incubate tubes On ice. Rinse each tube with 1mL ice cold 1x PBS (RNAse-free) and let it dry at 4°C ( open lid ).
Make sure that at least one day prior to performing, you have at least6L that has been both filtered and autoclaved and is at Room temperature (around 23oC).
When switching on and setting up the BD FACSJazzTMmachine, make sure to also turn on your cooling system. Set it to 5°C and hit the play button to allow the system to begin to cool down.
Part C1. Performing Gating of Samples and Sorting of Nuclei
Change all of the PMTs, FSC, and SSC to a log -scale by clicking the “log” checkboxes next to the PMT threshold adjustments and change the key threshold to FSC and around 1.65. ( Note : FSC and SSC do NOT always have to be switched to log -scale. If easy visualization and gating can be done without switching FSC and SSC to log-scale, then this can also be done). Additionally, set the Sample Offset (in the Pressure Console) so that you get an Events per Second of around 200 when working with ALL of your samples (see Figure 6 ).
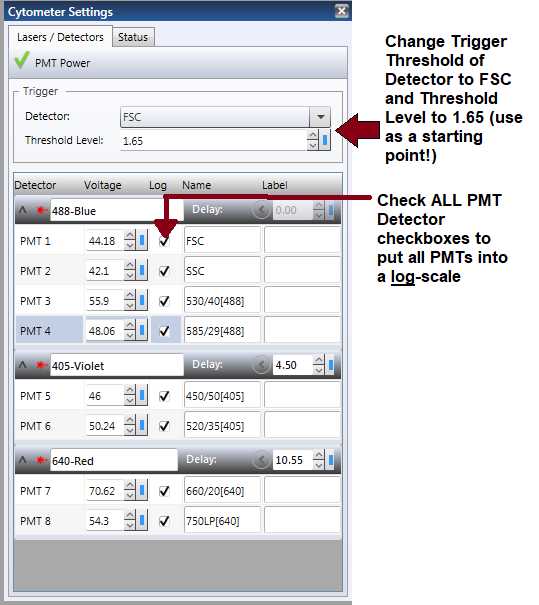
First, start with sample #1 (the Unstained Control sample). Remove any tube from the sample tube area within the machine and click Backflush . Wait about 30 seconds and then click Backflush again to turn off the backflushing. Lightly vortex your already filtered sample with the vortexer (setting at 1 ) for about 10 seconds. Bring the sample back to the flow cytometer, place it in the sample tube area, and lock it in place. Press the Sample button for the sample to start being inputted into the flow cytometer’s system. Adjust your Default Display Count on the computer to around 1,000 and your Event Limit to around 2,000 (These can be found within the leftmost panel on your screen). Press the Boost button to get the sample flowing quicker into the system until you start seeing your Events Per Second change, as well as data starting to show up on your dot plots. Adjust your Sample Offset (and, if necessary, your PMT thresholds) until you get a consistent flow of about 200 events per second.
This is the sample that you will most likely use for “cells” gating and gating out doublets: you will use an SSC vs. FSC plot to gate out debris (“Cells” gating plot) and a Trigger Pulse Width vs. FSC plot to gate out doublets (“Singlets” gating plot). ( Note : Sometimes, the plots do not look consistently similar to what is normal or as good as they should for gating these two things ( Figure 7 ). If this is the case and you are really having trouble discerning these things, you can move on and use sample #2 (the Hoechst Control sample) to give you a better idea and, in the worst case, to use for gating these 2 things).
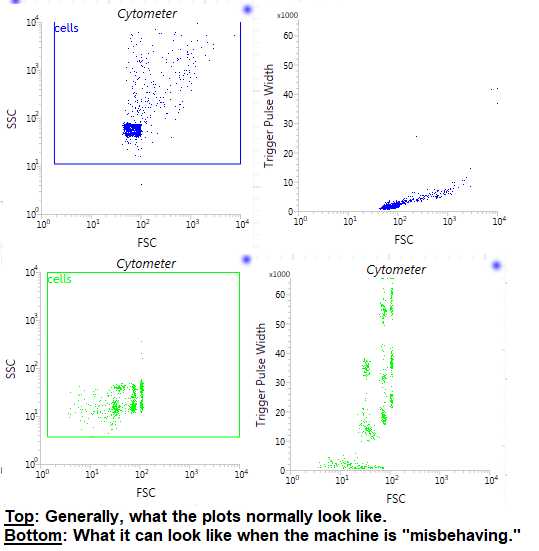
For the “Cells” gating, make a plot with SSC on the y-axis and FSC on the x-axis. Now, using one of the gating tools in the upper toolbar ( Figure 8 ), click and drag to create a square gate in this plot and name it “Cells.” Generally, the debris is usually found in the lower left-hand corner of the plot. Sometimes, you are able to see 2 different populations (one that is the debris and one that is the “cells”), but this is not always the case. Use your judgment to make this gate. We have now, theoretically, gated out any debris for our sorting sample.

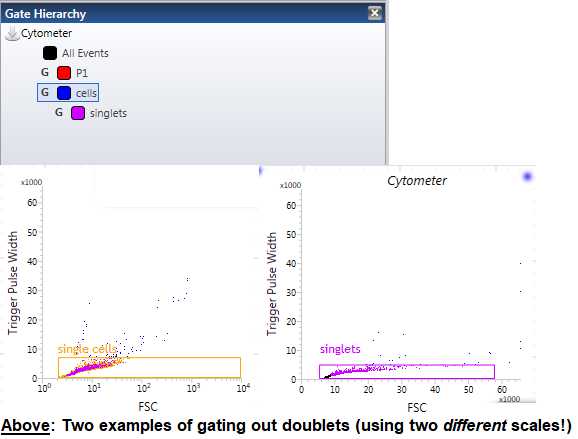
For the “Singlets” gating, make a plot with Trigger Pulse Width on the y-axis and FSC on the x-axis. ( Note : This plot is usually already made for you as the 3rd plot on your workspace). For this plot, we are trying to gate out the doublets (the clumped “cells” or aggregates). These typically appear a bit “bigger” than normal singlets and, therefore, have a greater Trigger Pulse Width. Using the same gating tool as above, click and drag to create a square gate in this plot and name it “Singlets.” Use your judgment to make this gate. ( Tip : Do not worry if you are not entirely sure, we recommend doing a “double check” plot with the Hoechst Control sample to make sure that your “Singlets” gate is working somewhat properly). We have now, theoretically, gated out any doublets and larger aggregates from our sorting sample. Make sure that your “Singlet” gate is nestled under your “Cells” gate by placing it within that “Cells” gate order ( Figure 9 ).
Now, remove sample #1 (the Unstained Control sample) from the sample tube area and click Backflush to clear out the system of the sample. Wait 30 seconds before clicking Backflush again. We will now move onto sample #2 (the Hoechst Control sample). Remove any tube from the sample tube area within the machine and click Backflush . Wait about 30 seconds and then click Backflush again to turn off the backflushing.
Lightly vortex your already filtered Hoechst Control sample with the vortexer (setting at 1 ) for about 10 seconds ( Make sure that it is concealed with aluminum foil when you do this, as it has fluorescent dye in it ). Bring the sample back to the flow cytometer, remove the aluminum foil, place it in the sample tube area, and lock it in place. Place some aluminum foil, as best you can, around the sample tube area to keep out any light . Press the Sample button for the sample to start being inputted into the flow cytometer’s system. Adjust your Default Display Count on the computer to around 10,000 and your Event Limit to around 2,000 (these can be found within the leftmost panel on your screen). Press the Boost button to get the sample flowing quicker into the system until you start seeing your Events Per Second change, as well as data starting to show up on your dot plots. Adjust your Sample Offset (and, if necessary, your PMT thresholds) until you get a consistent flow of about 200 events per second.
This is the sample that you will use for identifying your “nuclei” gating and to also perform a “double check” of whether we have correctly identified “single nuclei” within our gating process. We will use a 520/35[405] vs. 450/50[405] plot to identify and gate nuclei (this is generally called the “Nuclei” gating plot). We will also use a 450/50[405] vs. FSC plot to perform a “double check” to see if our gating correctly identifies single nuclei.
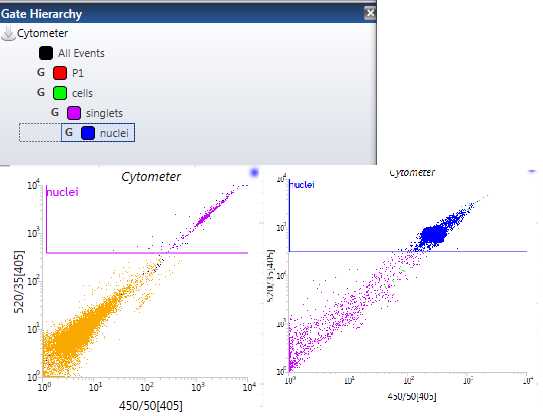
For the “Nuclei” gating, make a plot with 520/35[405] on the y-axis and 450/50[405] on the x-axis. Now, using one of the gating tools in the upper toolbar, click and drag to create a square gate in this plot and name it “Nuclei.” The nuclei should have a high fluorescence at this wavelength, so they are typically found in the upper right-hand corner of the plot. Usually, you will actually see a distinct separate population here in that upper right quadrant. Those are your nuclei. Use your judgment to make this gate. We have now, theoretically, identified and gated our nuclei for our sorting sample. Sometimes, the populations can look a bit different ( Figure 10 ). Make sure that your “Nuclei” gate is nestled under your “Singlets” gate by placing it within that “Singlets” AND “Cells” gates order ( Figure 10 ).
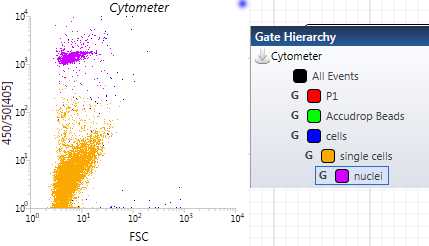
For the single nuclei “double check” plot, make a plot with 450/50[405] on the y-axis and FSC on the x-axis. Use this plot to observe the different populations. You should see at least 2 distinct populations start to populate this plot. The dots that are clustered high on the y-axis and also somewhat low on the x-axis are our single nuclei. If we have gated both our “Singlets” and our “Nuclei” gates properly, this distinct clustered population should be the same color as the nuclei gate that we made. If this is the case, then we have, theoretically, successfully gated Single Nuclei ( Figure 11 ).
Now, remove sample #2 (the Hoechst Control sample) from the sample tube area and click Backflush to clear out the system of the sample. Wait 30 seconds before clicking Backflush again. We will now move onto sample #3 (the Nuclei Sample sample). Remove any tube from the sample tube area within the machine and click Backflush . Wait about 30 seconds and then click Backflush again to turn off the backflushing.
Lightly vortex your already filtered Nuclei Sample with the vortexer (setting at 1 ) for about 10 seconds ( Make sure that it is concealed with aluminum foil when you do this, as it has fluorescent dye in it ). Bring the sample back to the flow cytometer, remove the aluminum foil, place it in the sample tube area, and lock it in place. Place some aluminum foil, as best you can, around the sample tube area to keep out any light . Press the Sample button for the sample to start being inputted into the flow cytometer’s system. Adjust your Default Display Count on the computer to around 10,000 and your Event Limit to around 2,000 (These can be found within the leftmost panel on your screen). Press the Boost button to get the sample flowing quicker into the system until you start seeing your Events Per Second change, as well as data starting to show up on your dot plots. Adjust your Sample Offset (and, if necessary, your PMT thresholds) until you get a consistent flow of about 200 events per second.
This is the sample that you will use for identifying and gating for your “NeuN positive nuclei” and your “NeuN negative nuclei.” We will use a 530/40[488] vs. 450/50[405] plot to identify and gate both of these.
For the “NeuN positive” and “NeuN negative” gating, make a plot with 530/40[488] on the y-axis and 450/50[405] on the x-axis. Now, using one of the gating tools in the upper toolbar, click and drag to create 2 square gates in this plot and name them “NeuN positive” and “NeuN negative”. The NeuN positive nuclei should be found high on the y-axis and high on the x-axis, while the NeuN negative nuclei should be found low on the y-axis but exactly as high on the x-axis. Sometimes, you will actually see distinct separate populations in the right-most upper and lower quadrants. You will, usually, be able to see at least one clear distinct population that has high fluorescence on the x-axis, but sometimes it can be a bit hard to differentiate between the two populations when it comes to y-axis. Use your own judgment to make this gate. We have now, theoretically, identified and gated our NeuN positive and NeuN negative nuclei for our sorting sample and are officially able to begin sorting. Make sure that your “NeuN positive” and “NeuN negative” gates are nestled under your “Nuclei” gate by placing it within your “Nuclei,” “Singlets,” AND “Cells” gates order ( Figure 12 ).
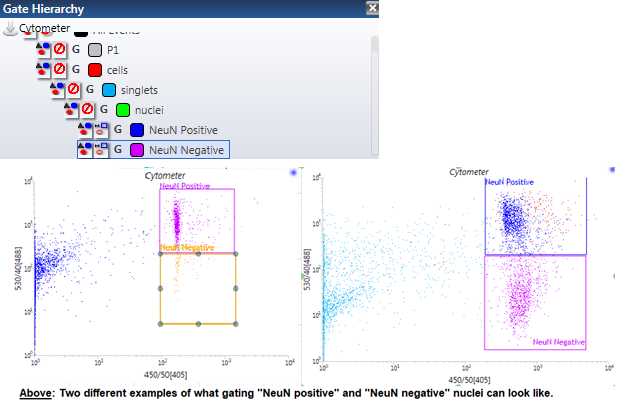
Make sure that your “Nuclei” gate is nestled under your “Singlets” gate by placing it within that “Singlets” AND “Cells” gates order ( Figure 12 ).
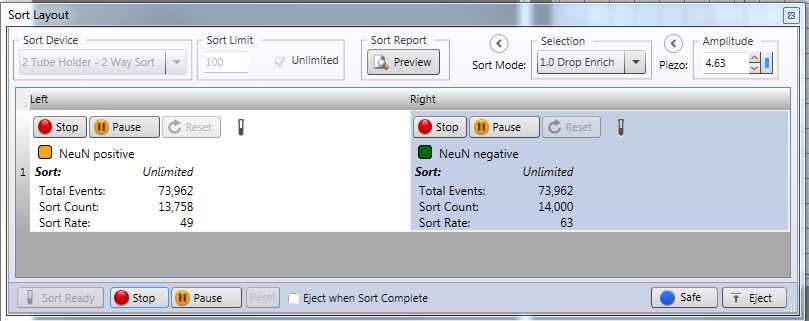
For the sorting, within the Sort Layout window, make sure that you have your Sort Mode set to 1.0 Drop Enrich . Select your “NeuN positive” gate for the left panel and your “NeuN negative” gate for your right panel ( Figure 13 ). Make sure both are set to Unlimited . Place your labeled Lo-Bind autoclaved tubes into the corresponding sort collection tube positions within the machine.
Click Sort Ready and then Start .
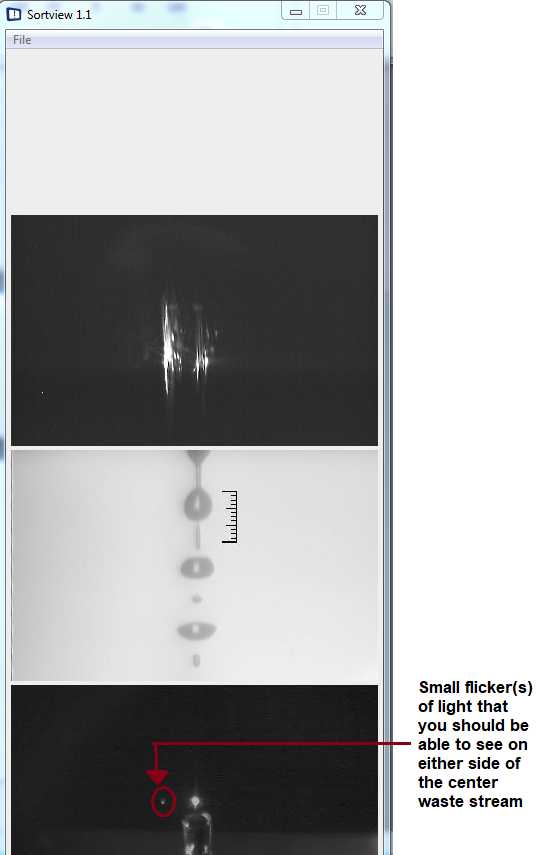
Watch the monitor and make sure to adjust your Sample Offset to keep your Event Rate to around 100-300 events per second . ( Tip : Generally, keeping the Sample Offset at around 0.15 to 0.17 psi usually works well). Make sure that you can see droplets falling into your collection tubes. You should also be able to see small flickers of light on either side of the center waste stream on the 3rd camera picture on the computer screen (this means that droplets should be being deflected into your collection tubes) ( Figure 14 ). Finally, make sure that you monitor your highest droplet breakoff point throughout the whole sorting process, in case it needs to be adjusted.
Stay by the computer until the whole sample has been successfully sorted.
Remove the now empty Nuclei Sample tube from the sample tube area of the flow cytometer and click Backflush . Wait 30 seconds before clicking Backflush again.
Remove your collection tubes and place them immediately On ice.
Turn OFF the cooling system by pressing the OFF button on the front of the monitor of the machine.
Based on the day of the week you are performing this, or whether you will be performing anymore sorting the rest of the week, choose which type of shutdown you would like to perform accordingly.
Wet Shutdown (use if you will be using the machine the next day again or anytime within the rest of the week)
Dry Shutdown (use if it is the end of the week and it will not be used on the weekend or if you will not be using the machine for 2-3+ days).
Part D. Post-FANS Handling and Storing [~45 minutes]
Pre-Chill/Fast Temp your centrifuge to 4oC.,4°C,0h 0m 0s
Visually inspect the final volume of liquid found in both the resultant NeuN+ and NeuN- nuclei sample tubes. Based on the final volume, place the corresponding amounts of solutions into each tube:
| A | B | C | D |
|---|---|---|---|
| Post-FACS Nuclei Sample Volume | 1.8M Sucrose Solution Volume | 1M CaCl2 Solution Volume | 1M Mg(Ac)2 Solution Volume |
| 500uL | 100uL | 2.5uL | 1.5uL |
| 1.0mL | 200uL | 5uL | 3uL |
| 1.5mL | 300uL | 7.5uL | 4.5uL |
Split sample(s) into 2 tubes, if needed, once solution is mixed together ( GENTLY !) with sample On ice .
Mix gently by inverting the sample tube several times.
Incubate On ice.
Centrifuge your samples at 3000 rpm for 15 minutes at 4oC.3000rpm,4°C
Gently and carefully discard supernatant without disturbing the pellet in the tube (if any) On ice (see Figure 15 ).
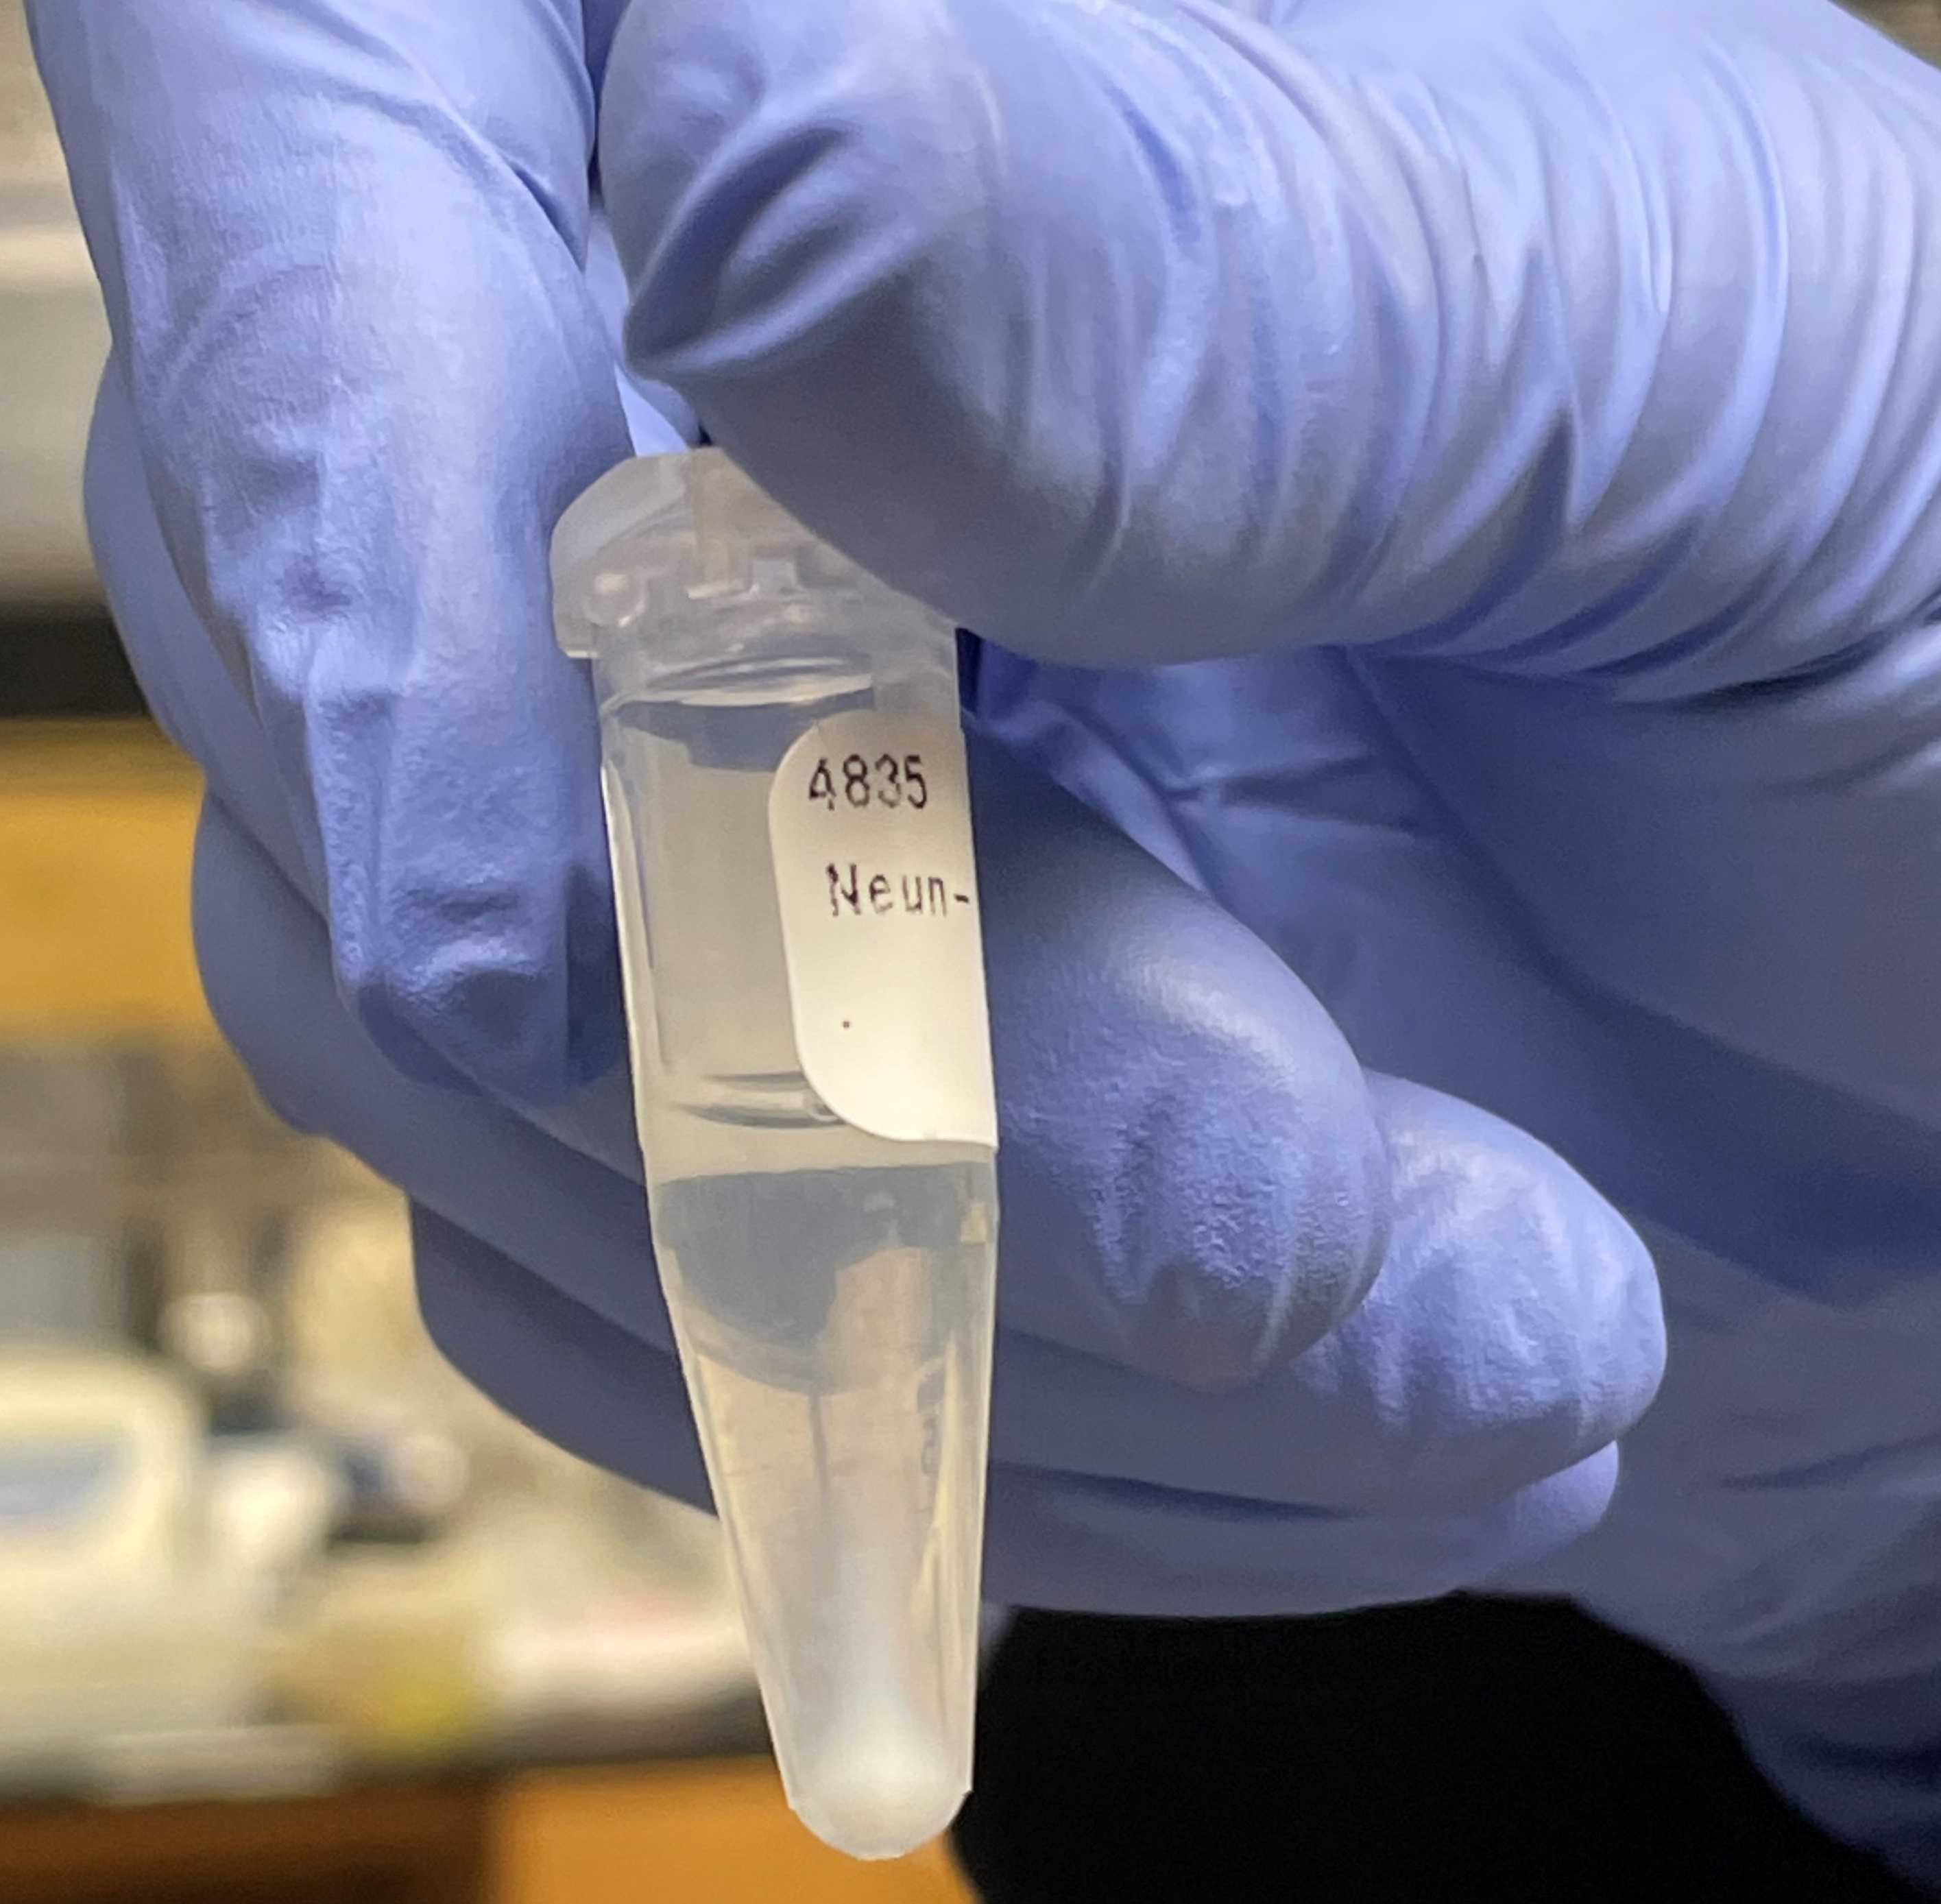
At this point, you can either freeze the pellet samples at -80°C for further processing using a Qiagen AllPrep DNA/RNA Micro Kit for simultaneous DNA and RNA extraction (using the Qiagen Manufacturer's Protocol Guidelines) at a later date.
If planning on performing analysis at a much later date, it is recommended to dissolve the pellets in 200µL of Bambanker freezing medium using the following steps:
Dissolve pellet in 200uL of Bambanker freezing medium by allowing pellet to dissolve On ice and then gently pipetting solution up and down gently.
Transfer solution to a cryovial On ice and place it in a Mr. Frosty at -80°C.
Store sample at -80°C for future use and analysis.
General Recommendations
Make sure to lubricate the ring around the sheath fluid tank lid with Super O-Lube to get a good seal.* Make sure Drop Frequency is set to around 38.9 to 39.2 . Try not to adjust this too much. Instead, you can adjust the height of the drops (using the silver knob on the top-right of the machine) and the Piezo Amplitude.
- Try to keep flow rate at a maximum of 1000 events per second and your efficiency at around 80+ %.
- Once your Nuclei Sample tube has finished going through the FACSJazz, it can be also very useful to hit the Backflush button and let some sheath fluid run back into the tube. This will release some nuclei that were caught in the tubing system, but did not get analyzed or sorted. You can then hit the Sample button again and analyze these nuclei that were not initially analyzed. You can do this as many times as you want, until you do not see any more nuclei being detected on the monitor. We, generally, repeat this step about 3-5 times to try to get as many nuclei as possible, while also not allowing this to take too much time and contribute to potential sample degradation.
- 1000x DAPI (1.4uL) can be used in place of Hoechst 33342 dye, if not available. Both dyes have been used and tested in this protocol. However, it can be recommended in some cases, such as when using DAPI, or cases where the spectrums of your chosen fluorescent antibodies overlap, that auto-compensation is performed before performing any gating or sorting. This can be done using this protocol by using the Unstained Control sample as your Negative Control, the Hoechst Control sample as your first single Positive Control, and either Alexa Fluor-488 mixed with UltraComp eBeads (following the bead manufacturer’s protocol) or staining part of the Unstained Control with Alexa Fluor-488 as your second single Positive Control.
- If for any reason you are not able to perform FANS the same day as your immunostaining procedure, you can dissolve your pellets from Part B, Step #19 in 200uL-1000uL of Bambanker freezing medium using the following steps:
- Dissolve pellet in 200uL-1000uL of Bambanker freezing medium by allowing pellet to dissolve for a few minutes on ice and then gently pipetting solution up and down gently.
- Transfer solution to a cryovial and place it in a Mr. Frosty overnight at -80oC.
- Store sample at -80oC for future use and analysis.
- Make sure to keep wrapped in aluminum foil as they will be photosensitive!
- In previous testing of protocols using the Qiagen AllPrep Kit, we have found it helpful to incubate both of our DNA and RNA filters in their designated elution buffers for about 3-5 minutes before performing the final centrifugation.
- For DNA, we elute in 40uL of 64oC Buffer EB, and for RNA, we elute in 14uL of RNAse-free water. We have also found it useful to perform 2 separate elutions, which can be later combined and further concentrated using a SpeedVac machine.


