Isoform-specific RNA structure determination using Nano-DMS-MaP
Anne-Sophie Gribling-Burrer, Patrick Bohn, Redmond P. Smyth
Extended
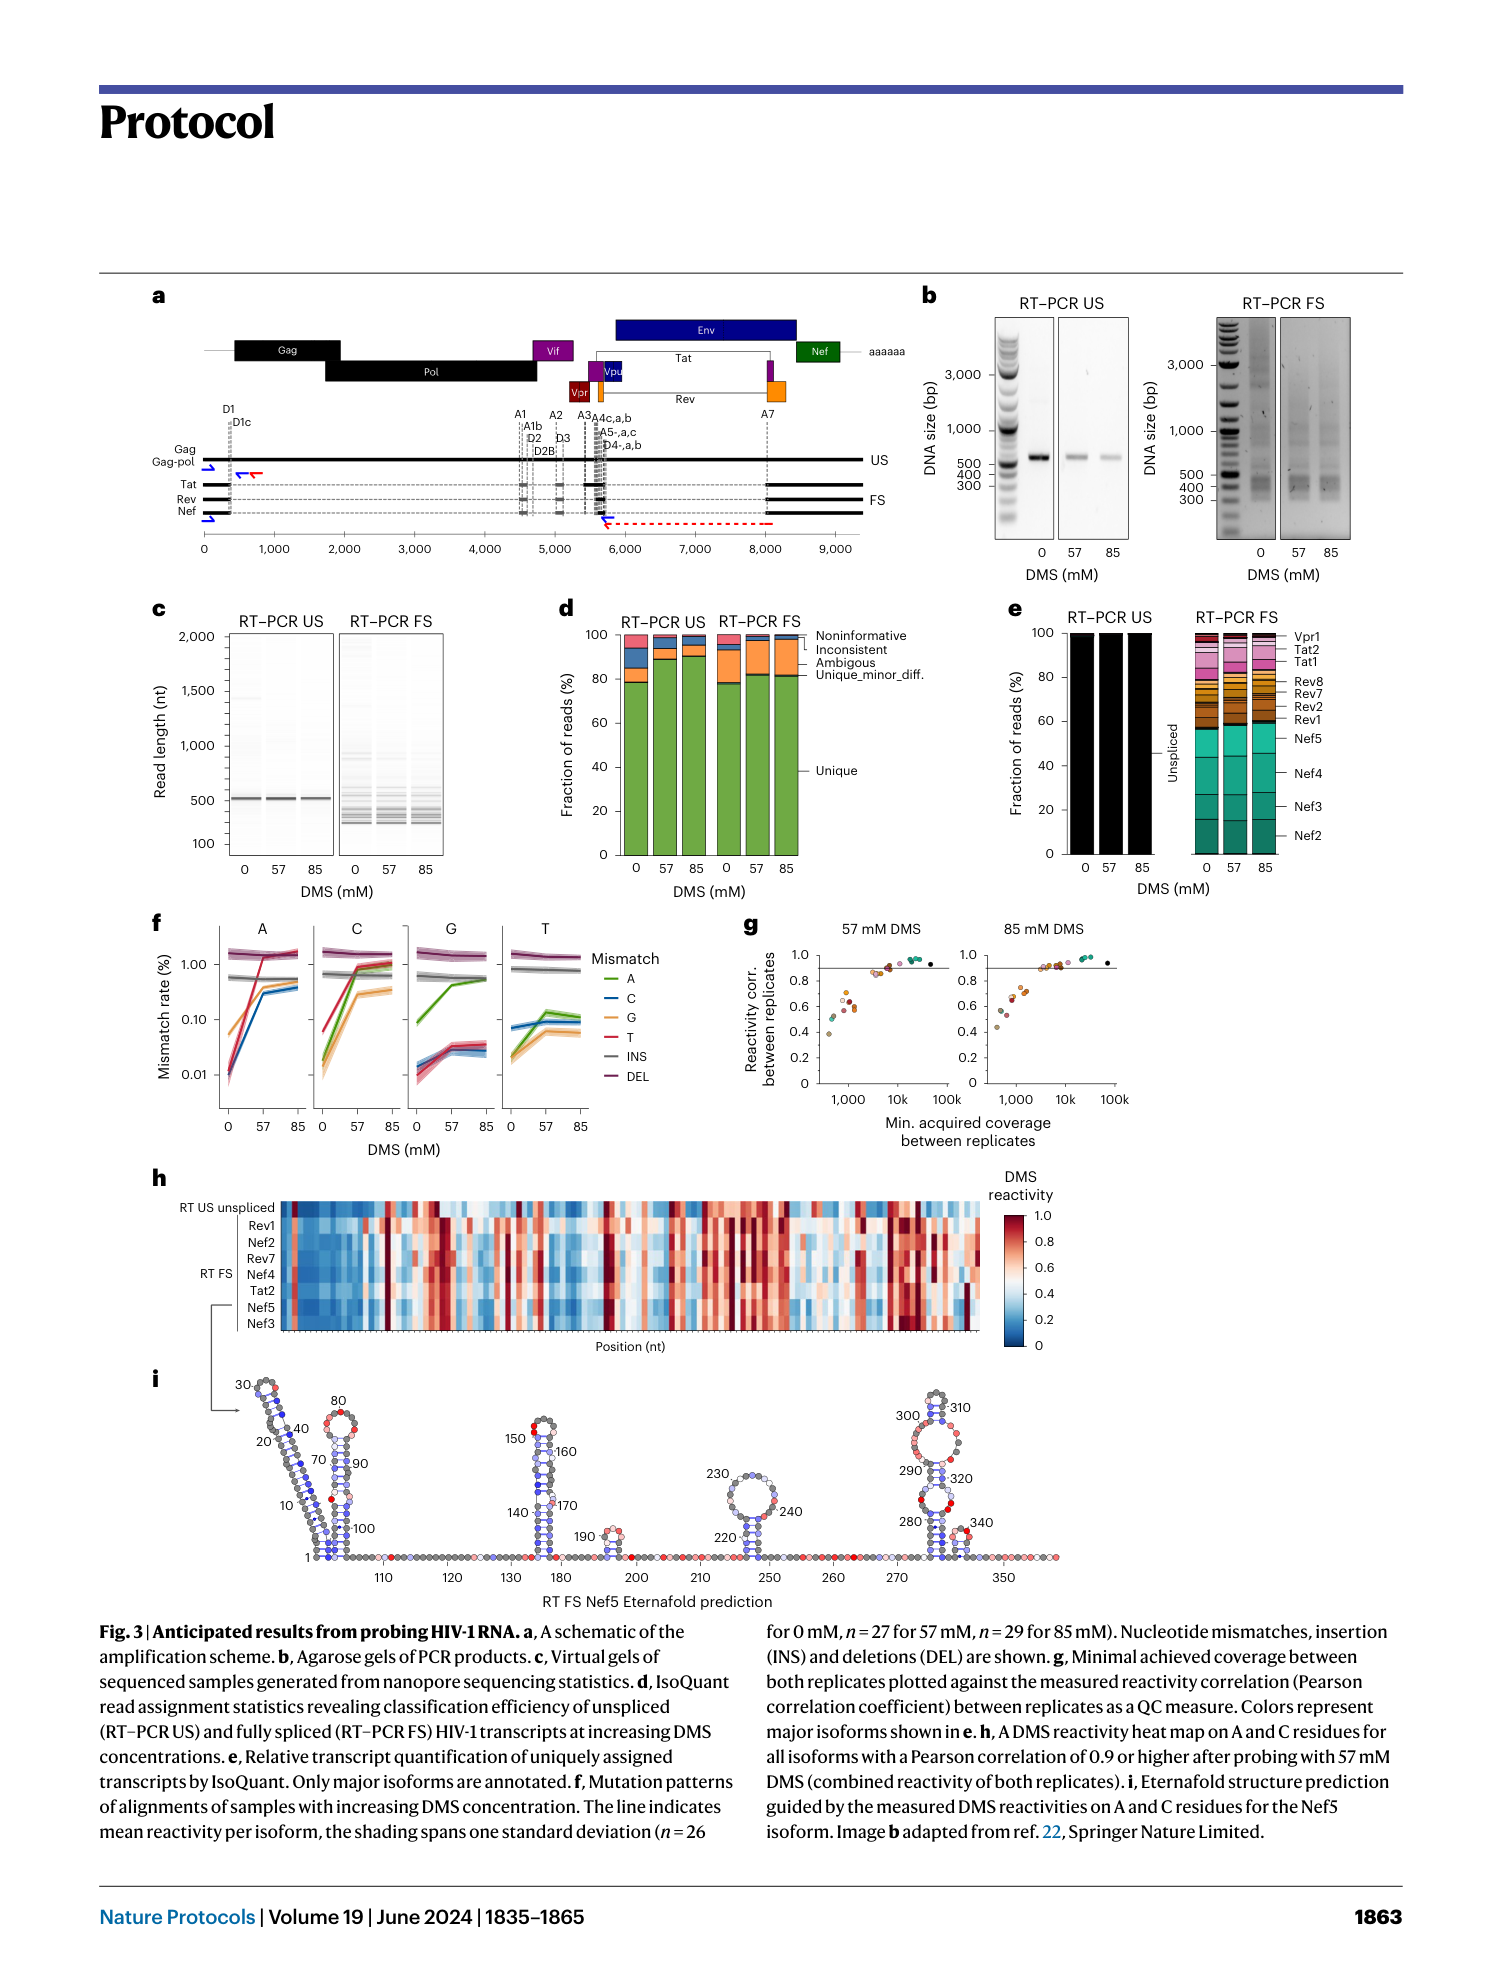
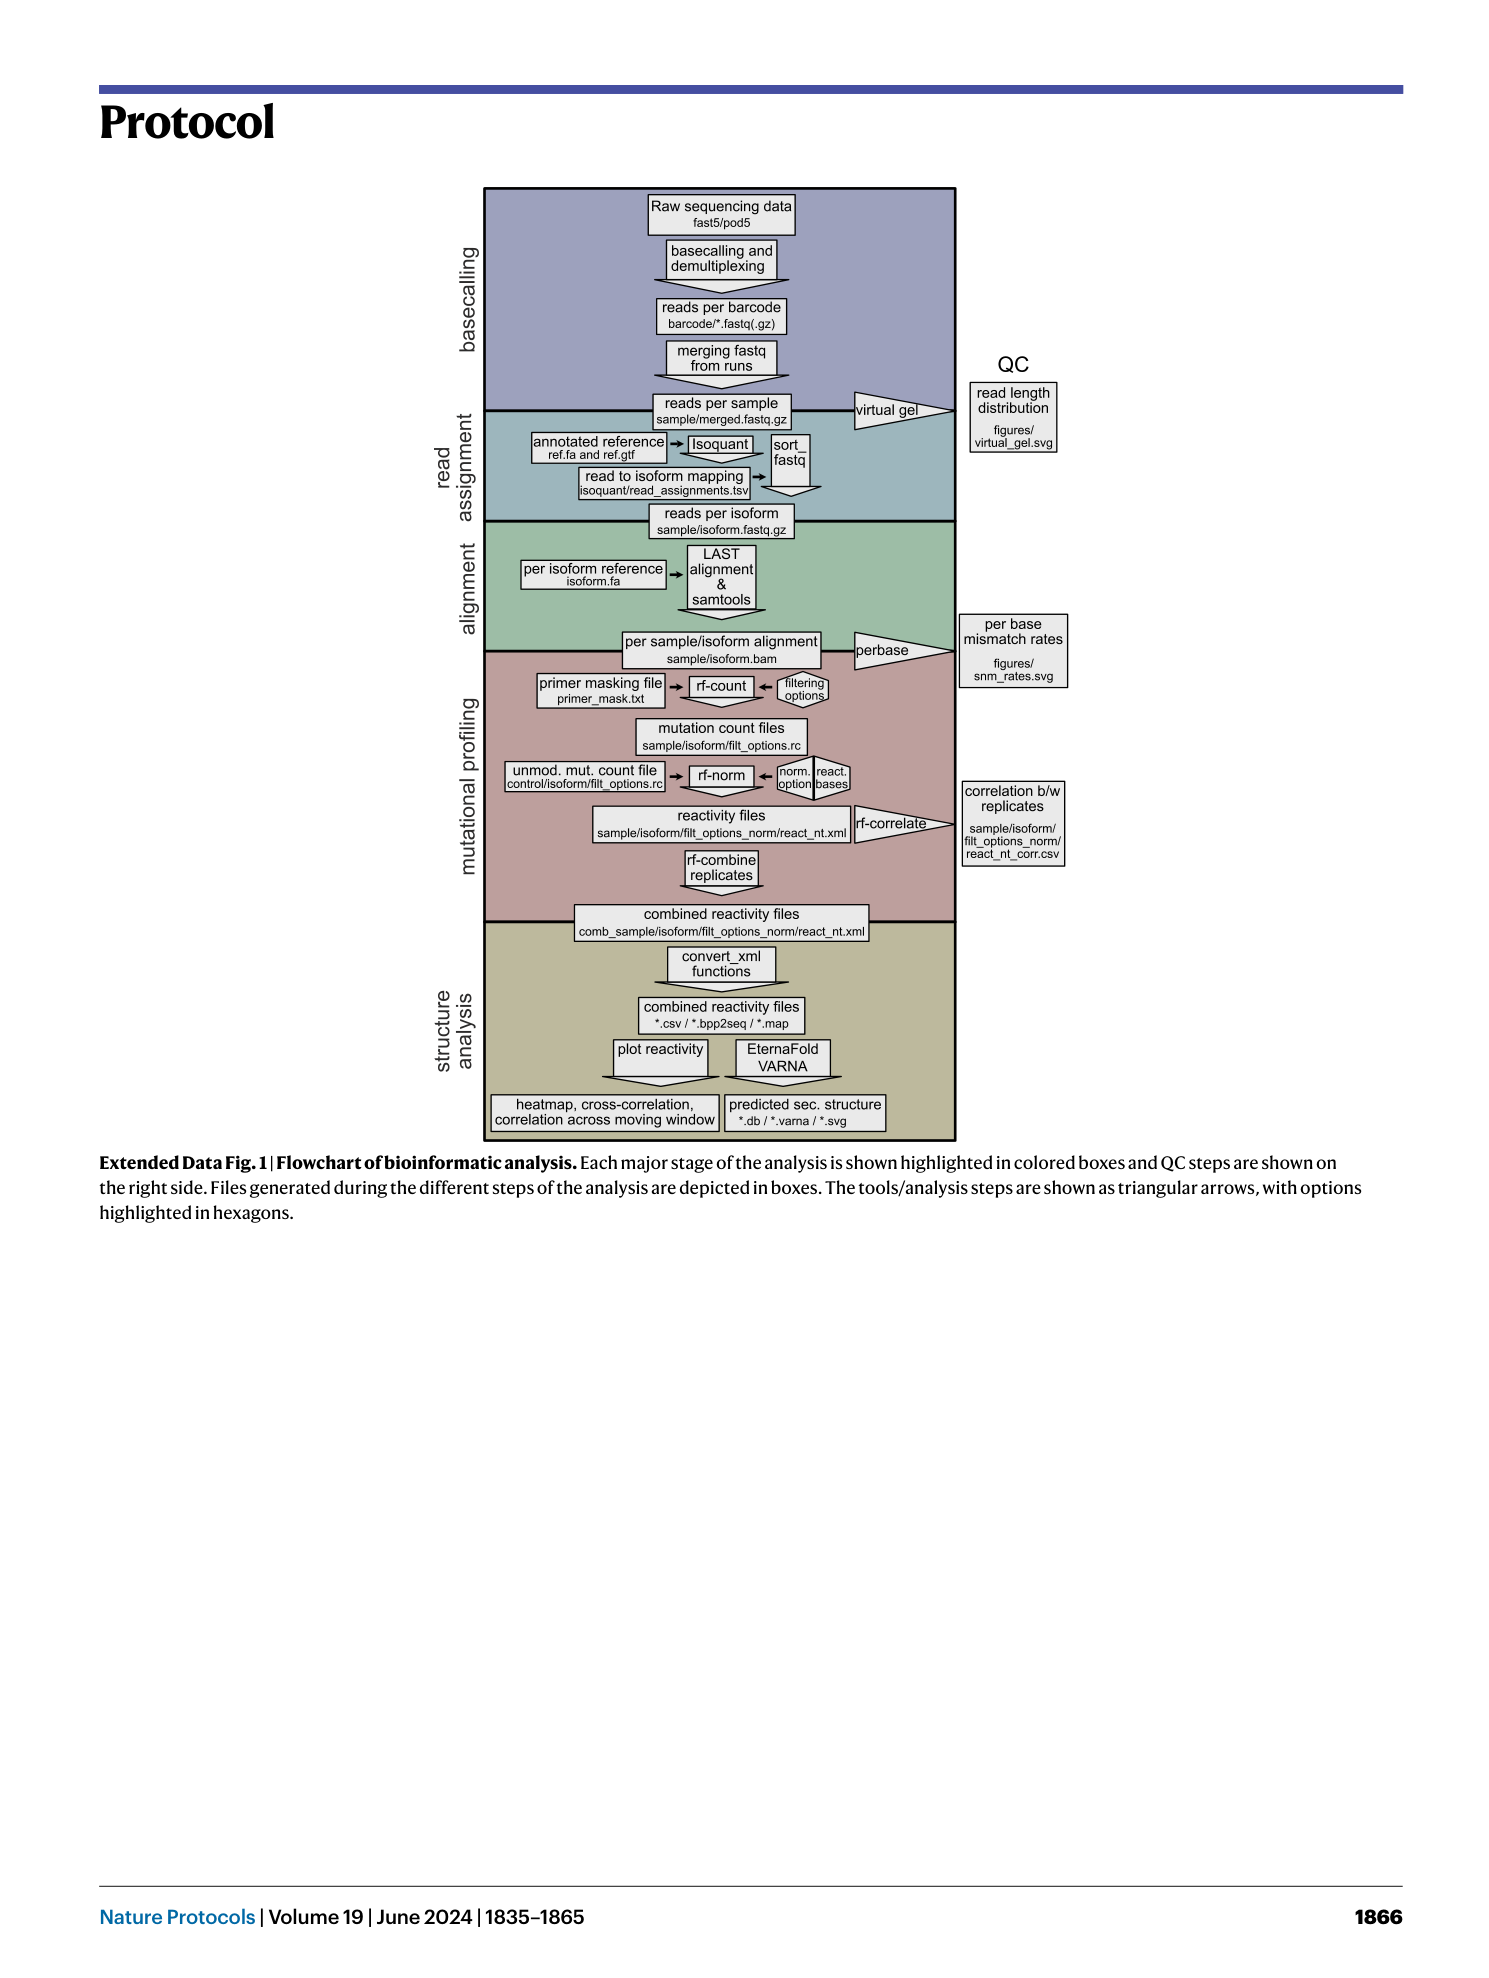
Extended Data Fig. 1 Flowchart of bioinformatic analysis.
Each major stage of the analysis is shown highlighted in colored boxes and QC steps are shown on the right side. Files generated during the different steps of the analysis are depicted in boxes. The tools/analysis steps are shown as triangular arrows, with options highlighted in hexagons.
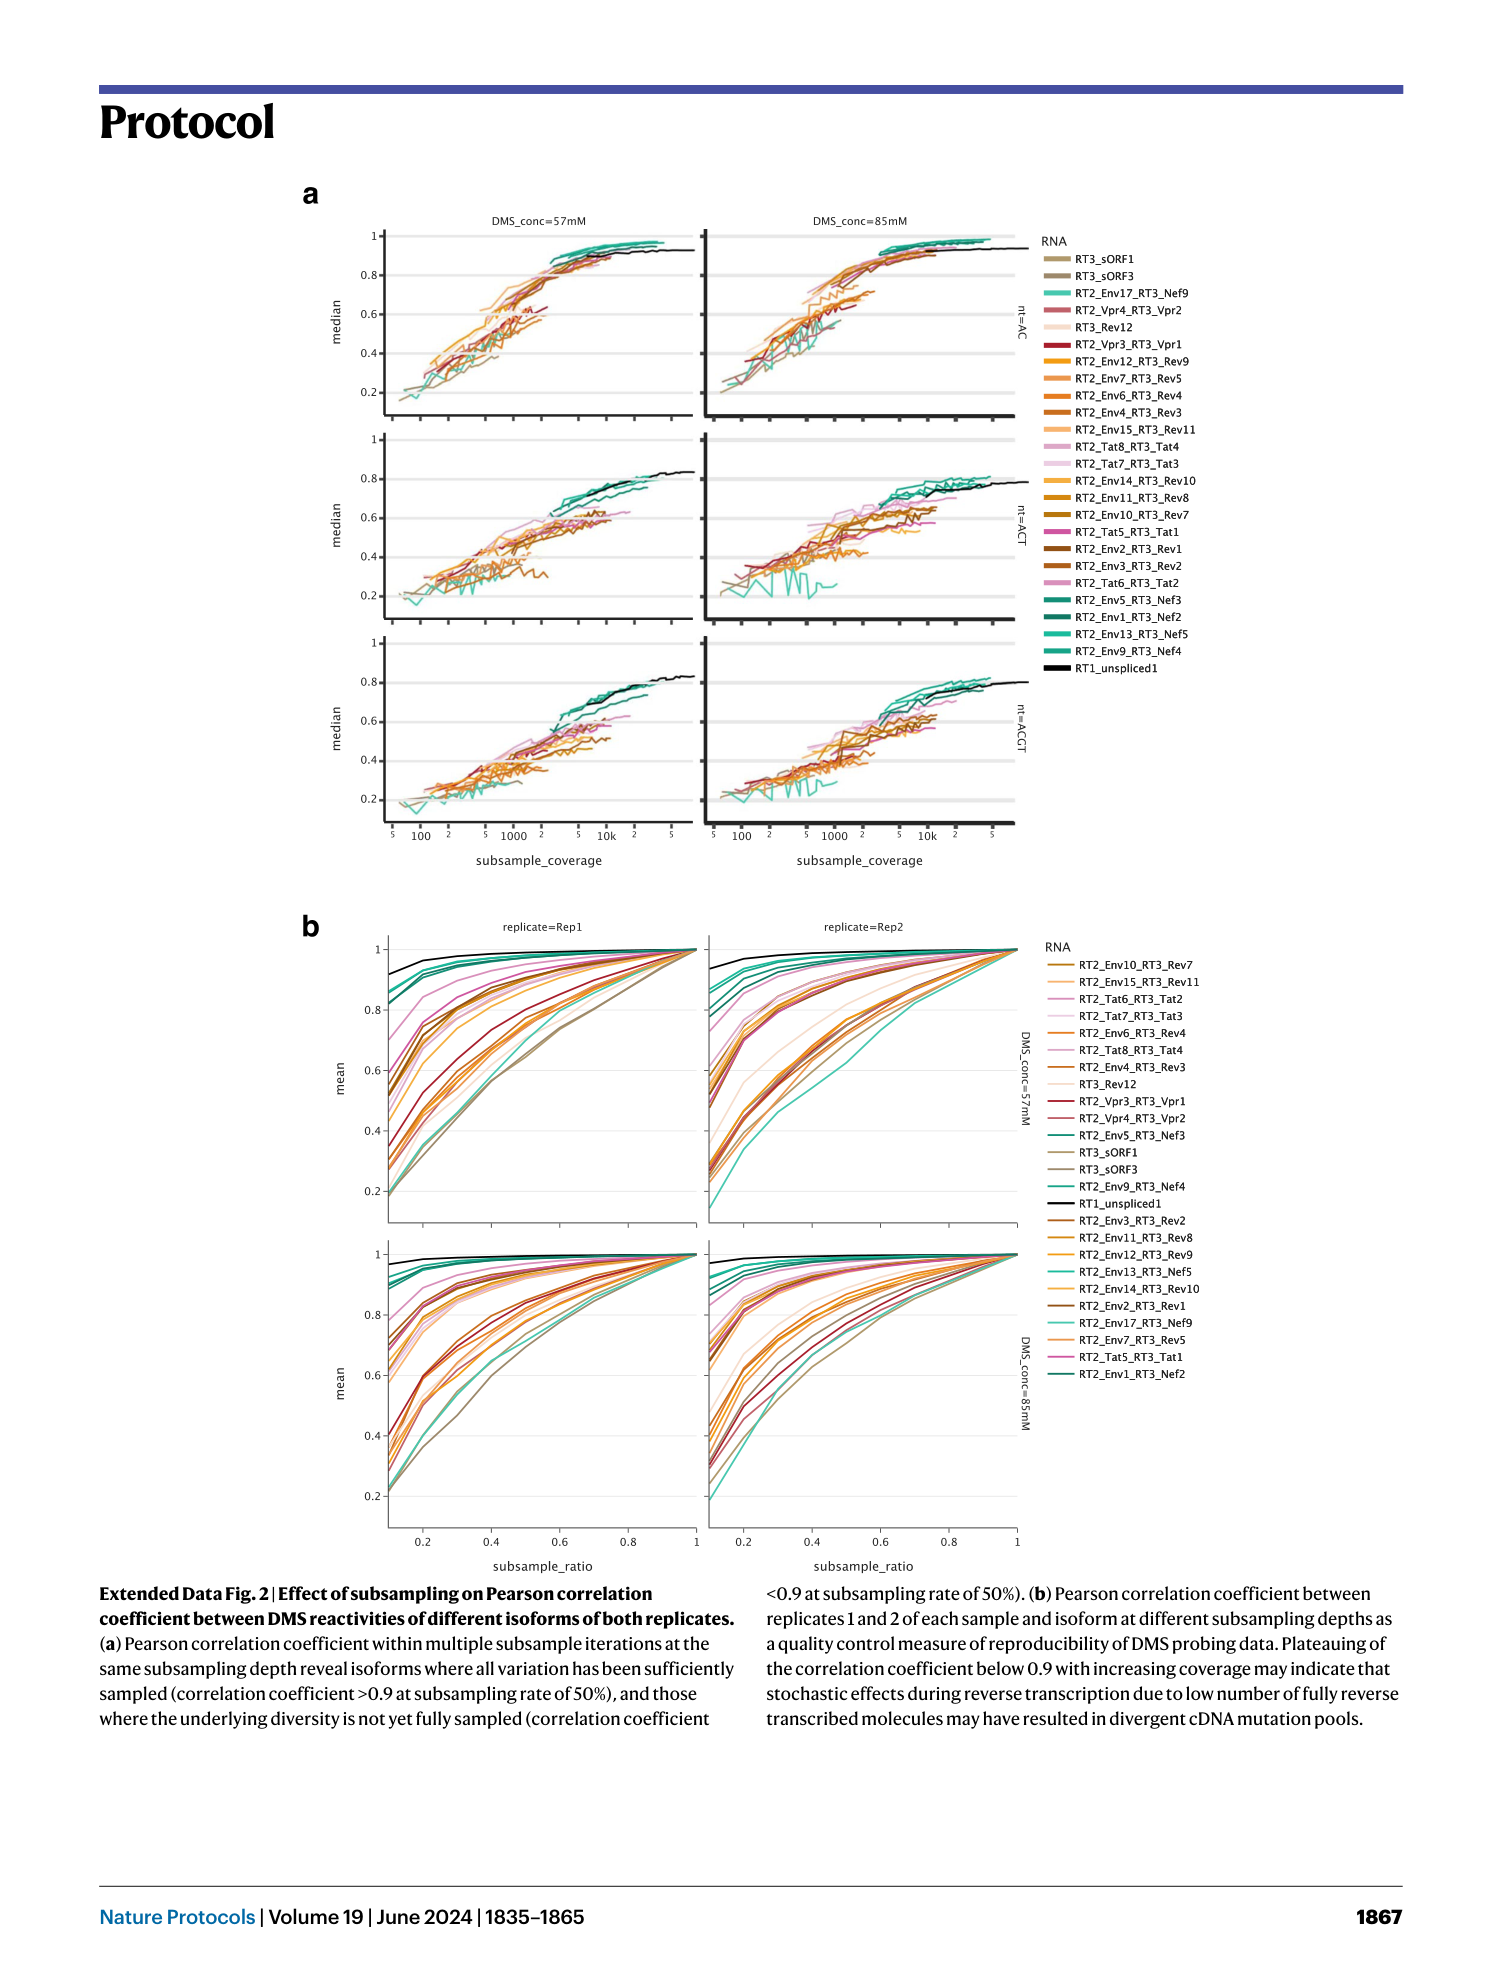
Extended Data Fig. 2 Effect of subsampling on Pearson correlation coefficient between DMS reactivities of different isoforms of both replicates.
( a ) Pearson correlation coefficient within multiple subsample iterations at the same subsampling depth reveal isoforms where all variation has been sufficiently sampled (correlation coefficient >0.9 at subsampling rate of 50%), and those where the underlying diversity is not yet fully sampled (correlation coefficient <0.9 at subsampling rate of 50%). ( b ) Pearson correlation coefficient between replicates 1 and 2 of each sample and isoform at different subsampling depths as a quality control measure of reproducibility of DMS probing data. Plateauing of the correlation coefficient below 0.9 with increasing coverage may indicate that stochastic effects during reverse transcription due to low number of fully reverse transcribed molecules may have resulted in divergent cDNA mutation pools.
