Illumination Power and illumination stability
Gabriel Krens, Nathalie Gaudreault, Steve Bagley, Rodrigo R Bammann, Fabio Barachati, Laszlo Barna, Veronika Boczonadi, Ulrike Boehm, Manel Bosch, Craig Brideau, Mariana T Carvalho, Pina Colarusso, Richard Cole, Nasser Darwish-Miranda, Sam Duwé, Frank Eismann, Orestis Faklaris, Andreas Felscher, Manfred Gonnert, David Grunwald, Marcel Kirchner, Birgit Hoffmann, Alex J Laude, Jeffrey M LeDue, Pascal Lorentz, Miso Mitkovski, Michael S Nelson, Britta Schroth-Diez, Stanley Schwartz, Sathya Srinivasan, Roland Thuenauer, Tse-Luen Wee, Kees van der Oord, Chloë van Oostende-Triplet, Roland Nitschke, Laurent Gelman
Illumination Power
Illumination stability
Laser Power
Laser stability
Laser linearity
Illumination linearity
Disclaimer
This protocol was developed by the members of QUAREP-LiMi Working Group 1. The member list can be found here: (https://quarep.org/working-groups/wg-1-illumination-power/wg-1-members/))
The QUAREP-LiMi is a group of scientists interested in improving quality assessment (QA) and quality control (QC) in light microscopy. We first came together on April, 2020 and as of February 2022 the group has grown to 395 people from 34 countries spread around the world. We have members from academia, microscopy communities, companies, organizations or institutions related to standardization, scientific publishers, and observers from funding agencies.
Abstract
To obtain accurate, reproducible, and interpretable data when conducting imaging experiments, it is critical to consider external factors affecting data acquisition at various steps of the experimental workflow. Illumination power and stability represent two critical factors, especially when comparing fluorescence intensities between images during a time-lapse experiment or experiments performed at different times or on other microscopes.

The fluorescence signal can be generated by different types of light sources. These light sources and their coupling elements (e.g., fibers) can display varying performances over time as they age, move, or as environmental conditions change.

Unfortunately, microscope users can often only set illumination power as a percentage of its maximal output and,  may therefore, not be aware of potential performance changes. It is important to recognize that a set percentage will not always yield the same illumination power in Watts at the objective over the course of an experiment, not to mention between days or systems. This means that selecting for example 10% output may lead to different experimental results over time and will not necessarily be comparable to outputs obtained from other lasers or microscopes, even those of the very same model.

If you are responsible for system maintenance, routinely measuring the illumination power, stability, and linearity over time can help you detect issues that affect the integrity of the system and thus the reproducibility of an experiment.

This protocol describes how to measure the stability and linearity of the illumination power using calibrated external power sensors. This protocol is at the moment intended for confocal systems (raster scanning and spinning disks), but will be extended later to other imaging modalities. It represents the collective experience of 60 imaging scientists. Measurements made by our working group with this protocol are available in a public database, which will be updated with further contributions from the community.
Before start
Steps
Illumination power measurement
Warm up the entire system, including the illumination source (i.e.lasers).

Select a low NA, air objective, such as a 10x objective, for this measurement. Ensure it is clean and presents no signs of damage.
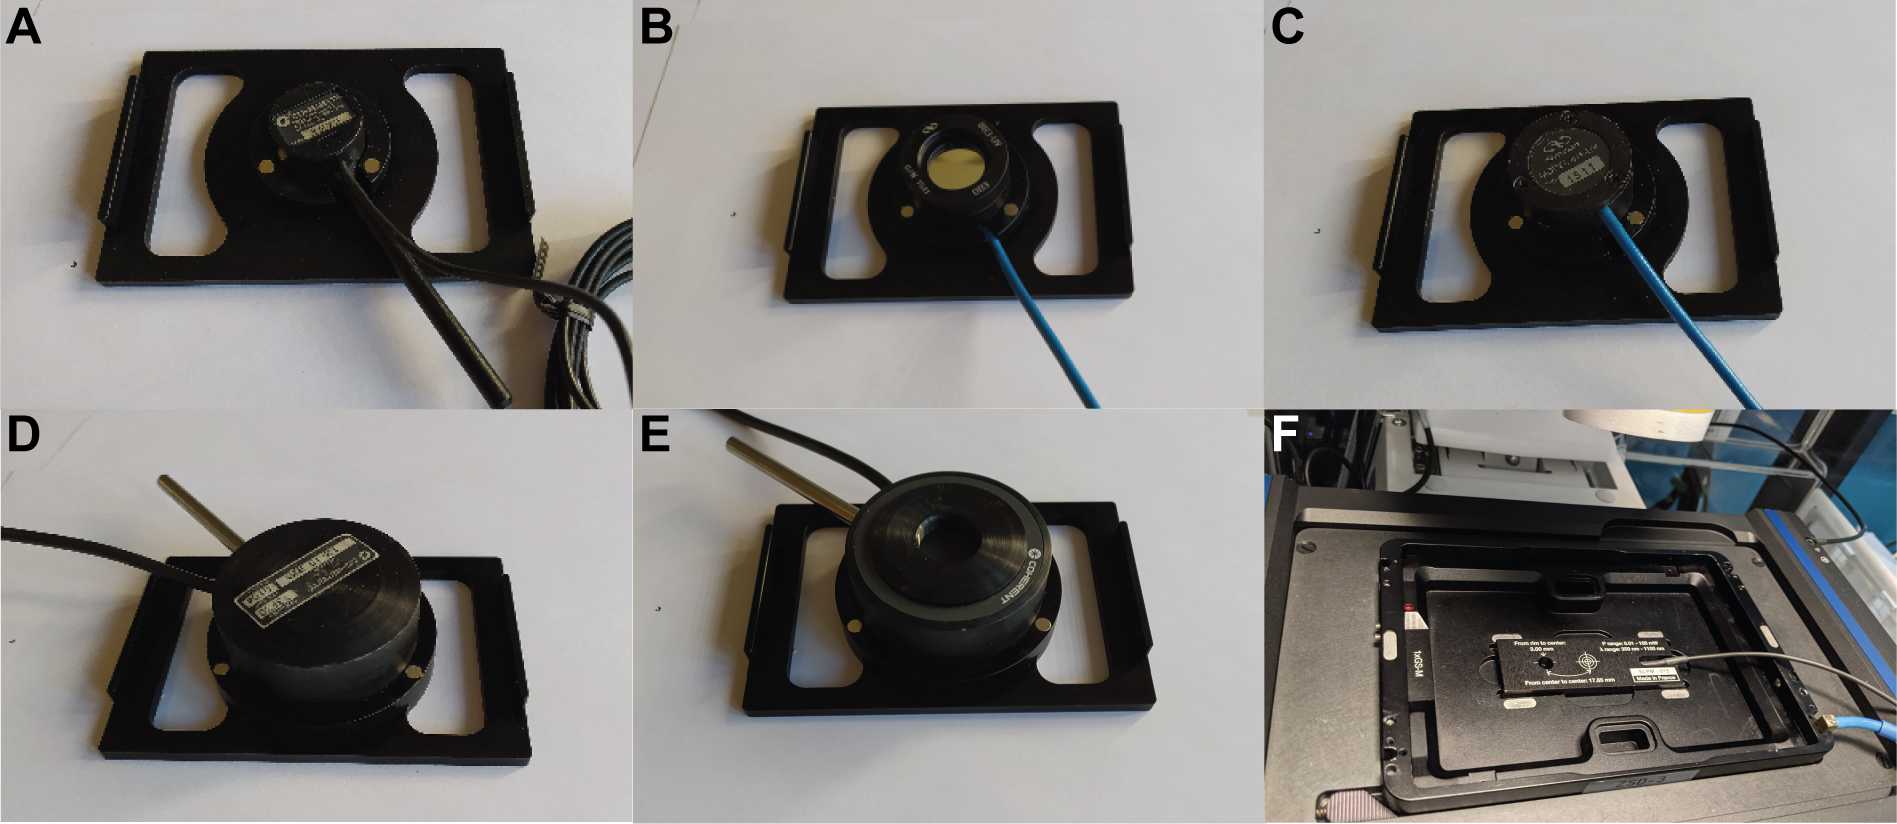
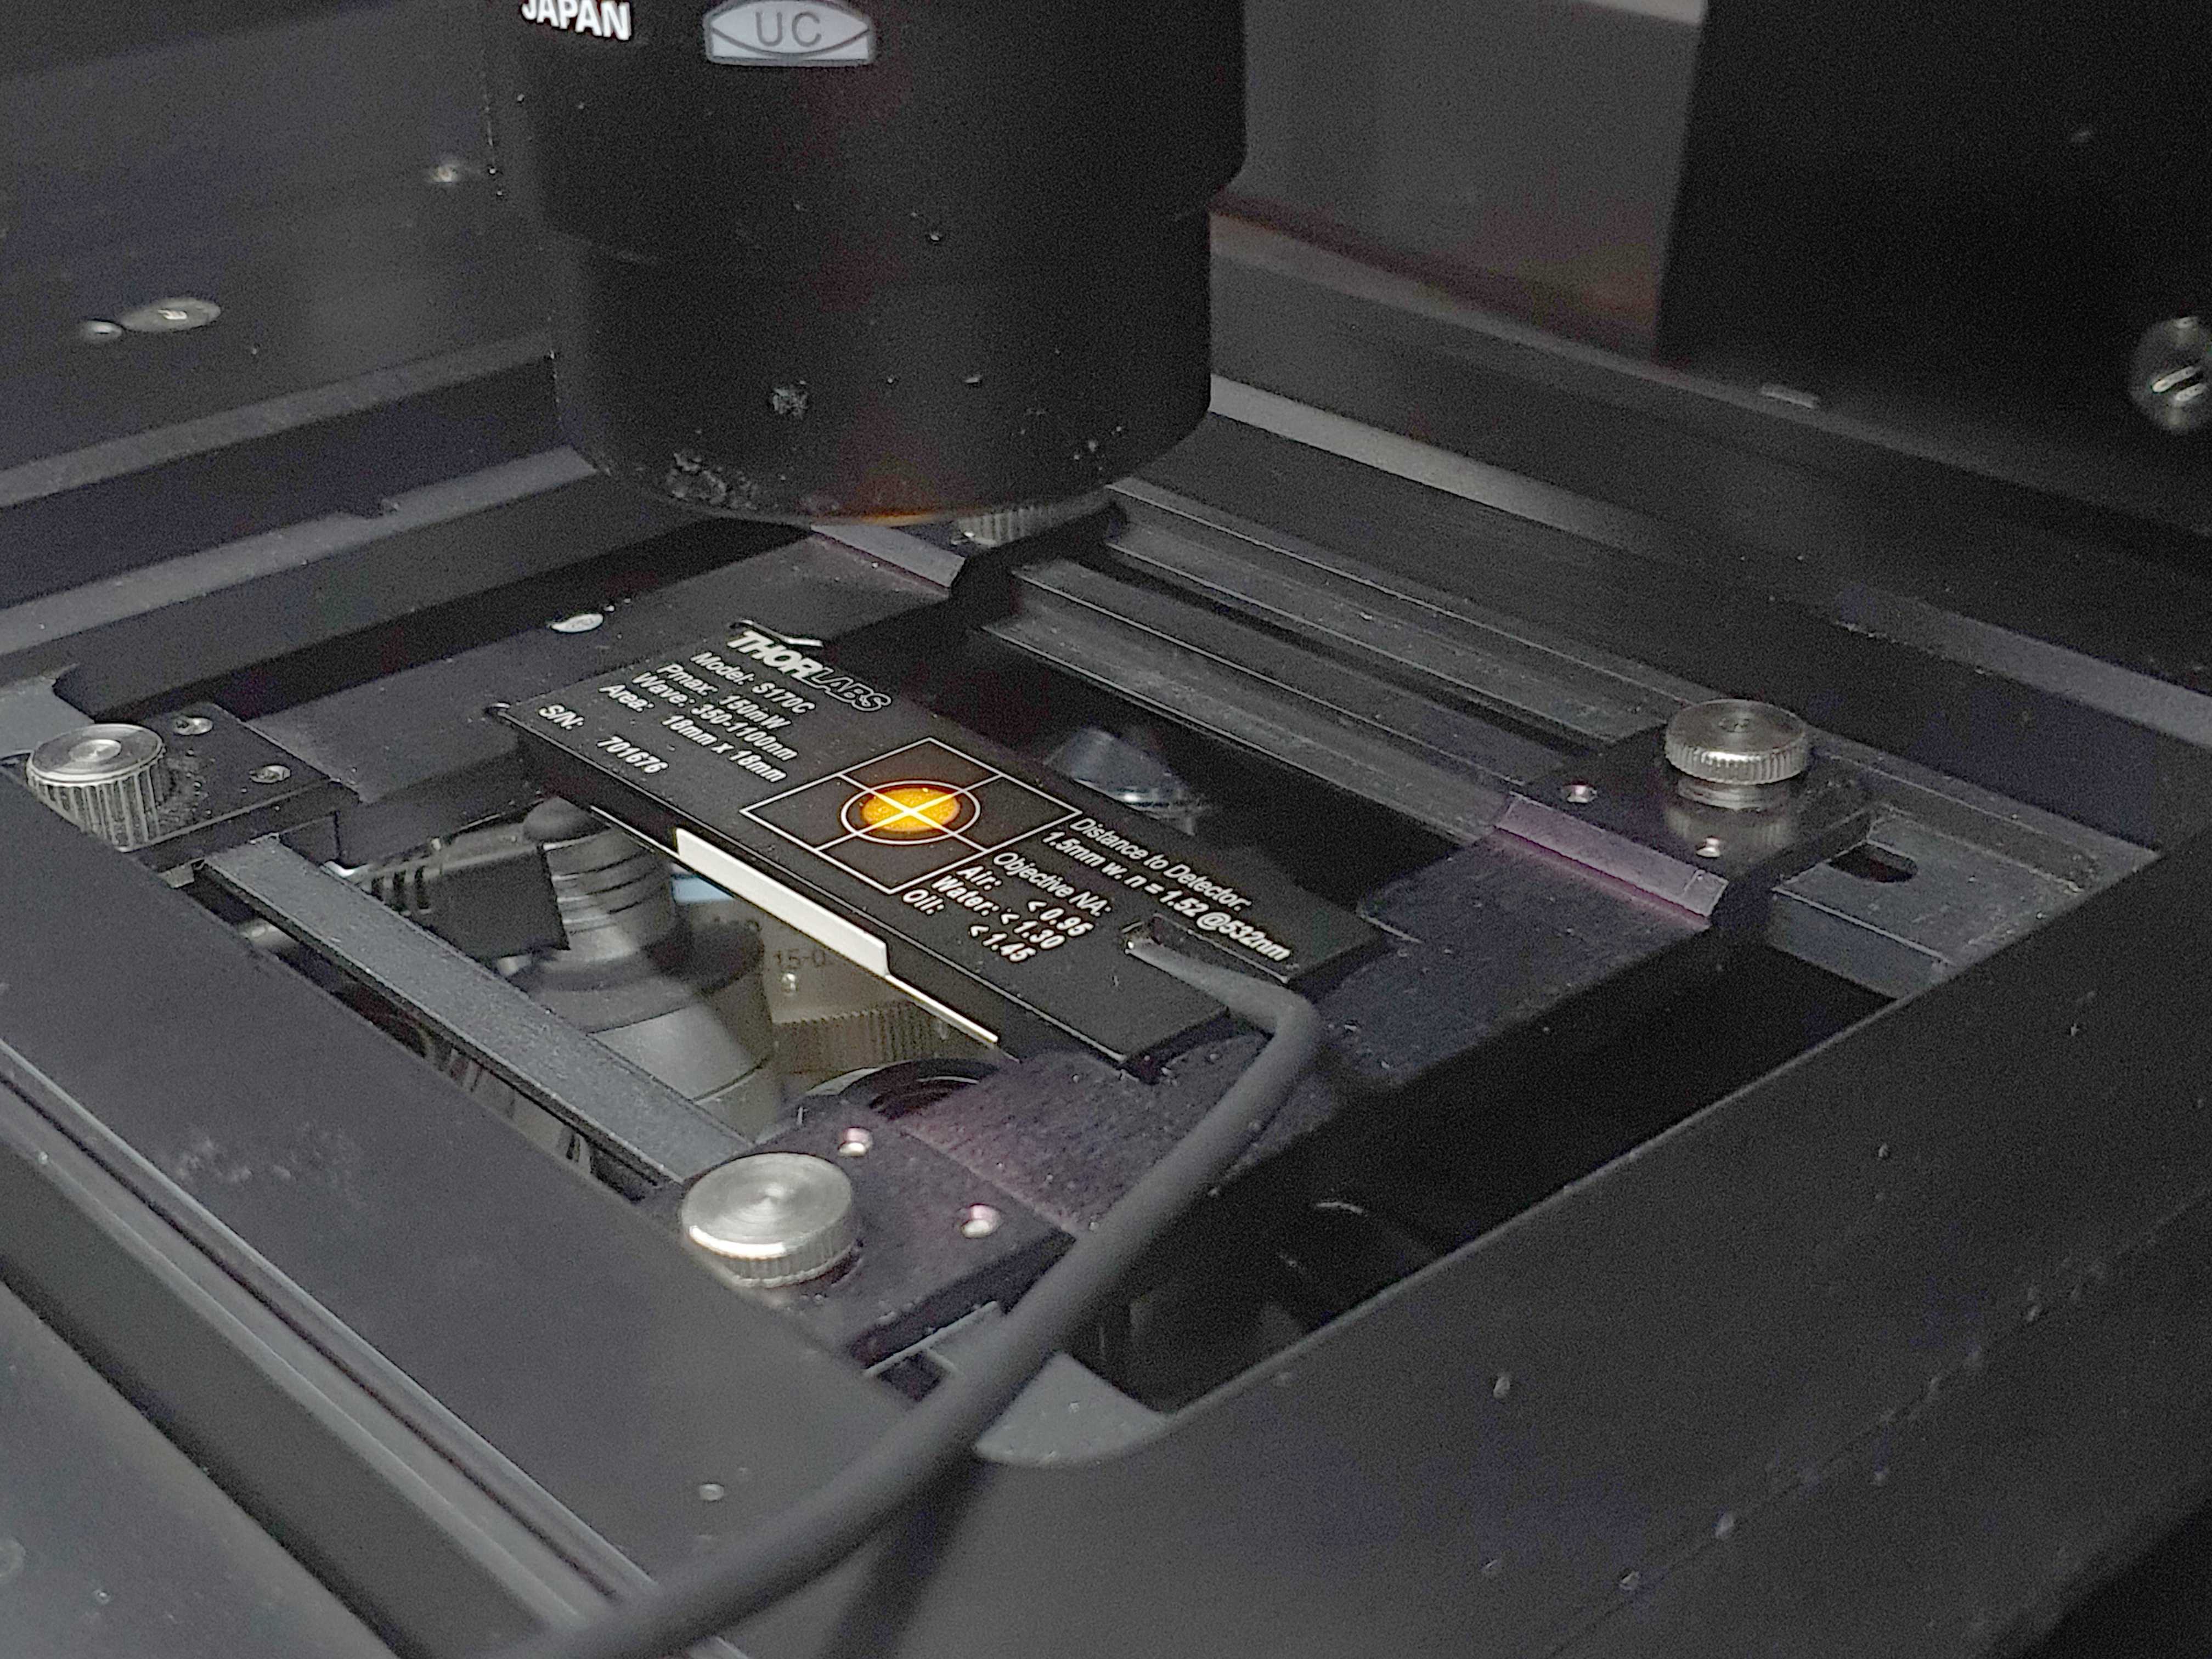
Place the power meter sensor in front of the objective. Choose an appropriate power meter sensor for your laser (Consult our Power meter Q&A Appendix 1- STEP14 ). It is important and preferable that the sensor is fixed (in a stage holder) and stable during the measurement. The operator should not hold or touch the sensor during the measurement. Since the sensor can reflect laser light, avoid orientating the sensor in such a way that it could reflect laser light directly to your eyes and skin or any other reflecting surfaces.

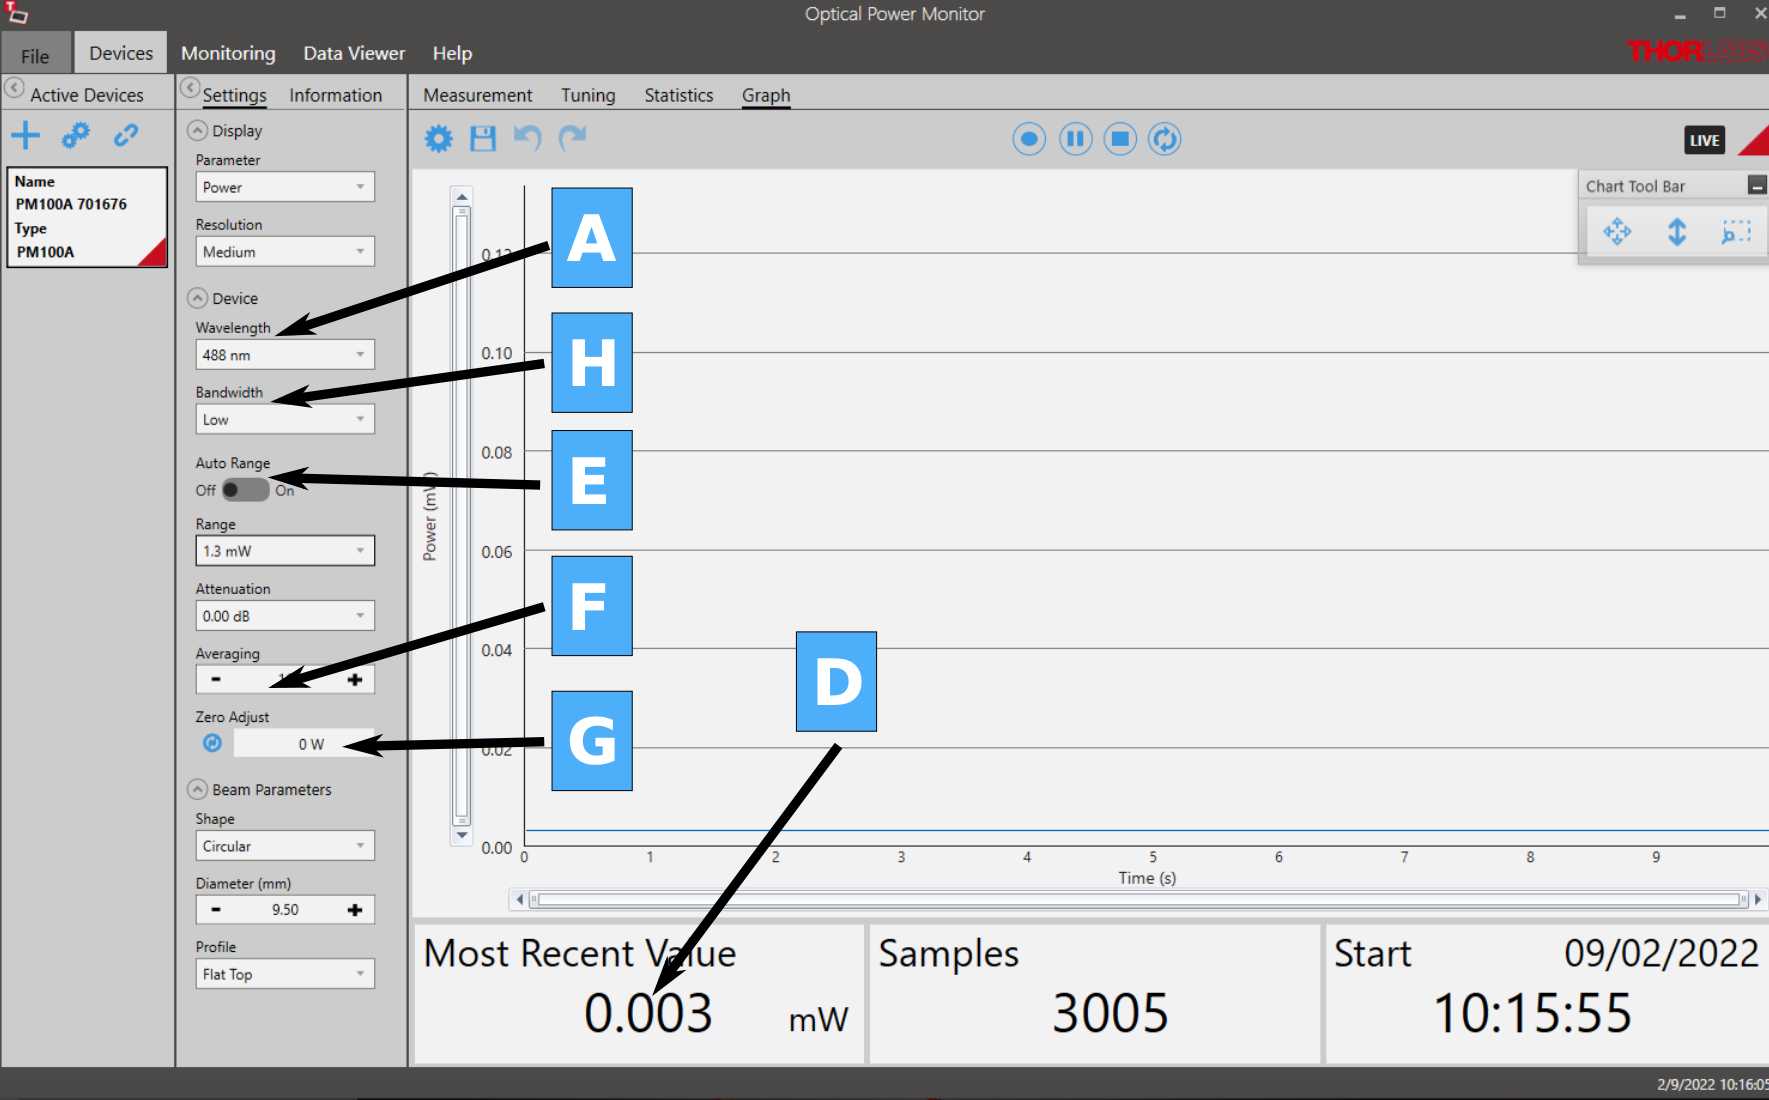
Select the wavelength of interest on the power meter control panel (see examples in Figure 3 ).


Zero the power meter while the laser is off or the beam is blocked ( Figure 3G ). Ensure ambient light is kept to a minimum and remains consistent throughout the measurements (i.e. room light off, while a small light source on a desks can stay on to provide some visibility and avoid accidents).
Center the illumination spot on the sensor. Avoid using the corners or the very periphery of the sensor for the measurement.

Switch on the laser and read the power output on the power meter ( Figure 3D ) using a suitable range if not automatically selected ( Figure 3E ).
At this stage and without logging the data yet, observe whether the power is stable, drifting or fluctuating over 10 seconds, as this can be an immediate indication of problems with laser control or certain optical elements.
Illumination stability measurement
Proceed with the power measurement and measure illumination power in mW over time for each wavelength (excitation wavelength, Figure 3A ) as follows: for short-term stability record every second for 5 minutes, for long-term stability record every 30 seconds, with 1 second integration time, over 120 minutes. Sampling, integration time and duration have to be set on the power meter before recording ( Figure 3 ). See also Appendix 4: Tutorials-STEP17 .
For routine maintenance, measure the illumination power stability at different laser intensities. We recommend starting with intensities corresponding roughly to 5%, 20% and 80% of maximum power. Record the powers measured in mW at the objective for these different percentages. When repeating the stability measurements at later times, set-up your system to get the same values in mW at the objective (i.e., not necessarily the same percentage). You need to measure the stability of a given illumination power (mW) at the objective, not of a given percentage.
Calculate illumination stability (as a % variation) using the following formula:
ΔPower (%) = 100x (1 - ((Pmax - Pmin) / (Pmax + Pmin)))
```where  _P_ max and  _P_ min are the maximal and minimal powers recorded during the time interval measured.


<Note title="Citation" type="success" ><img src="https://content.protocols.io/files/gmgc353n.jpg" alt="Figure 5. Examples of data collected for short and long term illumination power stability. A) Short term stability monitoring for a spinning disk equipped with 4 diode lasers. B&C) Long term monitoring for a spinning disk confocal and a raster scanning confocal microscope respectively. The spinning disk in (B) was not pre-warmed to show the warming up time of the lasers. The raster scanning in (C) was equipped with diode, DPSS and Argon - HeNe gas lasers. The Argon laser was particularly unstable due to aging and was later replaced. Measurements of the replacement laser are also shown (yellow triangles), displaying a better, but not perfect stability. Laser intensities for (B&C) were controlled with an AOTF. Power values of each laser line were normalized to the maximal value for each case." loading="lazy" title="Figure 5. Examples of data collected for short and long term illumination power stability. A) Short term stability monitoring for a spinning disk equipped with 4 diode lasers. B&C) Long term monitoring for a spinning disk confocal and a raster scanning confocal microscope respectively. The spinning disk in (B) was not pre-warmed to show the warming up time of the lasers. The raster scanning in (C) was equipped with diode, DPSS and Argon - HeNe gas lasers. The Argon laser was particularly unstable due to aging and was later replaced. Measurements of the replacement laser are also shown (yellow triangles), displaying a better, but not perfect stability. Laser intensities for (B&C) were controlled with an AOTF. Power values of each laser line were normalized to the maximal value for each case."/><span>   </span><span></span></Note>
Illumination linearity measurement
Plot the average laser power value (mW) measured versus the optical laser power fraction (or %) and determine the goodness of fit of a simple linear regression by calculating the coefficient of determination (r2). A perfectly calibrated system should have an r2 value very close to 1, as shown below in Figure 6 . We recommend making multiple measures (replicates) for accurate results.

Results display and tracking
As of the 1st of December 2021, 17 operators from different institutions tested this protocol, and our group collected 292 measurements.
Stability measurements communicated so far by QUAREP members are displayed on the QUAREP WG1 dashboard for different illumination source types (see Figure 7 and online WG1 Dashboard). These results do not constitute a norm but may help microscope users to evaluate the performance of their system in comparison to other systems in the field. You are invited to add your own measurements through our online form or by filling and sending us the .csv file, which can be downloaded from the Dashboard.
Appendices
Appendix 1: Power meter settings Q&A
Some of the answers below are specifics to Thorlabs' power meters
Appendix 2: Automation of measurements
Appendix 3: Impact of environmental factors
Appendix 4: Tutorials


