Illumination Power, Stability, and Linearity Measurements for Confocal and Widefield Microscopes
Gabriel Krens, Nathalie Gaudreault, Steve Bagley, Rodrigo R Bammann, Fabio Barachati, Laszlo Barna, Veronika Boczonadi, Ulrike Boehm, Manel Bosch, Craig Brideau, Mariana T Carvalho, Pina Colarusso, Richard Cole, Nasser Darwish-Miranda, Sam Duwé, Frank Eismann, Orestis Faklaris, Andreas Felscher, Manfred Gonnert, David Grunwald, Marcel Kirchner, Birgit Hoffmann, Alex J Laude, Jeffrey M LeDue, Pascal Lorentz, Miso Mitkovski, Michael S Nelson, Britta Schroth-Diez, Stanley Schwartz, Sathya Srinivasan, Roland Thuenauer, Tse-Luen Wee, Kees van der Oord, Chloë van Oostende-Triplet, Roland Nitschke, Laurent Gelman, Glyn Nelson, Penghuan Liu, Alex L Payne-Dwyer, Santosh Podder, Rizwan Ali, Sergiy V Avilov, Valeria Berno, Cristina Bertocchi, Nabanita Chatterjee, Suat Dervish, Ralf Dietzel, Zannatul Ferdous, Thomas Guilbert, Ayse Aslihan Koksoy, Gabriel G Martins, Valeria.MezzanoRobinson, Jaime Arturo Pimentel Cabrera, Douglas J Taatjes, Kurt R Weiss
Illumination Power
Illumination stability
Laser Power
Laser stability
Laser linearity
Illumination linearity
Disclaimer
This protocol was developed by the members of QUAREP-LiMi Working Group 1. The member list can be found here: (https://quarep.org/working-groups/wg-1-illumination-power/)
The QUAREP-LiMi is a world-wide group of scientists interested in improving quality assessment (QA) and quality control (QC) in light microscopy. We have members from academia, microscopy communities, companies, organizations or institutions related to standardization, scientific publishers, and observers from funding agencies.
Abstract
To obtain accurate, reproducible, and interpretable data when conducting imaging experiments, it is critical to consider external factors affecting data acquisition at various steps of the experimental workflow. Illumination power and stability represent two critical factors, especially when comparing fluorescence intensities between images during a time-lapse experiment or experiments performed at different times or on different microscopes.

The fluorescence signal can be generated by different types of light sources. These light sources and their coupling elements (e.g., fibers) can display varying performances over time as they age, move, or as environmental conditions change.

Unfortunately, microscope users can often only set illumination power as a percentage of its maximal output and may, therefore, not be aware of potential performance changes. It is important to recognize that a set percentage will not always yield the same illumination power in Watts at the objective over the course of an experiment, not to mention between days or systems. This means that selecting for example 10% output may lead to different experimental results over time or even between two microscopes of the same model. In addition to illumination stability, working within the linear range of the illumination power allows to adjust accurately the illumination power absolute value (in mW) using fraction (or %) of its maximal value through the imaging software.

If you are responsible for system maintenance, routinely measuring the illumination power, stability, and linearity over time can help you detect issues that affect the integrity of the system and thus the reproducibility of an experiment.

This protocol describes how to measure the stability and linearity of the illumination power using calibrated external power sensors. This protocol is at the moment intended for confocal systems (raster scanning and spinning disks), and widefield systems. It represents the collective experience of over 50 imaging scientists. Measurements made by our working group with this protocol are available in a public database, which will be updated with further contributions from the community.
Before start

Steps
Illumination power measurement
Select a low NA, air objective, such as a 10x objective, for this measurement. Ensure it is clean and presents no signs of damage.
Warm up the entire system, including the illumination source.
 and the laser power measured at the objective with a PM100A power meter and a S170C sensor (Thorlabs). The inset (greyed out) shows the first 25 min with greater details.")
Place the power meter sensor in front of the objective. Choose an appropriate power meter sensor for your laser (consult our Power meter Q&A Appendix 1 Q11 ). Make sure the sensor is fixed (in a stage holder) and stable during the measurement. Since the sensor can reflect the incident light, avoid orientating the sensor in such a way that it could reflect the light directly to your eyes and skin or any other reflecting surfaces.
 machined holders in multi-well size for use in upright or inverted microscope configuration for A) inverted and B) upright Coherent LM-2 VIS and C) inverted Newport 840 sensor model 818C, D) inverted, and E) upright Coherent LM-10 HT power sensors and F) commercial slide holder (Oko Lab) for the Argo-Power (Argolight) power meter sensor. Respective CAD files for these holders are available on the QUAREP website (https://github.com/QUAREP-LiMi/WG1).")
Center the illumination on the sensor. Avoid using the corners or the very periphery of the sensor for the measurement.

Select the wavelength of interest on the power meter control panel (see examples in Figure 3 ).
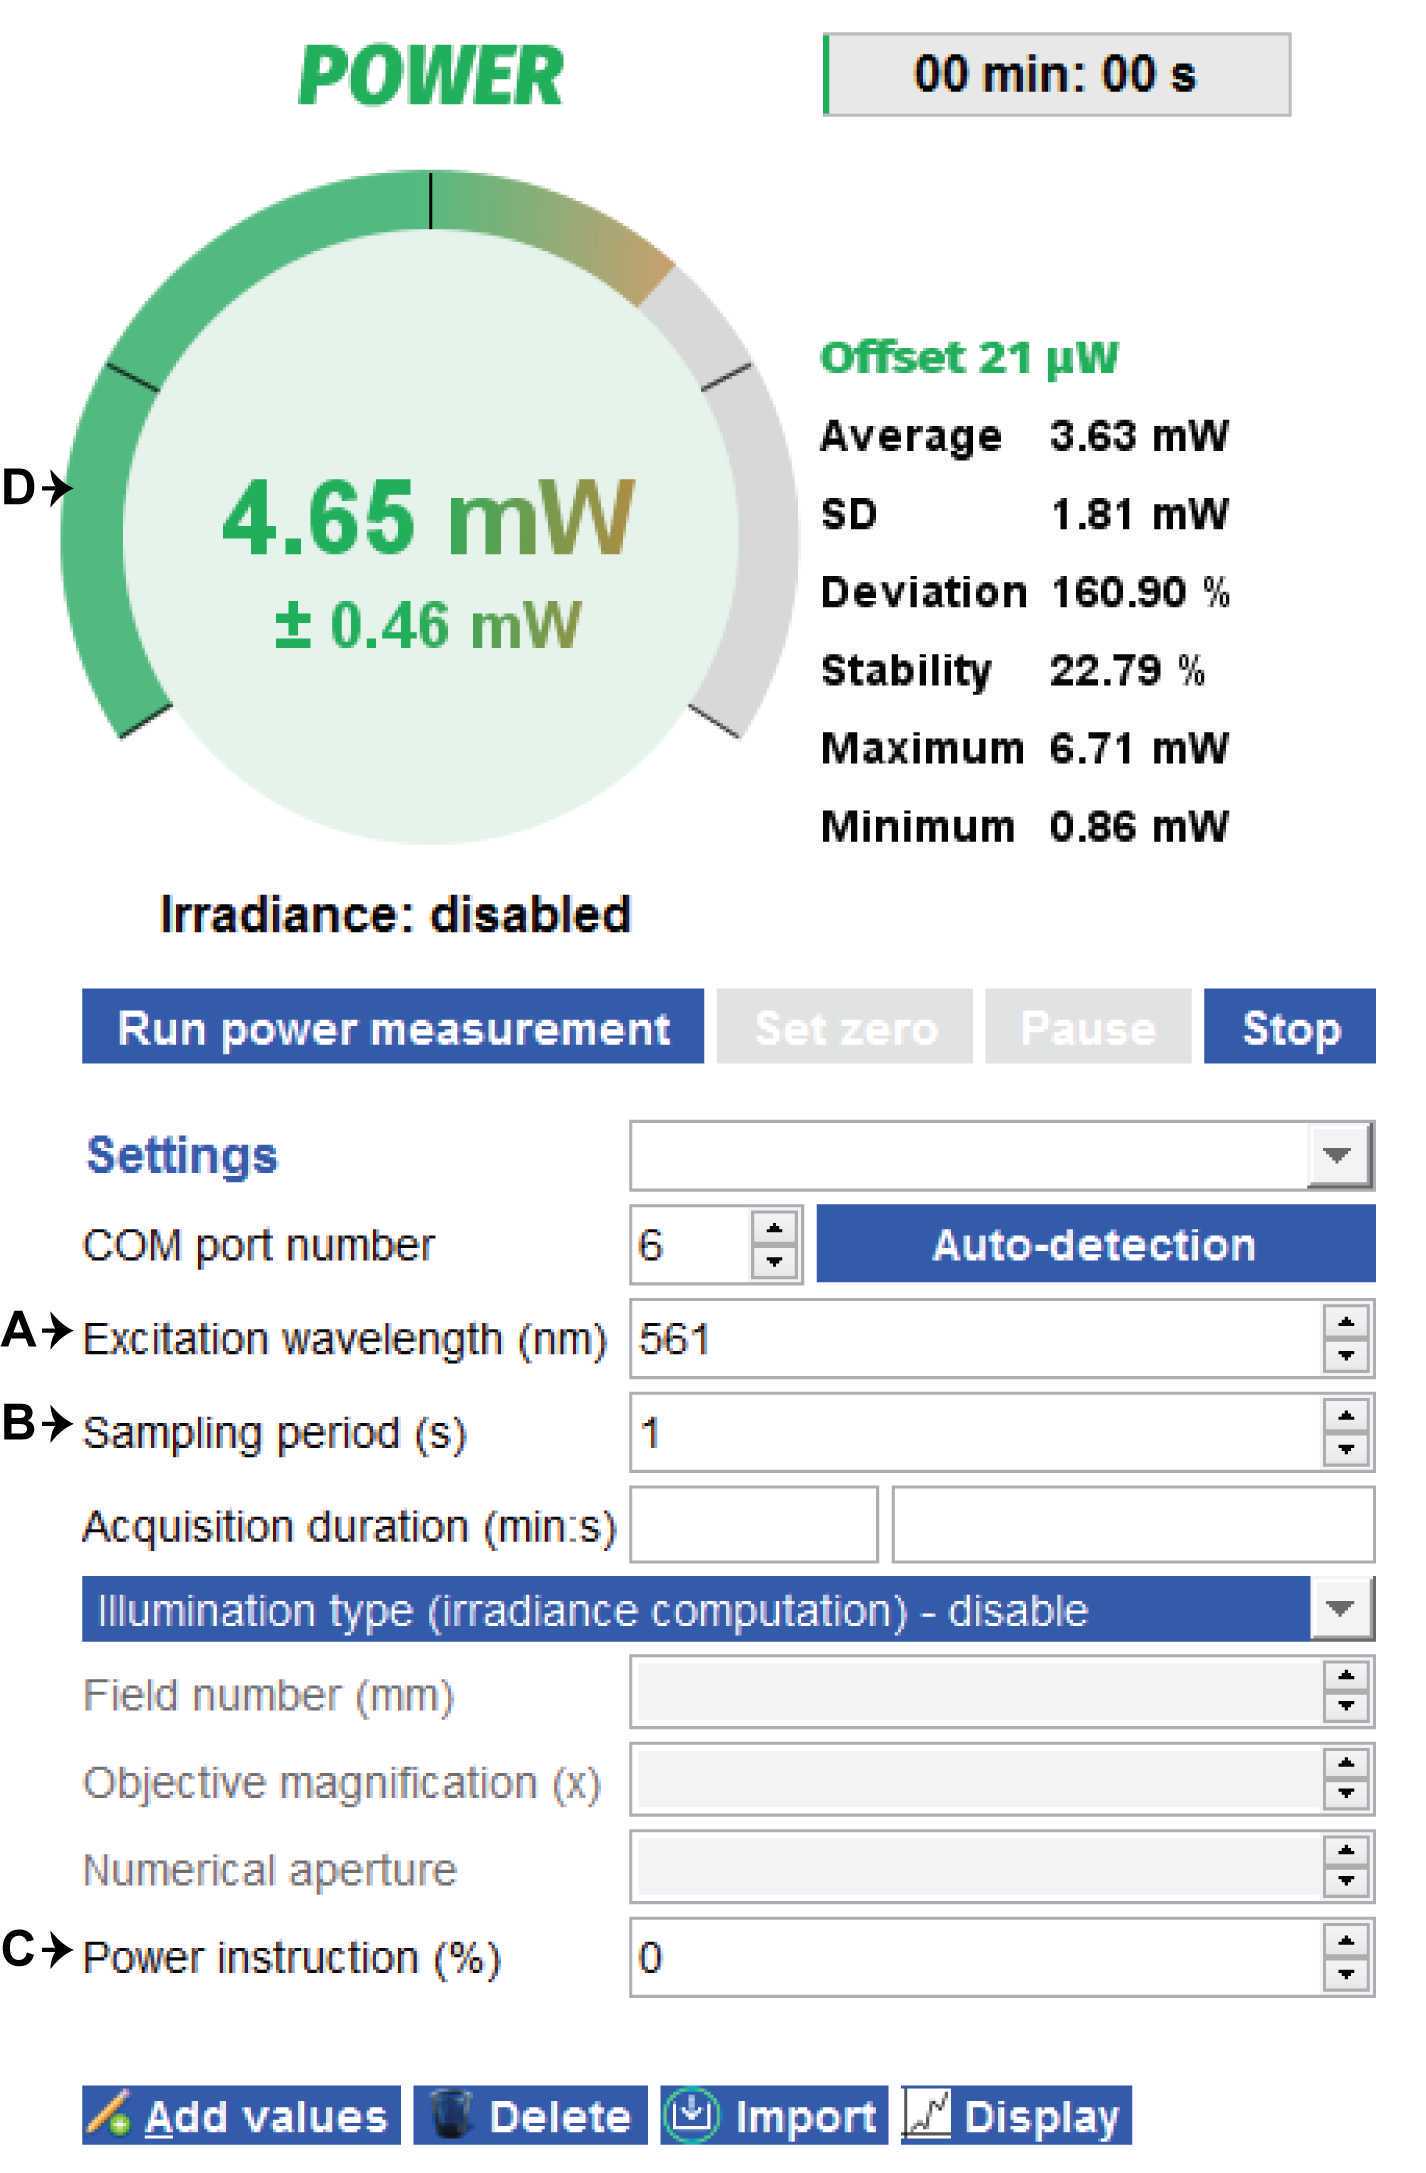
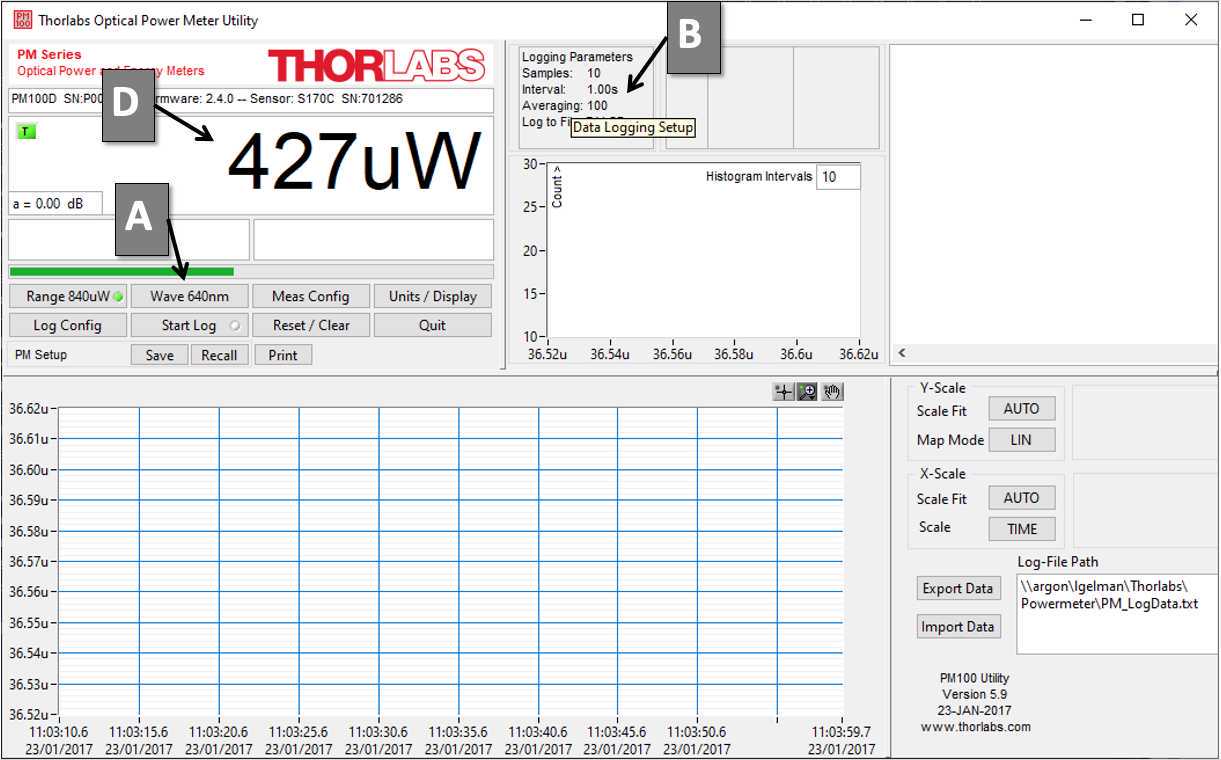
. Middle & lower panels: different Thorlabs software versions. A) Excitation wavelength selection, B) sampling period adjustment, C) power instruction in % selected from the imaging system software, D) power measurement in mW, E) auto range , F) averaging G) zeroing, and H) bandwidth. See Power meter Q&A Appendix 1 Q14, for explanations.")
Zero the power meter while the illumination is off ( Figure 3G , see also Power meter Q&A Appendix 1 Q15 ). Ensure ambient light is kept to a minimum and remains consistent throughout the measurements (i.e. room light off, while a small light source on a desk can stay on to provide some visibility and avoid accidents).
Switch on the illumination and read the power output on the power meter ( Figure 3D ) setting a suitable range on the powermeter (in most cases, best set your power meter range to "automatic") ( Figure 3E ).
Illumination stability measurement
Proceed with the power measurement and measure illumination power over time for each excitation wavelength or wavelength range.
For short-term stability : record every second for 5 minutes.
For long-term stability: record every 30 seconds, with 1 second integration time, over 120 minutes. Sampling, integration time, and duration have to be set on the power meter before recording ( Figure 3 ). See also Appendix 1 .
Calculate illumination stability (as a % variation) using the following formula:
ΔPower (%) = 100 x (1 - ((Pmax - Pmin) / (Pmax + Pmin)))
```where  _P_ max and  _P_ min are the maximal and minimal powers recorded during the time interval measured.


<Note title="Citation" type="success" ><img src="https://static.yanyin.tech/literature_test/protocol_io_true/protocols.io.5jyl853ndl2w/k7v4353n1.jpg" alt="Figure 5. Examples of data collected for short and long term illumination power stability. A) Short-term stability monitoring for a spinning-disk equipped with 4 diode lasers. B&C) Long term monitoring for a spinning-disk confocal and a raster scanning confocal microscope respectively. The spinning-disk in (B) was not pre-warmed to show the warming up time of the lasers. The raster scanning in (C) was equipped with diode (405nm), DPSS (561nm), Argon (488nm), or HeNe (633nm) gas lasers. The Argon laser was particularly unstable due to aging and was later replaced. Measurements of the replacement laser are also shown (yellow triangles), displaying a better, but not perfect stability. Laser intensities for (B&C) were controlled with an AOTF. Power values of each laser line were normalized to the maximal value for each case." loading="lazy" title="Figure 5. Examples of data collected for short and long term illumination power stability. A) Short-term stability monitoring for a spinning-disk equipped with 4 diode lasers. B&C) Long term monitoring for a spinning-disk confocal and a raster scanning confocal microscope respectively. The spinning-disk in (B) was not pre-warmed to show the warming up time of the lasers. The raster scanning in (C) was equipped with diode (405nm), DPSS (561nm), Argon (488nm), or HeNe (633nm) gas lasers. The Argon laser was particularly unstable due to aging and was later replaced. Measurements of the replacement laser are also shown (yellow triangles), displaying a better, but not perfect stability. Laser intensities for (B&C) were controlled with an AOTF. Power values of each laser line were normalized to the maximal value for each case."/><span></span></Note>
Illumination linearity measurement
For illumination power linearity measurement (or illumination linearity): record for 30 seconds with 1 second integration time, 10 incremental fractions of the total illumination power in steps of 10%, from 0 to maximum power value.
Plot the average power values measured versus the set power fraction (or %) and determine the goodness of fit of a simple linear regression by calculating the coefficient of determination (r2). A perfectly calibrated system should have an r2 value very close to 1, as shown below in Figure 6 . We recommend making multiple measures (replicates) for accurate results.
 as shown here for A) the 488 nm laser line and B) the 640 nm laser line.")
Results display and tracking
Enter your measurements in your database. You are also invited to add your own measurements to the QUAREP database via this online form or by filling and sending us the .csv file, which can be downloaded from the WG1 Dashboard.
. These results do not constitute a norm but may help microscope users to evaluate the performance of their system in comparison to other systems in the field.")
Appendices
Appendix 1: Power meter settings Q&A
Some of the answers below are specifics to Thorlabs' power meters
1. How much of the sensor area needs to be illuminated for accurate measurement?
It is recommended to not focus on the sensor and to keep the diameter of the illuminated area within 1 to 10 mm.
2. Should I use an immersion medium for my objective when measuring illumination power?
When measuring the power through a high NA objective (NA>1) it is important to check whether the sensor is designed to be used in air or whether an immersion medium should be used between the front objective lens and the sensor. Using an appropriate immersion medium allows the sensor to detect the total laser power over a high NA, without losses arising from deflection or reflection. Most power meter sensors are not water-proof, and can be damaged by exposure to water or oil. However, some sensors were designed specifically for microscopy applications and can accept a drop of immersion media (for example the S170C sensor from Thorlabs).
There will be a difference in power measurements with and without immersion media when the NA of the objective is above 1.1. This is caused by:
- Total internal reflection (which can be mitigated in the S170C via an index matching gel in between the silicon sensor and the cover window) and/or
- Absorption of light from the immersion medium (i.e.10% less for water and 15-20% less for oil when compared to air).
3. Is the detection linear across the sensor?
The measured power response may not be linear near the edges of the sensor. Hence, it is important to center the beam to improve linearity but also to avoid clipping the beam on the edges of the sensor.
4. How to prevent damage and saturation of the sensor?
Keeping the optical power below the maximum rating in the specification sheet prevents saturating the sensor. Higher powers than specified will saturate the detector or create zones of critical saturation on the sensor, leading to a non-linear measurement of the signal. You can use a neutral density filter to lower illumination power.
5. How does the integration and readout time work and what should be the preferred power meter bandwidth settings?
A photodiode has a response time of 1 µs, but the electronics behind it are slower depending on the readout device used. The rule of thumb is to set the bandwidth to "low". For very fast fluctuation measurements, it is best to use a very fast photodiode with an oscilloscope rather than a power meter, power meters being designed for slower changes (see Figure 3, Lower panel, H).
Very different speeds also require the usage of different photodiodes. When a photodiode converts photons to electrons, the flow of electrons out of the sensor is governed by its capacitance. Thus, large photodiodes, with high capacitance, are poor at detecting fast dynamics, but their large area makes it easier to capture the light beam, especially when it comes out a microscope objective with a low NA or when no objective at all is used. For fast dynamics, you will need a smaller photodiode, which has lower electrical capacitance and responds faster, and you will need electronics designed to sample quickly as well. For this, a high-speed oscilloscope is preferred.
6. Does the power meter need to be calibrated or just the sensor?
The power meter does not change over time, thus, only the sensor needs to be calibrated regularly. Calibration data is typically saved in a chip in the DB9 (red) connector of the sensor for Thorlabs power meters. Other vendors may store this information elsewhere. We recommend checking the calibration status of your sensor by comparing the results to those obtained with a different sensor.
7. How often does a power meter need to be calibrated?
It is different depending on the power meter you use, but typically the measurement accuracy may change by 2-3% over 3-4 years but could also deviate by up to 10% over a longer time. In general, it is recommended to calibrate a power meter yearly. However, if you are not exceeding the specified power rating, a calibration should be stable for 2-3 years. This is within the wavelength range of 300 to 1060 nm; shorter wavelengths may incur further deviation.
8. Is using a power meter safe?
For standard confocal microscopes, it is generally safe to take power meter measurements but before you do so, make sure you check with the vendor or the person who built your system. Also, check your organization’s regulations around laser safety, as they vary by country and jurisdiction. Precaution regarding the reflectivity of the coating of the sensor should be taken. Up to 0.5-1.5% reflection may occur when delivering high powers to the sensor. You can damage your eyes using a power meter through stray reflections from a significantly powerful lamp or laser, and you must be trained to carry out this procedure using eye protection, when necessary. Under no circumstances should you check high-powered lasers such as those used in multi-photon systems, TIRF systems, or point localization systems without training.Typically, less-reflective thermal sensors are used with a higher power as they have higher maximum power ratings and are designed to measure such lasers.
9. Can you capture the data and change settings on a computer?
If your power meter uses a standard Universal Serial Bus (USB) to a Common (COM ) terminal you can send Standard Commands for Programmable Instruments (SCPI) to the power meter and query data and other parameters. For example, the PM400 (Thorlabs) allows for different capture intervals to the internal memory via SCPI commands. Most common programming languages support serial terminal commands so writing a simple program to query the power meter from a personal computer is often straightforward. Some power meter consoles also support storage media such as a removable USB drive or Secure Digital (S.D.) card which can log data for later review.
10. How to calculate the photon flux from power measurements?
The number of photons (n) observed per unit time (t) is the photon flux (Φq).
Formula:
Photon Energy: Ep=hc/λ
Measured Power: Pmeas=n∙Ep/λ
Photon Flux: Φq=n/t=Pmeas/Ep=Pmeas∙λ/hc
(c =3∙10^8 ms and Planck constant h=6.62607015∙10^−34 Js)
11. Are there different types of power meter sensors?
Yes, three different types: photodiode, thermal power, and pyroelectric energy sensors.
- Photodiode sensors have a strong spectral sensitivity dependence and must be calibrated over the entire wavelength range. On the other hand, they have a high dynamic range (70dB), very low noise, and high response speed. Photodiodes are made of different semiconductor materials like silicon (190-1100 nm), germanium (400-1700nm), and indium gallium arsenide (800-2600nm). They are common for low-to-medium power measurements typical of visible light confocal microscopes.
- Thermal power sensors use the Seebeck effect that turns heat flow into a power-proportional voltage. They can be used up to very high-power levels. Their useful dynamic range is much lower than the range of the photodiode sensors (30dB). Another drawback of the type is that they are very sensitive to ambient temperature or airflow (drafts). Hence, they should be shielded from moving air during measurements. In general, the speed of response is low. Therefore, a few seconds of settling time is often required
- Pyroelectric energy sensors can only handle pulsed signals (no continuous wave). A pyroelectric crystal converts the heat impact of a laser pulse into its energy-proportional voltage. They are more commonly used for high energy, lower repetition rate pulse lasers which are not common in microscopy except for certain photo-activation and microsurgery applications.
12. Using the same type of sensor, will all power meters give me the same values?
Yes, most of the time. However, different values can be observed between different models of power meter sensors due to the sensor's calibration, electronics, and composition (a sensor without gel filling the gap between the filter glass and sensor surface will show lower power levels with high NA objectives).
Different values can also be obtained when measuring broadband light sources. Different detectors or filters have different spectral curves, which can run in opposite directions. Since you can only set one wavelength point from the entire incident light spectrum, the light outside the wavelength set point gets weighted differently and causes the difference in the reading.
13. Do different light sources (e.g., laser, LED, lamp) require a different type of sensors?
Thermal sensors best measure broadband light sources, such as white lamps, as this type of sensor, is not wavelength sensitive.
Narrower-band light sources, such as filtered lamps, lasers, and LEDs can be measured with photodiode sensors but the accuracy of the measurement will depend on the bandwidth of the source. Most lasers and LEDs are narrow band enough that the error will be negligible, but some broadband LEDs (phosphor type without a bandpass filter) may be more accurately measured with a thermal sensor if sufficiently powerful. If a photodiode is used for a broadband light source, the error may be compensated for by considering the wavelength response of the photodiode, as discussed above.
14. Is the electric grounding of a power meter essential?
Power meters typically filter interference from nearby electronics or power cords. For very sensitive measurements, or particularly electrically noisy environments (rare), additional measures may be necessary (like grounding your sensor). It is also preferable to use the power meter in battery-operation mode (unplugged from wall power) as this will isolate the meter electronics from any noise coming through the power lines.
15. Is zeroing the power meter at each wavelength important?
The zeroing feature measures dark current (if the sensor is covered and is not detecting ambient light), and subtracts it from future measurements. It is not wavelength dependent. Therefore, you can simply do it once when you switch it on.
The zeroing feature can also be used to compensate for room lighting by performing the “zero” sampling with the sensor uncovered, but the light source to be measured shuttered or blocked.
After zeroing, keep the room light settings constant during your measurement.
16. How to measure the pulsed input and peak power of your light source?
You need a fast response/reacting power meter (like the new Thorlabs PM103) and sensor, or a pyroelectric energy sensor for these measurements. For microscopy applications, typically only some fast-flashing stimulation or uncaging light sources require these types of measurements. If the power meter response speed cannot follow the pulses, you will get an average measurement as the sensor will average the effect of the pulses over time in its reading.
17. How can circularity, shape, and diameter of the beam affect the measurements?
The power reading (Watts) should not be affected by the shape and diameter of the illumination spot except when the illumination spot overfills the sensor or is focused so tightly on the sensor that it creates local variation or saturates the sensor area (this can damage the sensor). It is best to have a defocused illumination spot, as mentioned in Question 1.
The power per unit area (usually W or mW per cm2) is impacted by the illumination spot's shape, intensity profile, and diameter. If the geometry and profile parameters of the illumination spot are known, they can be used to calculate irradiance (mW per cm2) once the overall power in Watts is measured.
18. What does "averaging" exactly do?
Depending on your chosen settings, it averages the results of multiple readings, reducing measurement noise. For example, if you set the power meter with an average of 100, it will take 100 readings and report their average. Note that averaging slows down the speed of measurement, as the meter must acquire all the readings to be used in the average before performing the average and displaying the result, although most meters are fast enough that 10s or 100s of readings for an average is not excessive. (Figure 3F)
19. How to measure Broadband Light Sources?
Every sensor has a wavelength-dependent responsivity (see Figure 8 ). To achieve a correct power measurement, the current or voltage measured by the power meter must be multiplied by the responsivity factor of that sensor at the illumination wavelength used (if the power meter model used does not do it automatically).
When using lasers, this operation is directly taken care of by the power meter once one has entered the laser wavelength into the power meter ( Figure 8a ). If not, to do the calculation without a power meter, just take the measured current or voltage measured by the power meter and divide it by the responsivity value at your laser wavelength from the calibration certificate of your sensor. Ex:
Power = I / R(λ) for photodiode sensors
Power = V / R(λ) for thermal and pyroelectric sensors
with I being the current and V the voltage measured.
For example, using the responsivity curve shown in Figure 8a, if the current measured at 830nm is 3mA, the power is 3[mA]/0.52[mA/W]=5.77[W].
For broadband illuminations, like LEDs or other lamps in combination with excitation filters, one must take into account at least three important parameters that may influence the absolute power measurement: the spectrum of the light source, the specifications of the excitation filter and of the dichroic, and the responsivity of the power meter sensor (see curves in Figure 8b ). However, to make the measurement easier and robust, WG1 agreed on a convention: the wavelength to be set on the power meter should be in the middle of the bandpass of the excitation filter. Note that if the measurement is done within the linear range of the responsivity curve of the power meter ( Figure 8 ), using the center of the bandpass is a way of averaging responsivity values. The specific spectrum of the light source within the excitation bandpass should not have any significant influence on a biological experiment, and is not getting further consideration here.
For the measurement and calculation of power from the current or voltage value, proceed as for lasers above.
The measurement has to be done for every channel (i.e., a combination of LED/laser and filter set) used.
In the case where a multi-band pass excitation filter is used, the wavelength set on the power meter should in the middle of the band-pass region matching the LED used.
There are thermopile sensors that are designed to measure light power of light sources with a bandwidth of wavelengths. For the width of bandpass filters and powers typically used in light microscopy the predicted divergence of thermopile sensors form the above proposed method are expected to be moderate. (From Thorlabs/M. Gonnert: There will only be a negligible deviation (~1%) between thermal or photodiode sensor for narrow bandwidth (<1nm) light source. For low power levels (<100 mW range) the photodiode will always deliver more stable readings and lower noise levels, although thermal sensors with sub-microW resolution exist.) Thermopile sensors are also not sensitive to the entrance angle of light. There is a specialized detector (S175C) from Thorlabs for use with immersion microscope objectives.


Appendix 2: Automation of measurements
Appendix 3: Impact of environmental factors
Appendix 4: Tutorials
How to place a power meter sensor on a microscope
How to set up a Power Meter for Illumination Intensity Measurement on a Light Microscope
Short-term laser stability (using Zen Blue (Zeiss) and Argopower meter (Argolight)
Laser Power readings on a Nikon confocal with a Thorlabs Power Meter
