Homology modeling using SWISS-Model for Biochemistry I
Chris Berndsen, Michael Friedman
Abstract
Protocol for homology modeling proteins for use in Biochemistry I at James Madison University. Protocol guides students to use the SWISS-Model web server (citations below).
Citations for servers:
- Waterhouse, A., Bertoni, M., Bienert, S., Studer, G., Tauriello, G., Gumienny, R., Heer, F. T., de Beer, T. A. P., Rempfer, C., Bordoli, L., Lepore, R., and Schwede, T. (2018) SWISS-MODEL: homology modelling of protein structures and complexes. Nucleic Acids Res. 46, W296–W303.
Before start
Gather your sequence in FASTA format (an example is shown below)
>seq_name
MASDETEASETEAMDAET
Steps
NCBI BLAST
Navigate to NCBI BLAST (Basic Local Sequence Alignment Tool) and paste your sequence into the "Enter Query Sequence" box.
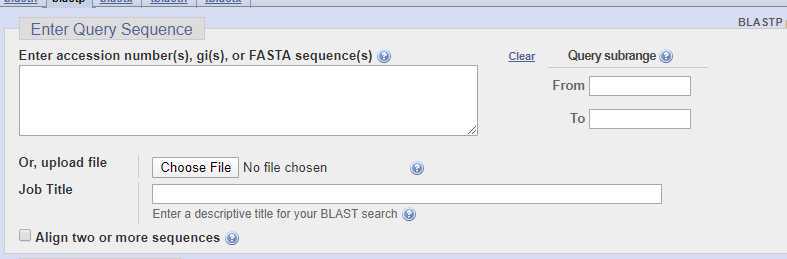
The standard settings for the search are shown in the table.
| A | B | C |
|---|---|---|
| Default Setting | What it does | |
| Enter Query Sequence | ||
| Query Subrange | (Blank) | Limits search to a part of the sequence. Can be useful if there are common motifs/domains in the sequence. |
| Choose Search Set | ||
| Database | Non-redundant protein sequences (nr) | Limits search to a sub-set of sequences. For homology modeling searching the Protein Data Bank proteins (pdb) is a good idea if you want to see if your modeling might be successful. |
| Organism | (Blank) | Limit search to a specific organism or other taxonomic group. |
| Exclude | (Unchecked) | Reduce results by removing certain classifications of sequences. |
| Program Selection | ||
| Algorithm | blastp | Setting changes how the databases are searched. blastp is the most straight-forward. PSI-BLAST is useful when the query sequence is not easily aligned to other sequences. |
Record any changes to the settings in Step 2.1 below:
Press BLAST and wait until the results return.
Thie search can take up to 1h 0m 0s
Analysis of BLAST results to ID sequence
Results will be returned as shown as below:
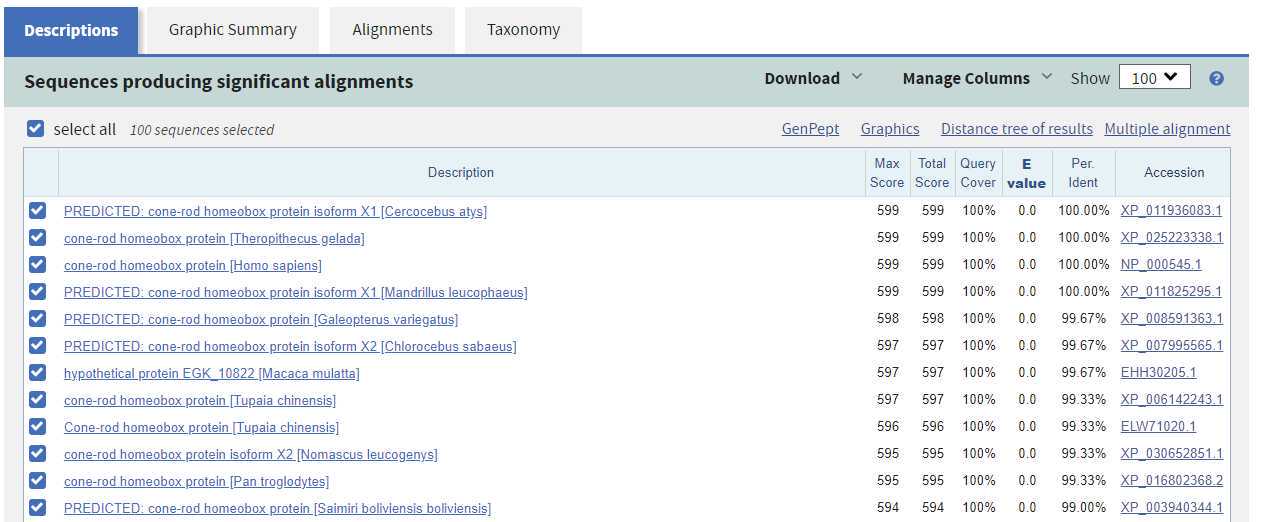
Column definitions from the Descriptions tab of the results.
| A | B |
|---|---|
| Table column | What it tells you |
| Description | Tells you identify of matching sequence. Predicted or hypothetical in title indicates protein has not been verified. |
| Max Score | During alignment identities, similarities, and gaps are scored. This indicates the best score if the sequence was aligned multiple times. |
| Total Score | If many disconnected parts matched, this is the sum of the max scores for those |
| Query Cover | Indicates the percentate of the query sequence found in the match. 100% means all of the sequence was found. |
| E value | E(xpect) value tells you how many sequences that would rank higher if this was a random match. 0 or very small numbers are good. |
| Per. Ident | How much of the sequence was identical in sequence. Need >40% for good homology model. |
| Accession | The accession number for the sequence. Can be clicked to take you to the info card on that sequence. |
Record your best 5 sequences and their statistics in the table below.
| A | B | C | D | E | F | G |
|---|---|---|---|---|---|---|
| Sequence Description | Max Score | Total Score | Query Coverage | E value | Per Ident | Accession |
In the Graphic Summary tab, you can view the domains in your sequence.
A domain is a part of the sequence with a known fold/shape/structure. A motif is a sequence that has a shape or function. Typically domains can fold on their on, while motifs are shorter pieces within domains.
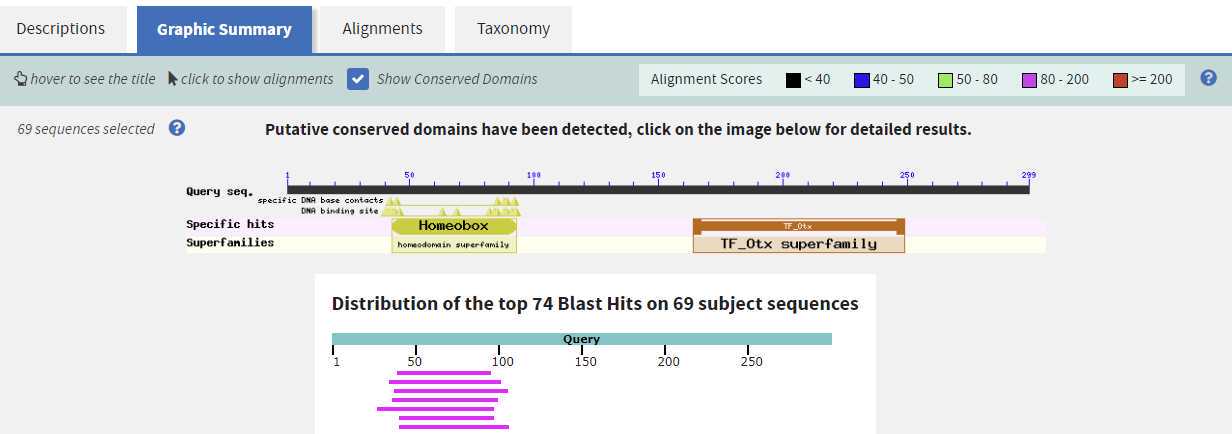
Record any domains or motifs in the table below along with the approximate position within the sequence. This can help in the modeling and support the accuracy of your model later on.
| A | B |
|---|---|
| Domain/Motif name | position (this should be a number/set of numbers) |
In the Alignments tab, the actual sequence alignment (the data) are shown.
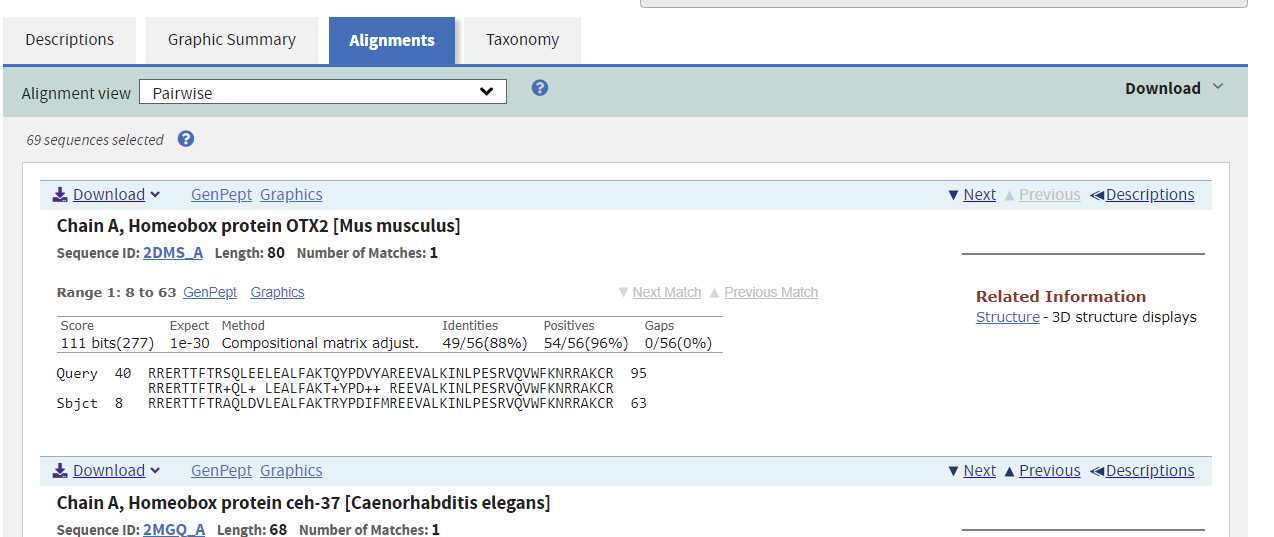
Each alignment shows the following key information:
- Identities and their location within the sequence.
- Positives and their location within the sequence.
- Gaps and their location within the sequence.
- The alignment : Your sequence is the top row, the matched sequence in the middle row (+ means similar), and the sequece from the database (called Sbjct).
- Position number of the sequence match. These are the numbers at each end of the sequences.
Press the Download link to the top right of the alignment and select Text you will get a complete file of your results. Upload this to your folder for this project and name the file:
[date]_[sequence_name]_[team_name]_BLAST_alignment.txt
```Replace  **[Group_name]**  with your name/group name without the brackets. Replace  **[sequence_name]**  with the name of the sequence.
Indicate your file location as a link within a note on this step.
THIS IS YOUR DATA FILE FOR THE SEARCH!
Analysis of BLAST results to ID potential modeling templates
and repeat search but limit the Database to Protein Data Bank proteins (pdb). This search will identify proteins of known structure that match your protein and can suggest if your modeling attempt will be successful. Record your sequence matches in the table.
Accession numbers here lead to the information on the structure which may help when using SWISS-MODEL. These accession numbers are the PDB ID numbers.
| A | B | C | D | E | F | G |
|---|---|---|---|---|---|---|
| Sequence Description | Max Score | Total Score | Query Coverage | E value | Per Ident | Accession |
Table for recording results from PDB focused BLAST.
The top five structures here are potential templates structures which you can use to model your sequence. This means these structures are similar at the sequence level to your sequence and potentially will result in a similar structure to your sequence.
Homology modeling using SWISS-Model
Click on the link for the SWISS-model server to get to a page that looks like
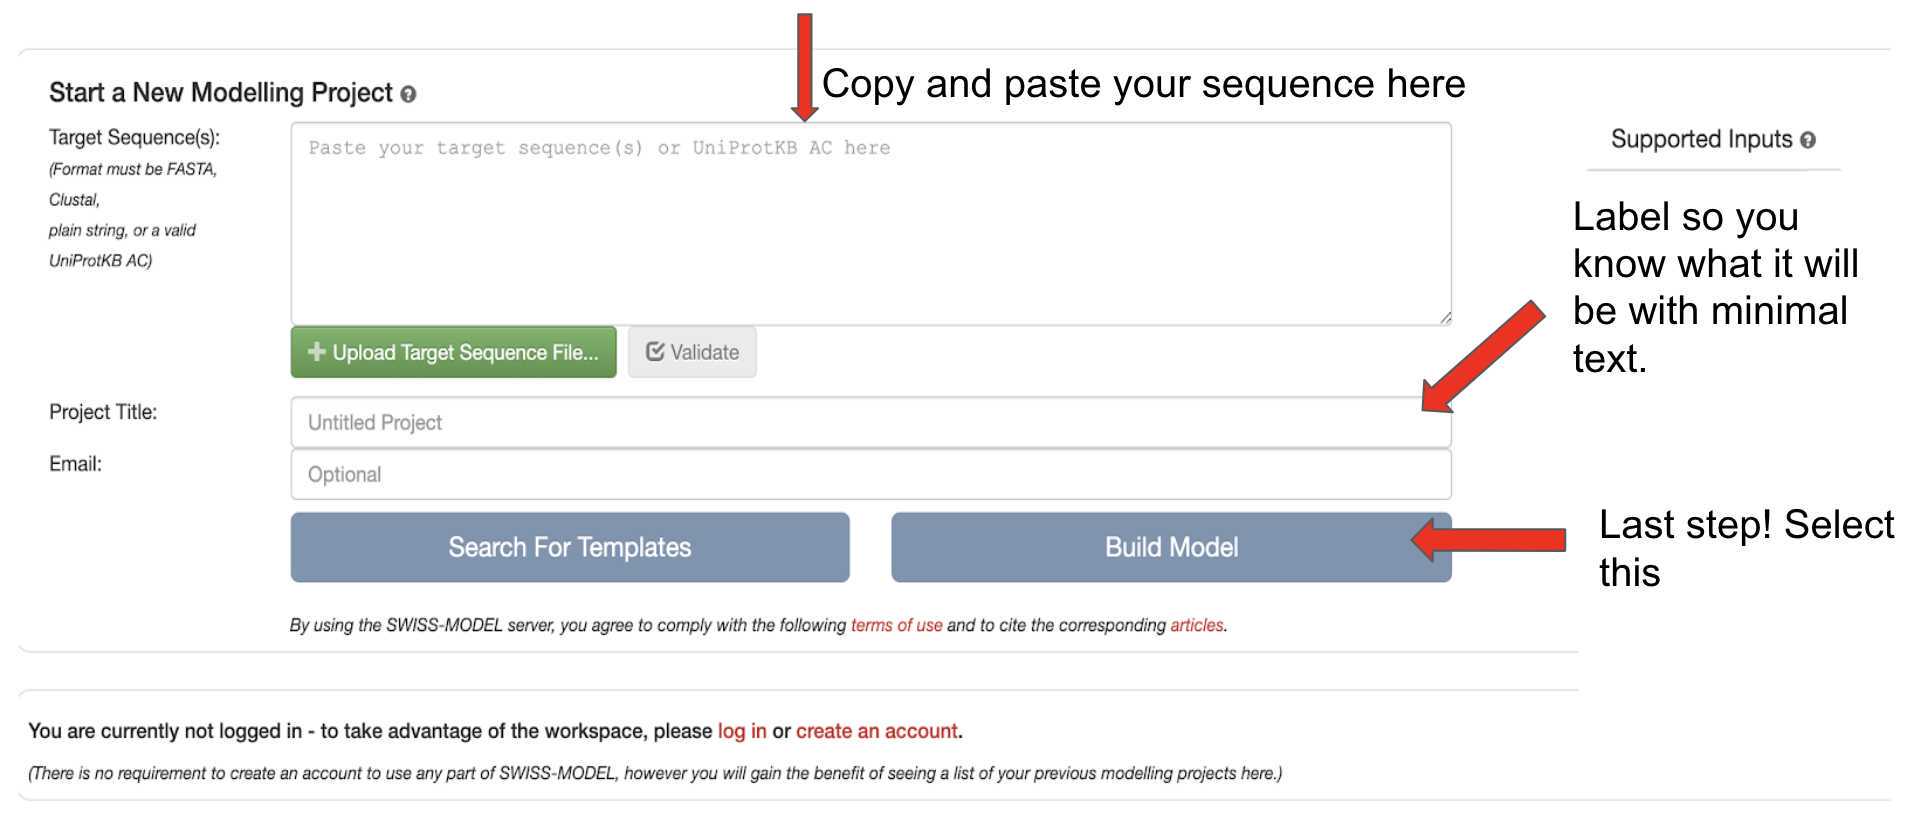
Follow the instructions on the image above to start the modeling by Build Model . Initial steps can take up to 0h 20m 0s
If you choose to do manual building via the Search for Templates tab. Record your templates below.
| A |
|---|
| Template name (second column in table) |
Once model building (either manual or automated) is complete, a screen as shown below will appear.
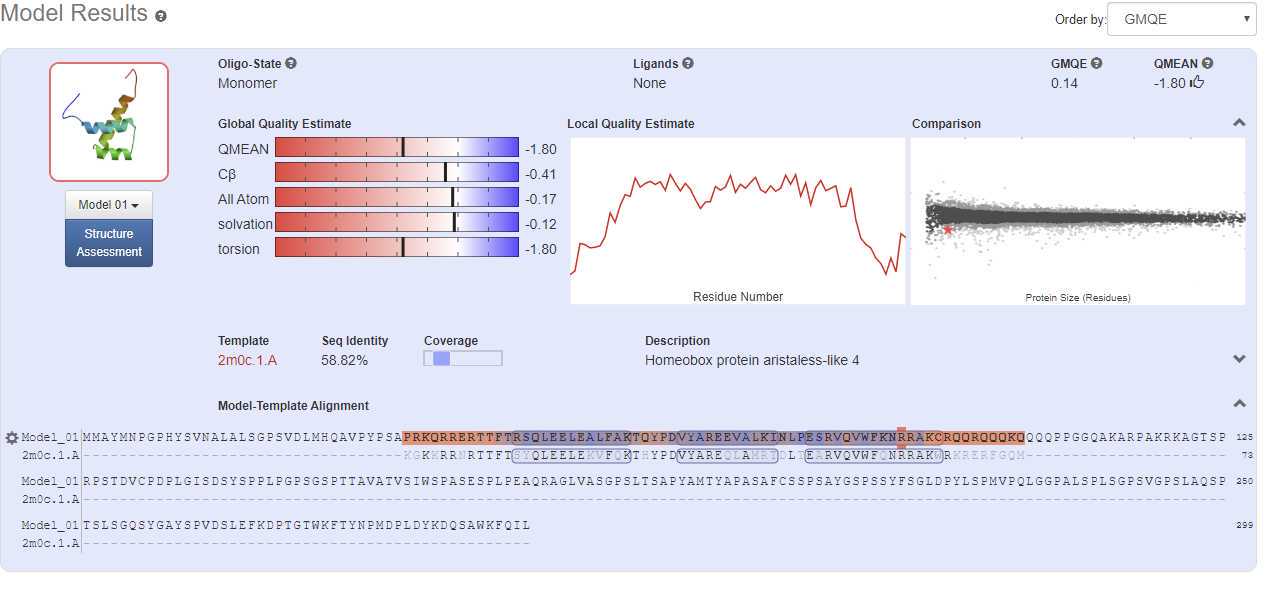
Useful information from this screen
- GMQE for Global Model Quality Estimation is scored from zero to 1 and indicates model quality based on the alignment with numbers closer to 1 indicating a more reliable model.
- QMEAN indicates the model quality based on structural features and the quality of the chemistry such as torsion angles and solvation. A good model has a number that is more positive, although a good model can have a negative QMEAN score. Less than -4 and model has bad chemistry.
- Local Quality Estimate indicates model quality on a per residue basis and can indicate if there are sections of hte model that are problematic (such as the ends of the model in the report above)
- Model-Template alignment shows how well the template structure and the sequence align and what parts of the model were used. Blue colors means better alignment while red colors mean worse alignment and modeling. Secondary structure is also indicated with tubes for α-helix and arrows for β-sheet.
The grey Model button leads to a menu to download information.
Two key options:
- PDB format results in just the homology model, which can be viewed in Mol* or Chimera
- Model Report downloads a .zip with the PDB file model and an HTML based report of the model process including the statistics shown in Step 8.1.
Download both and upload both files to your project.
Name the PDB file:
[date]_[sequencename]_[team_name]_SWISS_model.pdb
```Replace  **[Group_name]**  with your name/group name without the brackets. Replace  **[sequence_name]**  with the name of the sequence.


Name the zip file:
[date][sequencename][team_name]_SWISS_data.zip
***THESE ARE YOUR DATA FILES FOR SWISS MODEL!***
Indicate your file location as a link within a note on this step.
The Structure Assessment button leads to a new page showing a basic geometric and chemical assessment of the model.
The Ramachandran plot indicates if the phi/psi angles are appropriate for a protein structure and is interactive. The Phi angle is the dihedral angle for the rotation of the N-Cα bond while the psi angle is for rotation around the Cα-C bond of the amino acid backbone. The ideal angles for helices, sheets, and coils shown in green areas below are known to minimize steric clashes between atoms.
Use the camera tool to record the Ramachandran plot and upload it to your project folder.
Name the image file:
[date]_[sequencename]_[team_name]_SWISS_phipsi
```Replace  **[Group_name]**  with your name/group name without the brackets. Replace  **[sequence_name]**  with the name of the sequence.  Add a note with the link to your file.


<img src="https://static.yanyin.tech/literature_test/protocol_io_true/protocols.io.byntpven/rama.png" alt="Ramachandran plot" loading="lazy" title="Ramachandran plot"/>
The Molprobity Results are numerical scores based on the model and indicate what percentage of amino acids that fall in the ideal geometry category and have minimal clashes. The check boxes allow for visualization of the bad amino acids and can be useful to see if there are general model problems or localized issues. Localized issues can be fixed, general problems cannot.
Record your Molprobity numbers.
| A | B | C |
|---|---|---|
| Deviant amino acids | ||
| Molprobity Score | ||
| Clash Score | ||
| Ramachandran favored | ||
| Ramachandran outliers | ||
| Rotamer outliers | ||
| C-beta deviations | ||
| Bad bonds | ||
| Bad angles |
Make sure you have recorded all the required data.
If you have completed the Phyre modeling. Save the record, export to PDF and upload this file to your project in the Notebook files.
Ligand identification using SWISS-Model
Clues to functionality can be gleaned from comparing unknown or predicted structures to with previously characterized structures of known function and characteristics. These scans can be biased against novel proteins or proteins with similar structures but distinct functions, but for initial guesses can be powerful. These methods align the structure and/or amino acid sequence to a database of structures with known ligand binding sites and look for structures with the similarity in amino acid composition, position, and over 3-D similarity. The idea being that similar structures lead to similar functions.
Return back to your SWISS-Model search and note any models with ligands present. This is noted in the far right column of the templates page.

Identify the ligand by clicking on the ligand name. Record ligands in the top few hits in the table below.
| A |
|---|
| Ligand name |
Click the Name of the template to see where the ligands bind to the protein.
Generally ligands are classified into nonfunctional binders, covalent, and non-covalent binders. The latter two categories are the most interesting. Hovering over the ligand name shows the molecule bound to the protein and left-clicking on the name zooms the structure to show the specifics of ligand binding, including the weak interactions between the amino acids and ligand.
Download the top two hits with ligands bound from the server and align it to your model in Mol*.
Observe if there is any match in the ligand/substrate binding sites between your model and the template structures with ligands bound.
Record the ligand name and possible interactions between your model and the ligand below.
| A | B | C |
|---|---|---|
| Ligand name | Source structure PDB ID | Interacting amino acids in the model structure (three letter code and amino acid number) |
Save this protocol as a PDF and upload it to your project folder.
