High-throughput identification of gut microbiome-dependent metabolites
Shuo Han, Emma R. Guiberson, Yuxin Li, Justin L. Sonnenburg

Extended
Extended Data Fig. 1 Example images of extracted ion chromatograms generated in the Agilent MassHunter Qualitative Data Analysis software.
a , Example of a single peak identified from extracting a chromatogram from a single m/z value. b , Example of multiple peaks identified from extracting a chromatogram based on a single m/z value. c , Example of no peak identified from extracting a chromatogram based on a single m/z value.
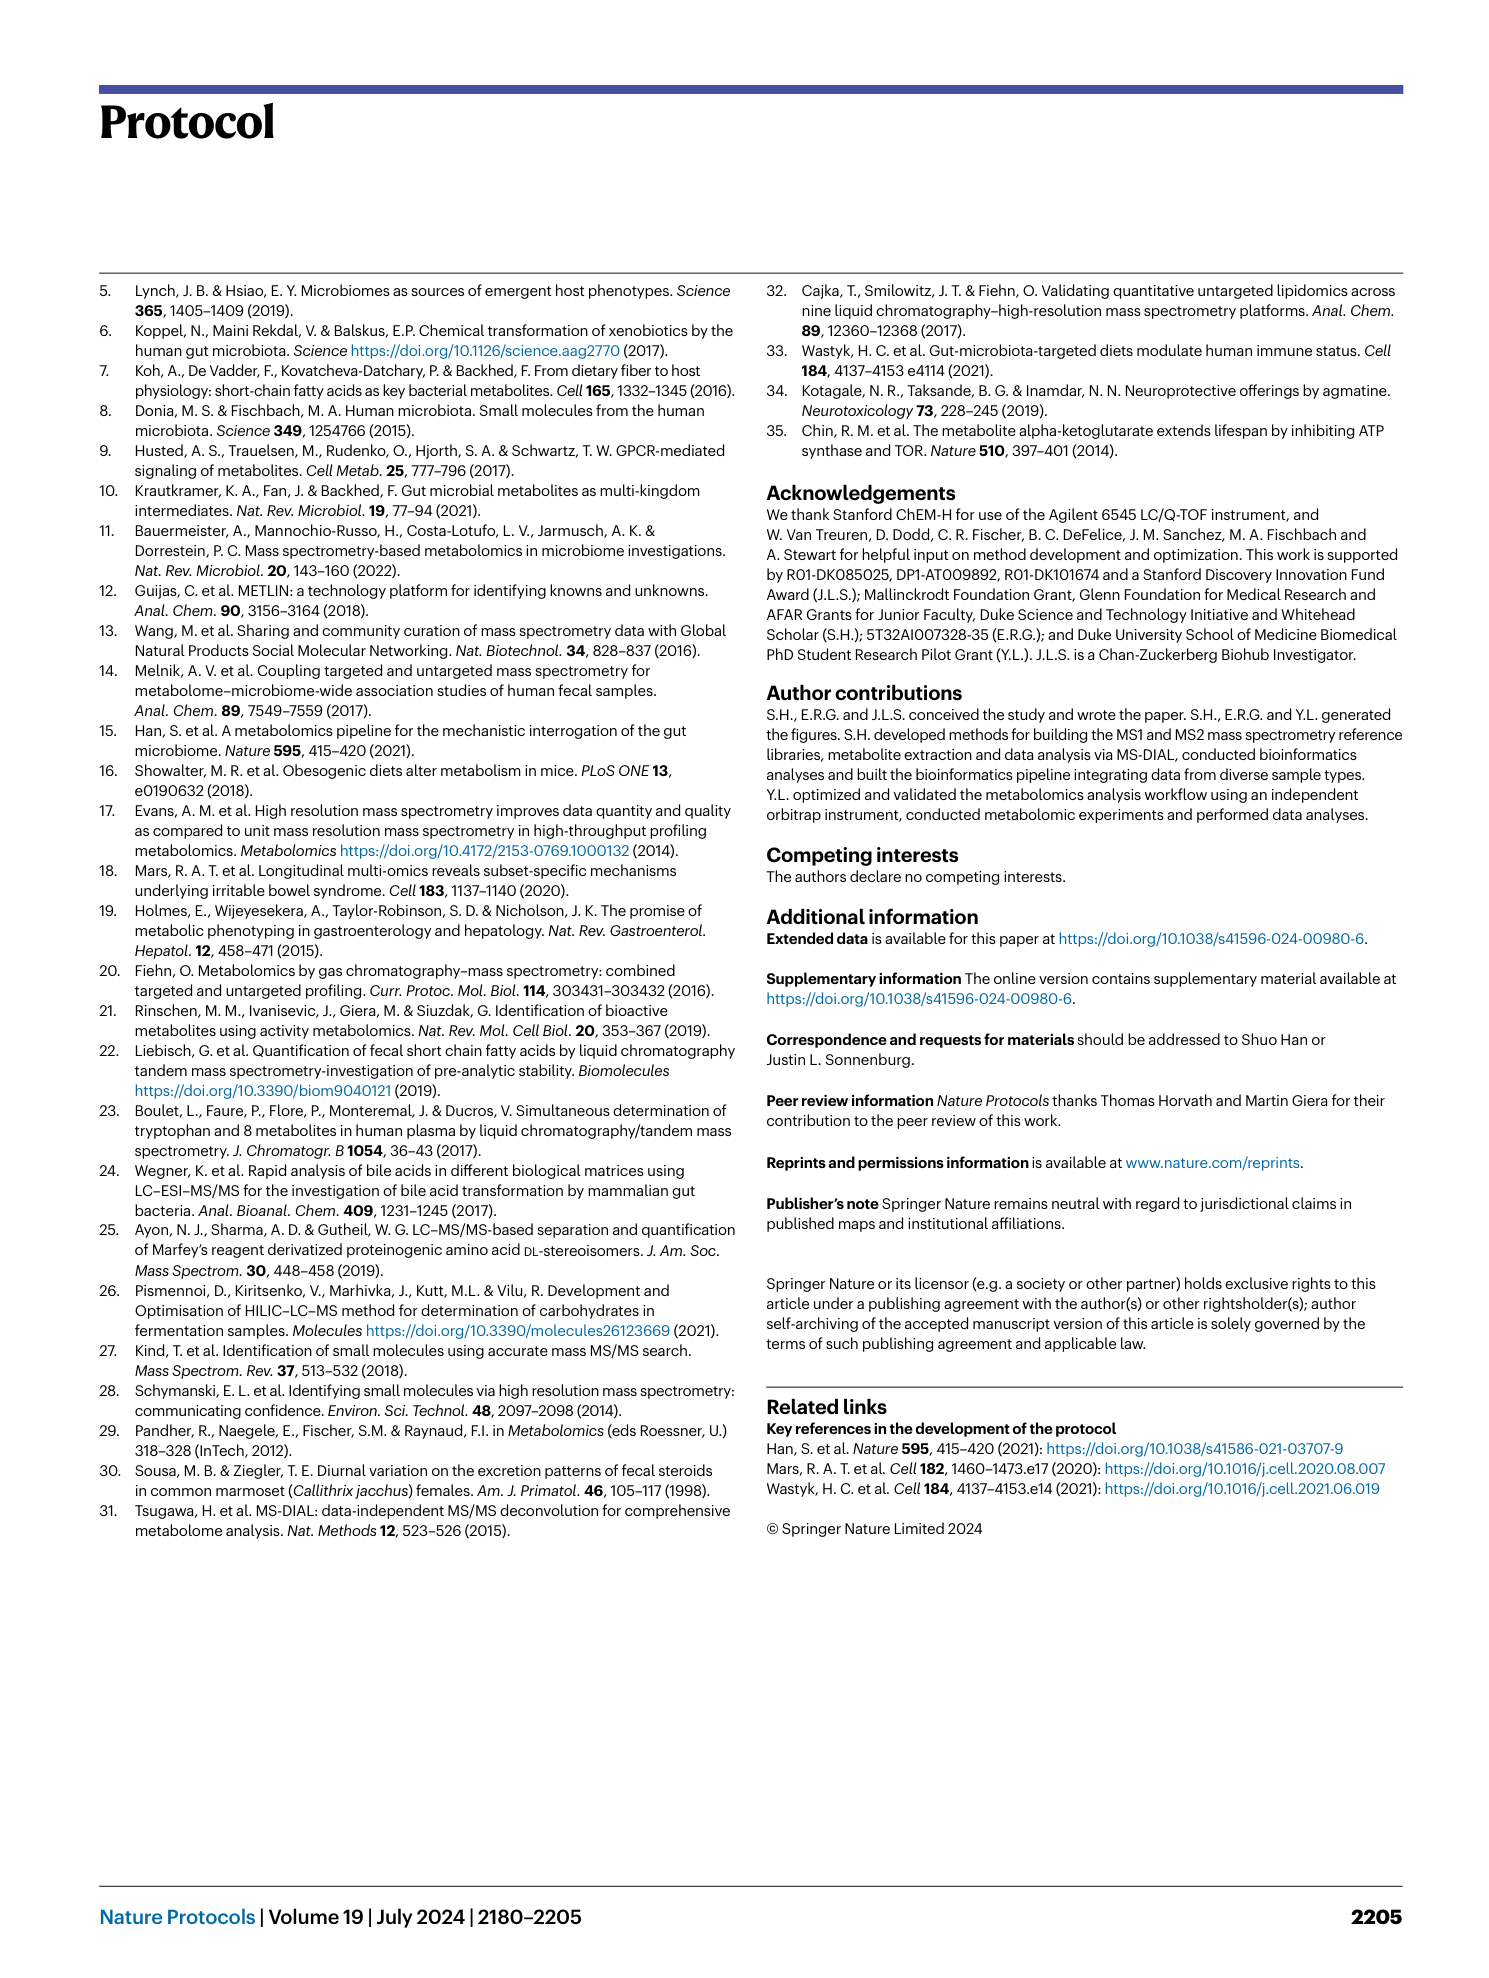
Extended Data Fig. 2 Pre- and post-filtering comparisons in peak areas.
Pairwise molecular feature comparisons before and after the mega media being passed through a 0.2 μm membrane filter. a , b , Two independent batches of mega media have been tested (n = 5 for each of pre- and post-filtered conditions for each batch) using the C18 positive method. 1882 unique molecular features are reported for both batches following the background noise elimination and peak quality checks. Linear regression and r 2 values of pairwise molecular feature comparisons, performed on log10 transformed peak area data: pre-filtered versus post-filtered in batch 1 (r 2 = 0.977, Post-filtered peak area = 1 × Pre-filtered peak area - 0.0109, a ) and batch 2 (r 2 = 0.994, Post-filtered peak area = 0.9974 × Pre-filtered peak area + 0.0206, b ).
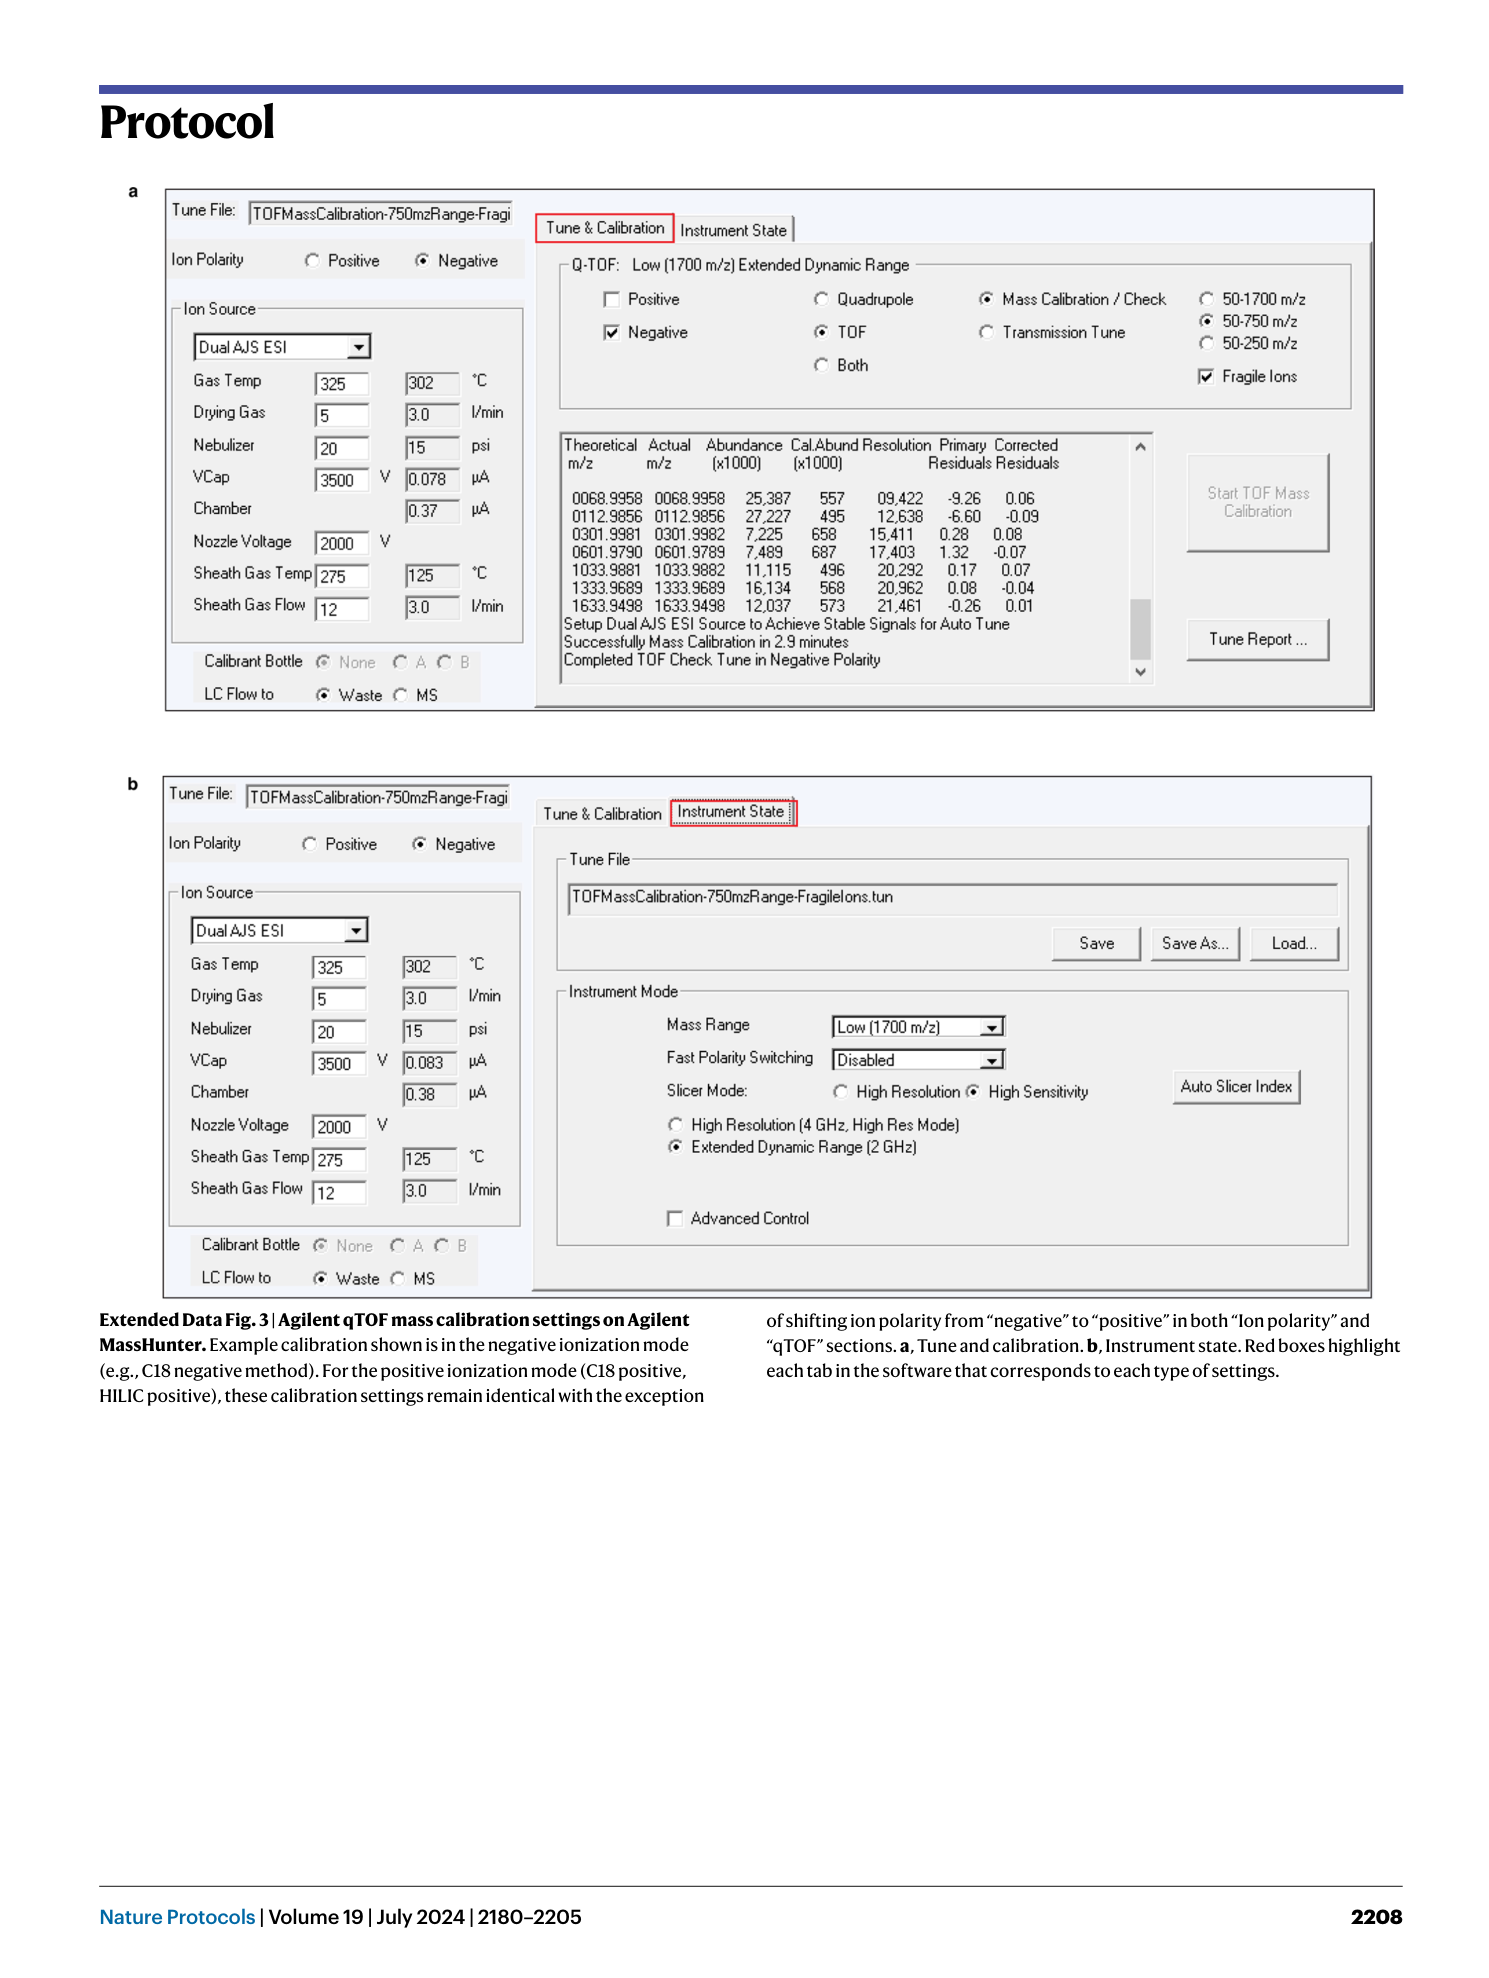
Extended Data Fig. 3 Agilent qTOF mass calibration settings on Agilent MassHunter.
Example calibration shown is in the negative ionization mode (e.g., C18 negative method). For the positive ionization mode (C18 positive, HILIC positive), these calibration settings remain identical with the exception of shifting ion polarity from “negative” to “positive” in both “Ion polarity” and “qTOF” sections. a , Tune and calibration. b , Instrument state. Red boxes highlight each tab in the software that corresponds to each type of settings.
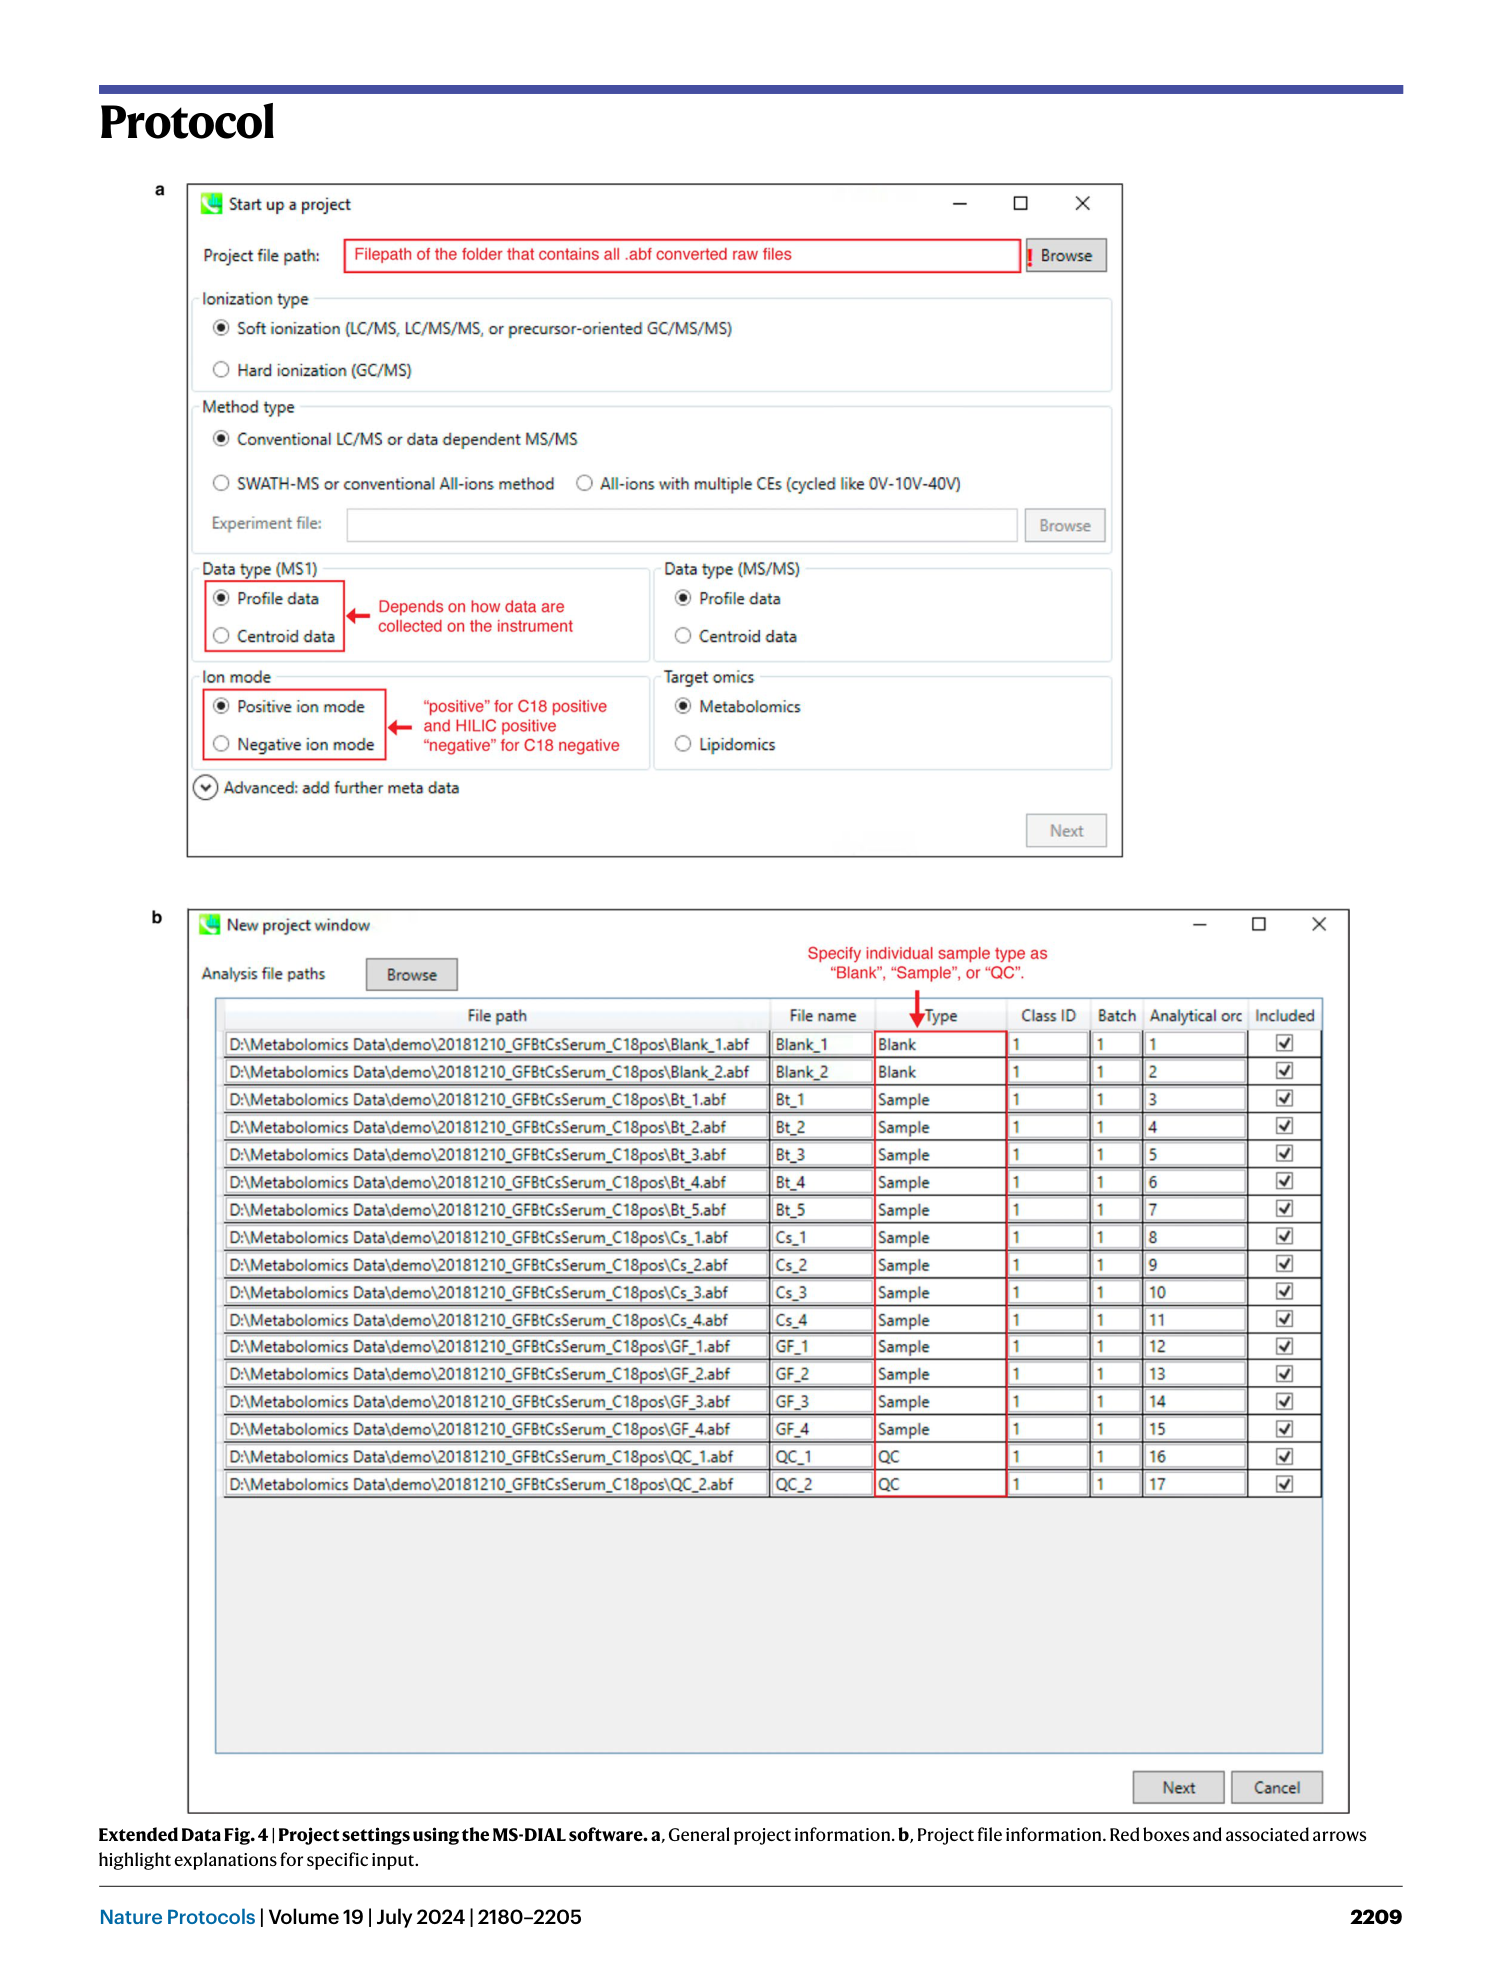
Extended Data Fig. 4 Project settings using the MS-DIAL software.
a , General project information. b , Project file information. Red boxes and associated arrows highlight explanations for specific input.
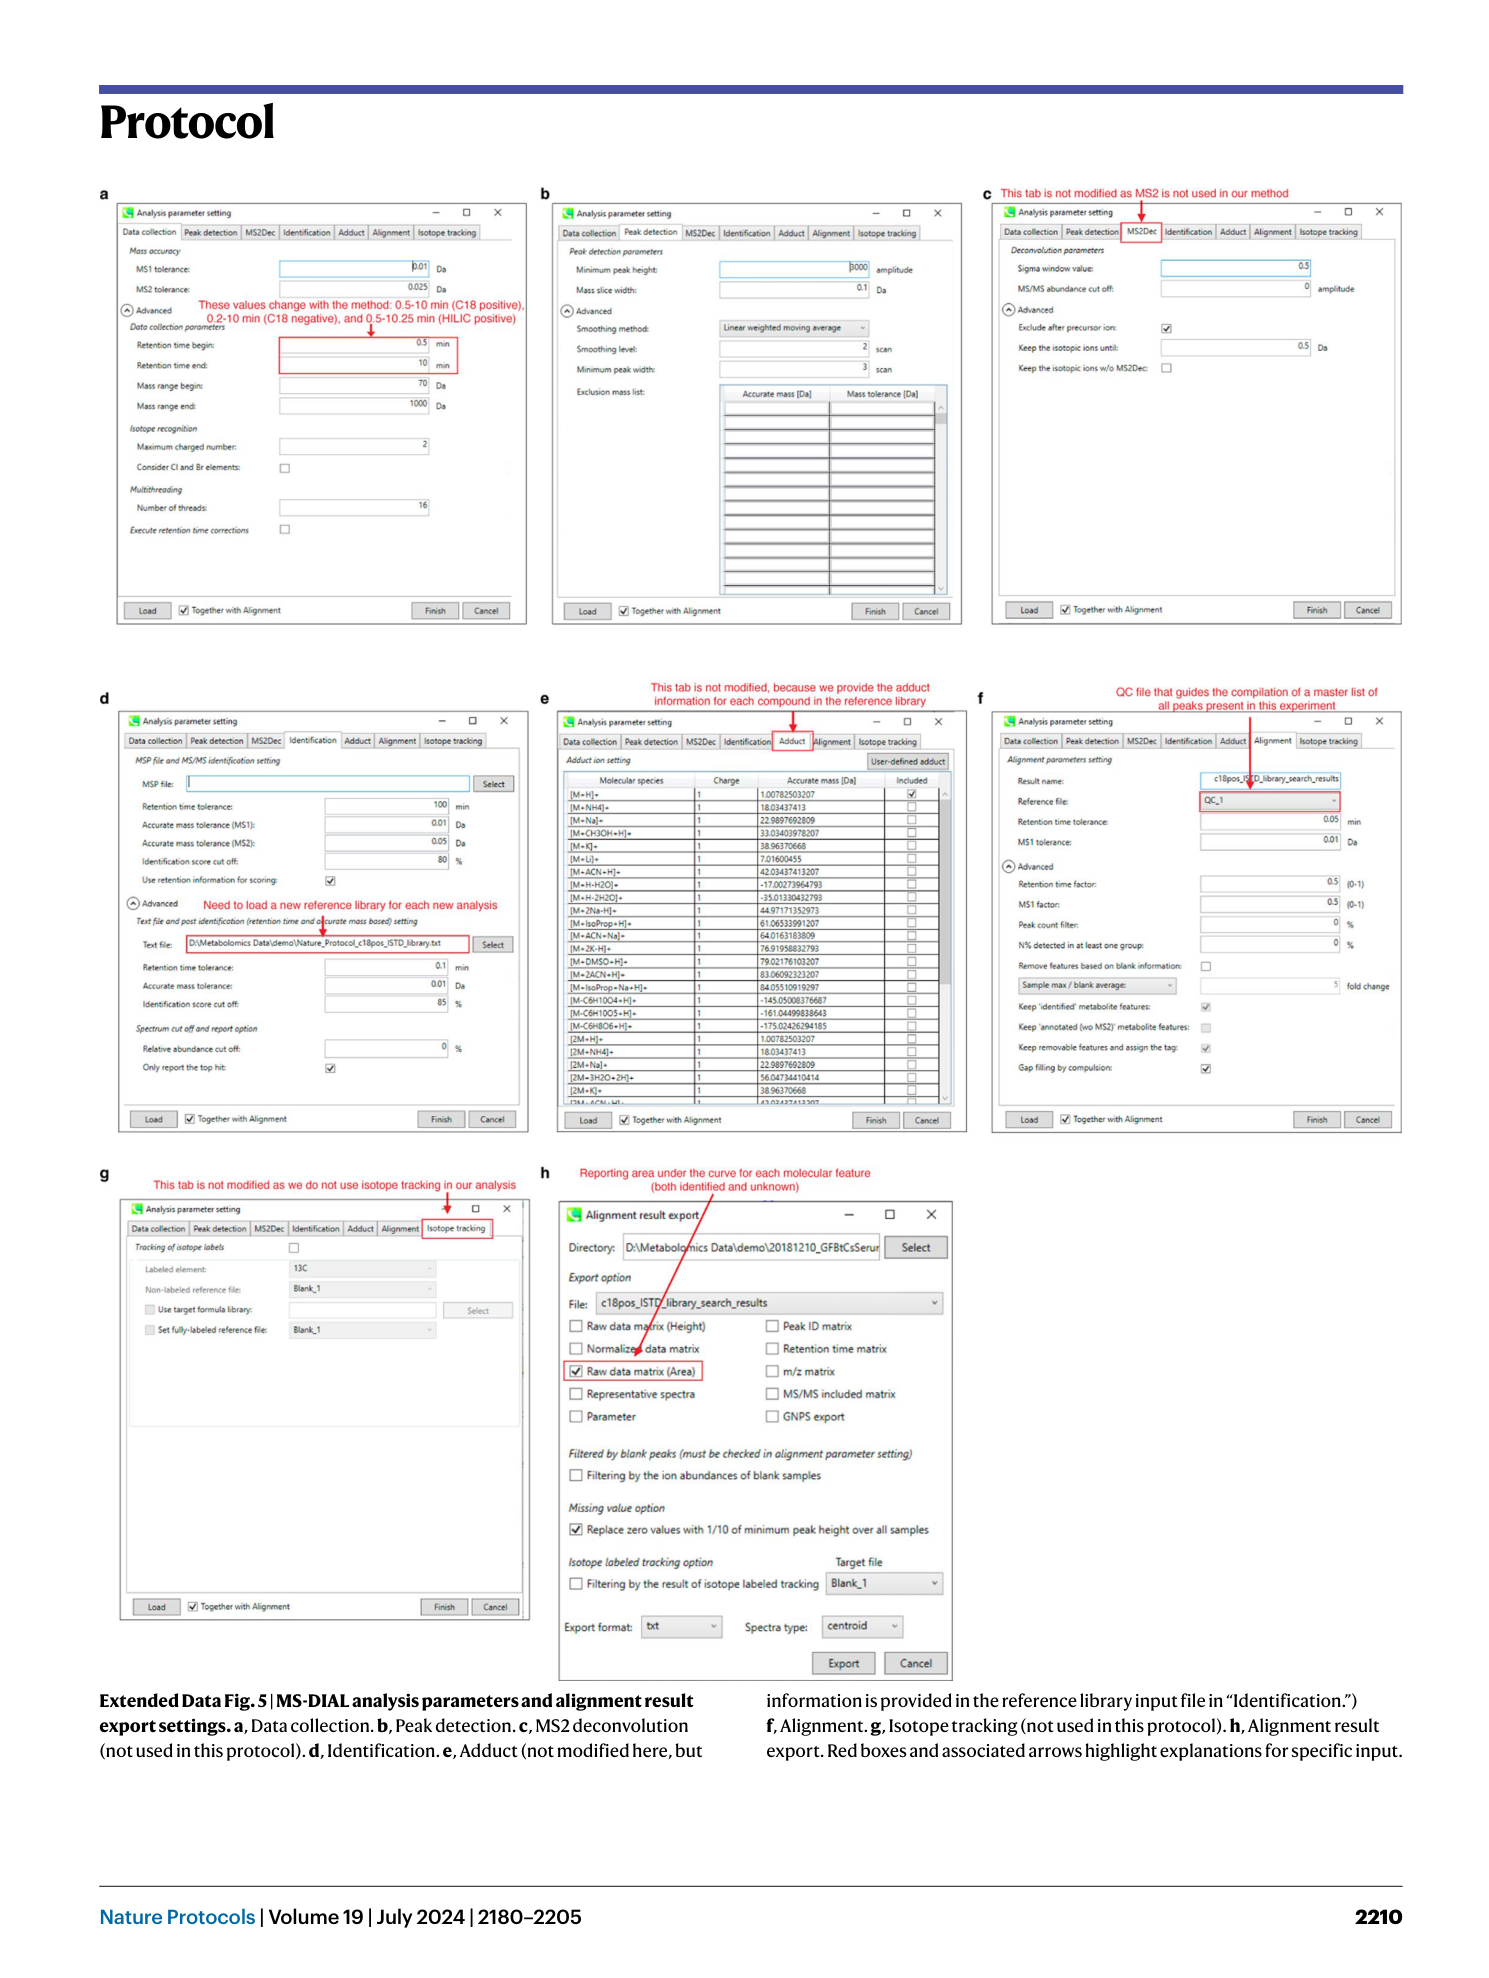
Extended Data Fig. 5 MS-DIAL analysis parameters and alignment result export settings.
a , Data collection. b , Peak detection. c , MS2 deconvolution (not used in this protocol). d , Identification. e , Adduct (not modified here, but information is provided in the reference library input file in “Identification.”) f , Alignment. g , Isotope tracking (not used in this protocol). h , Alignment result export. Red boxes and associated arrows highlight explanations for specific input.
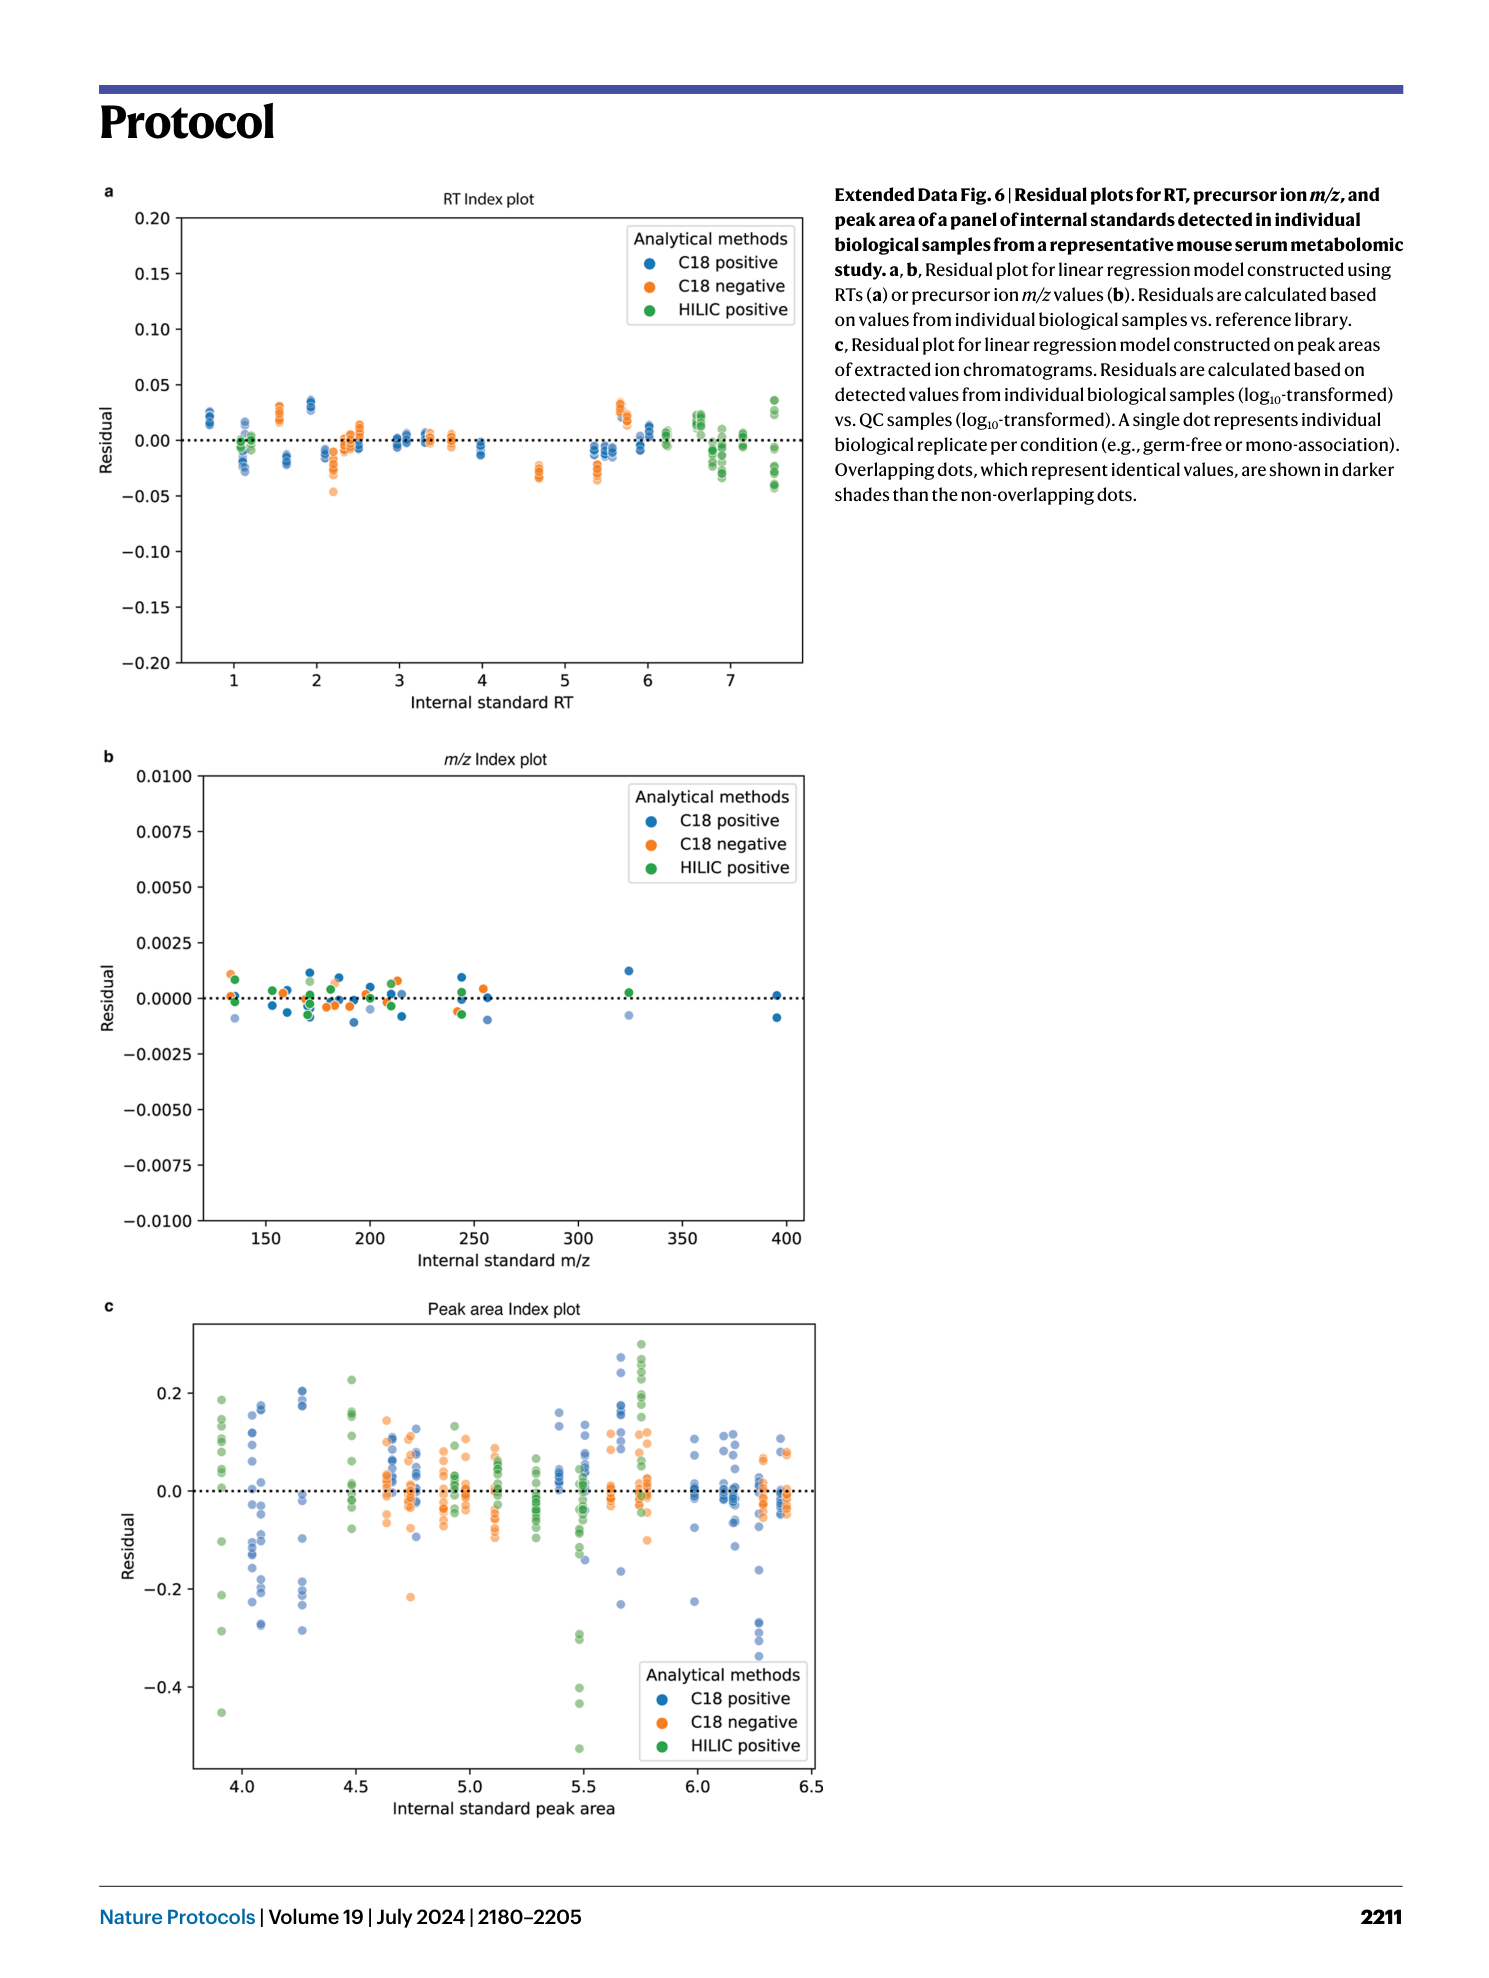
Extended Data Fig. 6 Residual plots for RT, precursor ion m/z , and peak area of a panel of internal standards detected in individual biological samples from a representative mouse serum metabolomic study.
a , b , Residual plot for linear regression model constructed using RTs ( a ) or precursor ion m/z values ( b ). Residuals are calculated based on values from individual biological samples vs. reference library. c , Residual plot for linear regression model constructed on peak areas of extracted ion chromatograms. Residuals are calculated based on detected values from individual biological samples (log 10 -transformed) vs. QC samples (log 10 -transformed). A single dot represents individual biological replicate per condition (e.g., germ-free or mono-association). Overlapping dots, which represent identical values, are shown in darker shades than the non-overlapping dots.
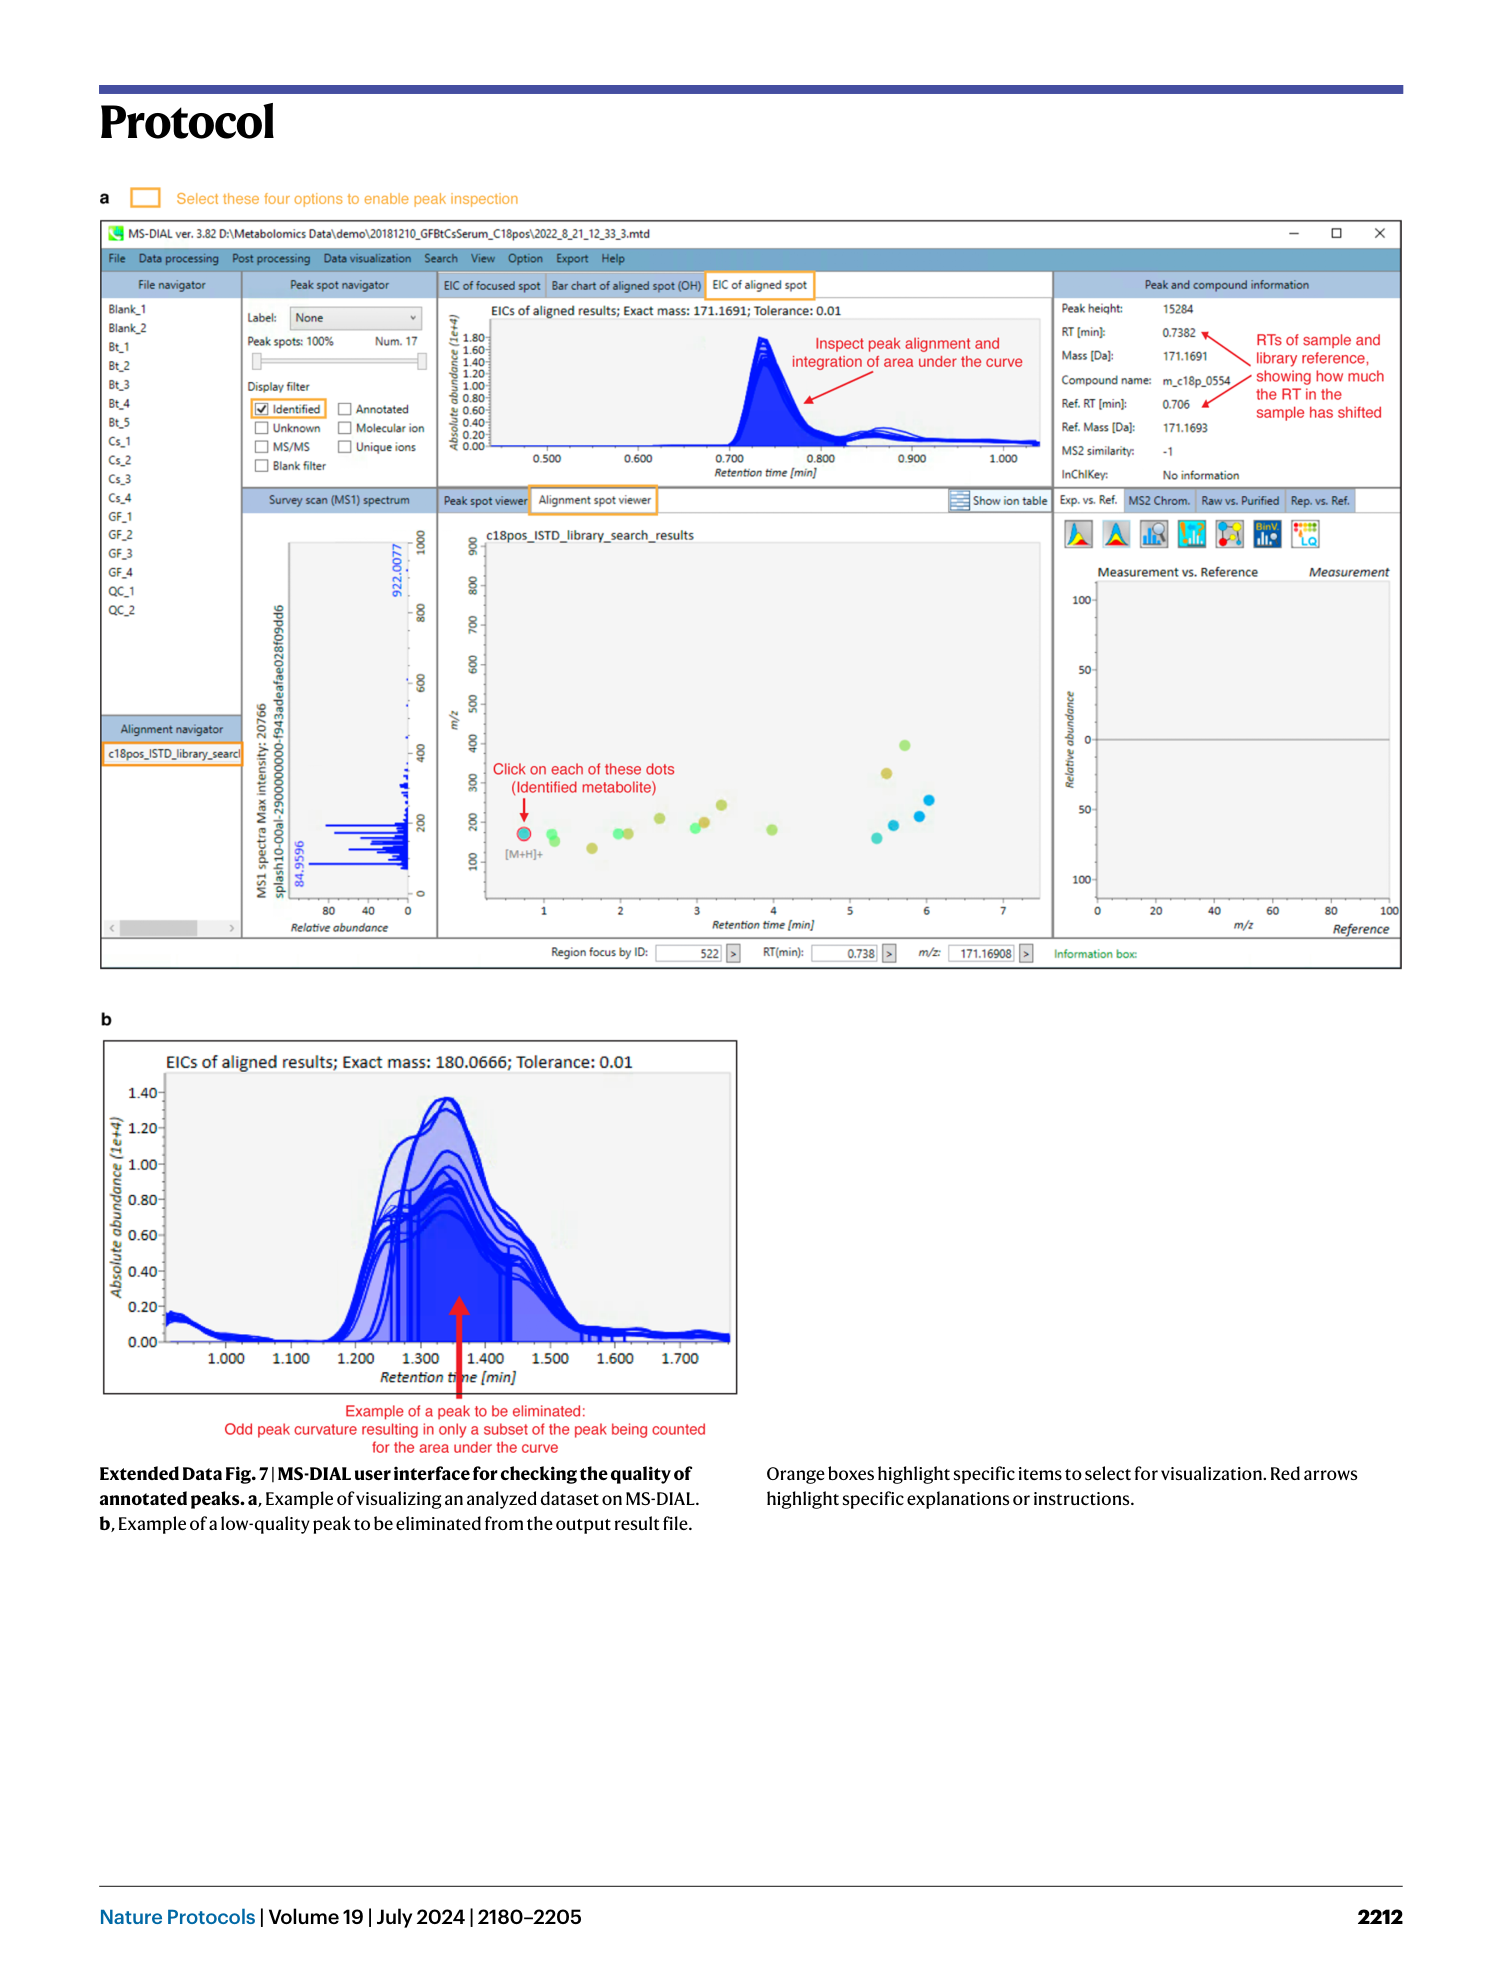
Extended Data Fig. 7 MS-DIAL user interface for checking the quality of annotated peaks.
a , Example of visualizing an analyzed dataset on MS-DIAL. b , Example of a low-quality peak to be eliminated from the output result file. Orange boxes highlight specific items to select for visualization. Red arrows highlight specific explanations or instructions.
Supplementary information
Supplementary Information
Supplementary guide for Supplementary Tables 1 and 2.
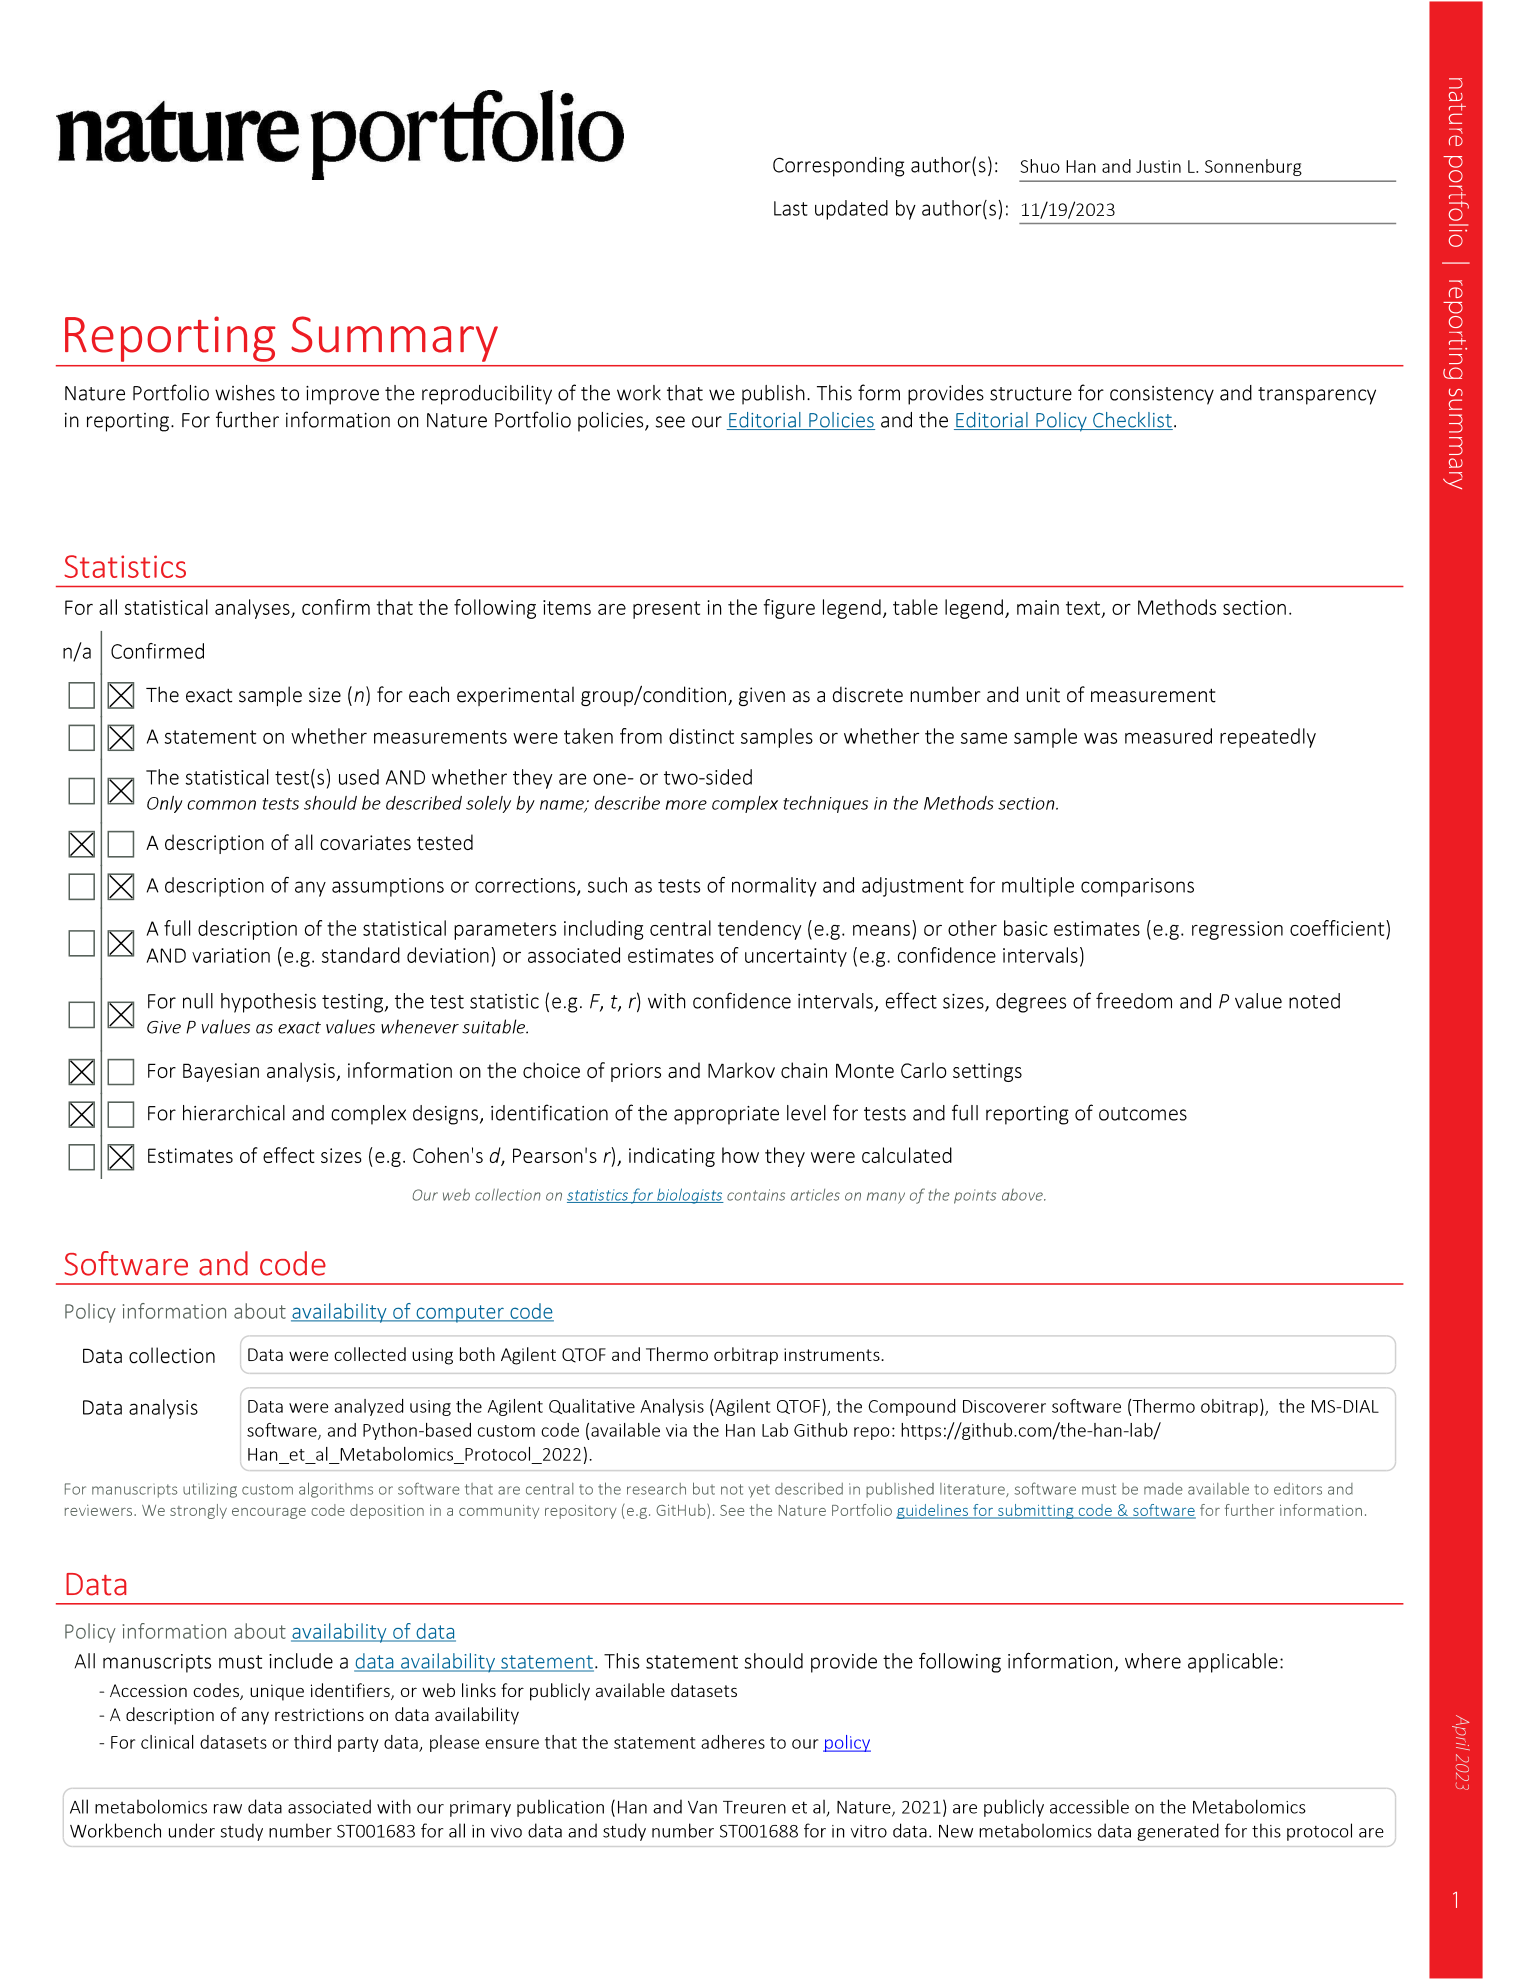
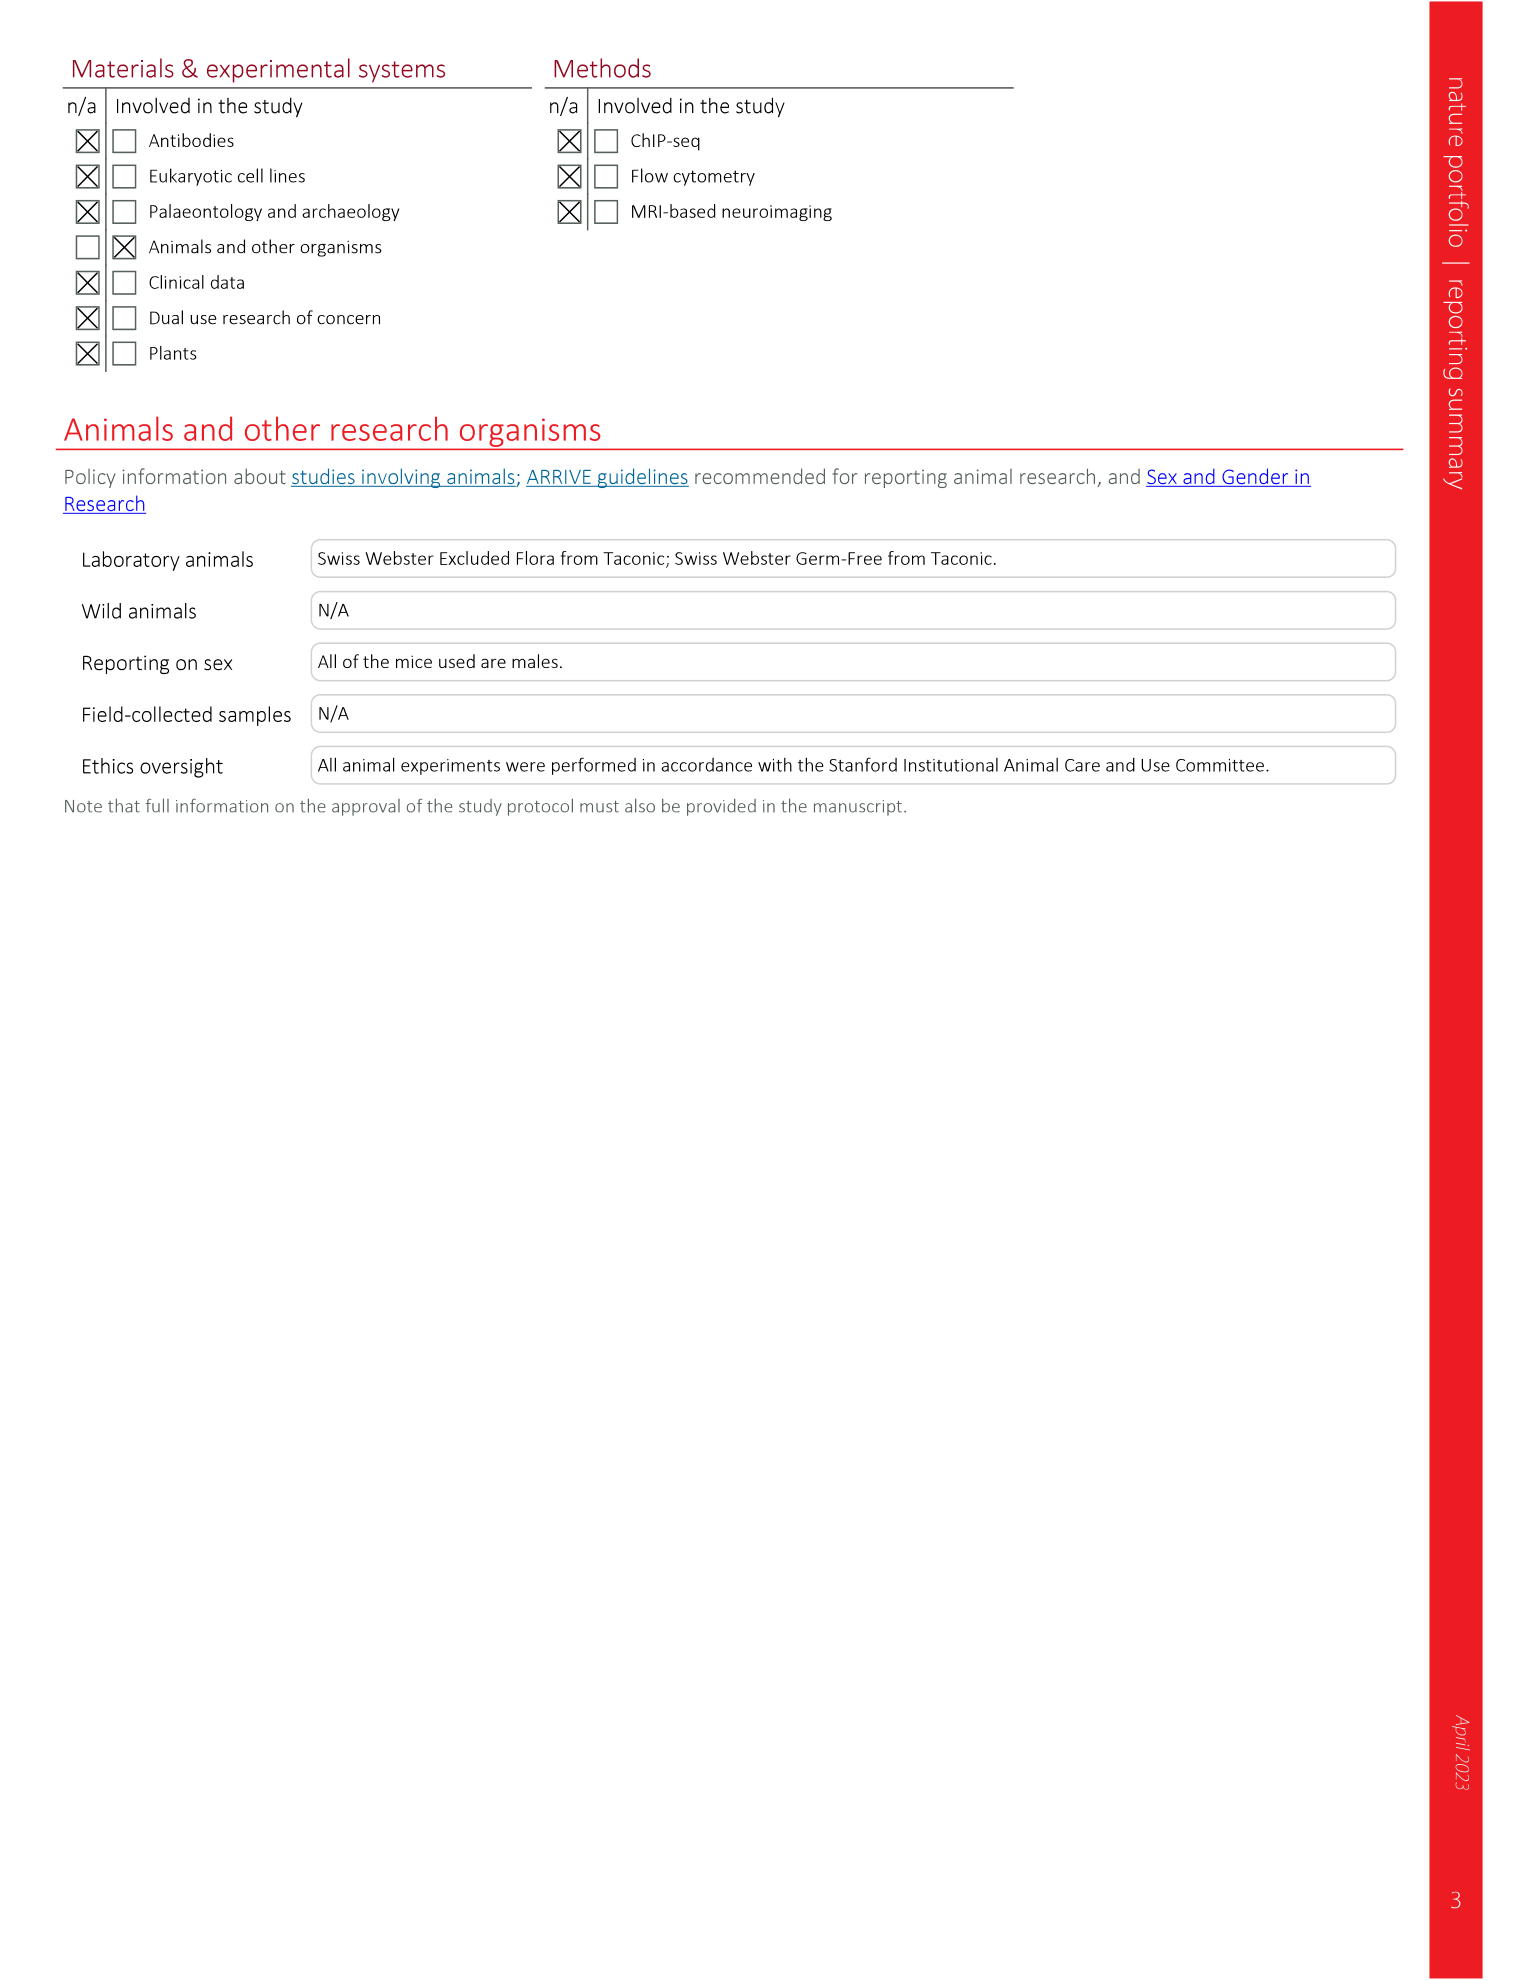
Reporting Summary
Supplementary Table 1
Bacterial metabolites.
Supplementary Table 2
Co-eluting metabolites.
