Detection of Small-Molecule Aggregation with High-Throughput Microplate Biophysical Methods
Samantha J. Allen, Samantha J. Allen, Corey M. Dower, Corey M. Dower, Annie X. Liu, Annie X. Liu, Kevin J. Lumb, Kevin J. Lumb
aggregation
critical aggregation concentration
dynamic light scattering
high-throughput screening
resonant waveguide grating
Abstract
Small-molecule drug discovery can be hindered by the formation of aggregates that act as non-selective inhibitors of drug targets. Such aggregates appear as false positives in high-throughput screening campaigns and can bedevil structure-activity relationships during compound optimization. Protocols are described for resonant waveguide grating (RWG) and dynamic light scattering (DLS) as microplate-based high-throughput approaches to identify compound aggregation. Resonant waveguide grating and dynamic light scattering give equivalent results for the compound test set, as assessed with Bland-Altman analysis. © 2019 The Authors.
Basic Protocol 1 : Resonant waveguide grating (RWG) in 384-well or 1536-well plate format to detect compound aggregation
Basic Protocol 2 : Dynamic light scattering (DLS) in 384-well plate format to detect compound aggregation
INTRODUCTION
High-throughput screening (HTS) is a mainstay of small-molecule tool identification and drug discovery in both the pharmaceutical industry and the growing number of academic drug discovery centers. Compound collections of 105 to 106 molecules are typically tested in an HTS campaign to arrive at up to 104 compounds that appear to modulate the activity of the drug target. However, many of these “hits” are false positives and need to be identified as such to avoid pursuing artifactual molecules as opposed to bona fide drug discovery starting points (see Current Protocols article: Thorne, Auld, & Inglese, 2010). One common source of false positives is the aggregation of small molecules to colloidal assemblies that may modulate the activity of a target by sequestering it as opposed to binding at a specific site on the target (Ganesh, Donders, Schoichet, & Shoichet, 2018; Shoichet, 2006). Aggregation has been reported to occur for 95% of primary hits from HTS campaigns (Babaoglu et al., 2008; Feng et al., 2007; Jadhav et al., 2010). Aggregation can also lead to apparent structure-activity relationships that are unrelated to direct stoichiometric inhibition of the target protein (Ferreira et al., 2009). While originally reported in the context of enzyme inhibitors, aggregators may also appear as enzyme activators or GPCR antagonists (Goode, Totten, Heeres, & Hergenrother, 2008; Sassano et al., 2013).
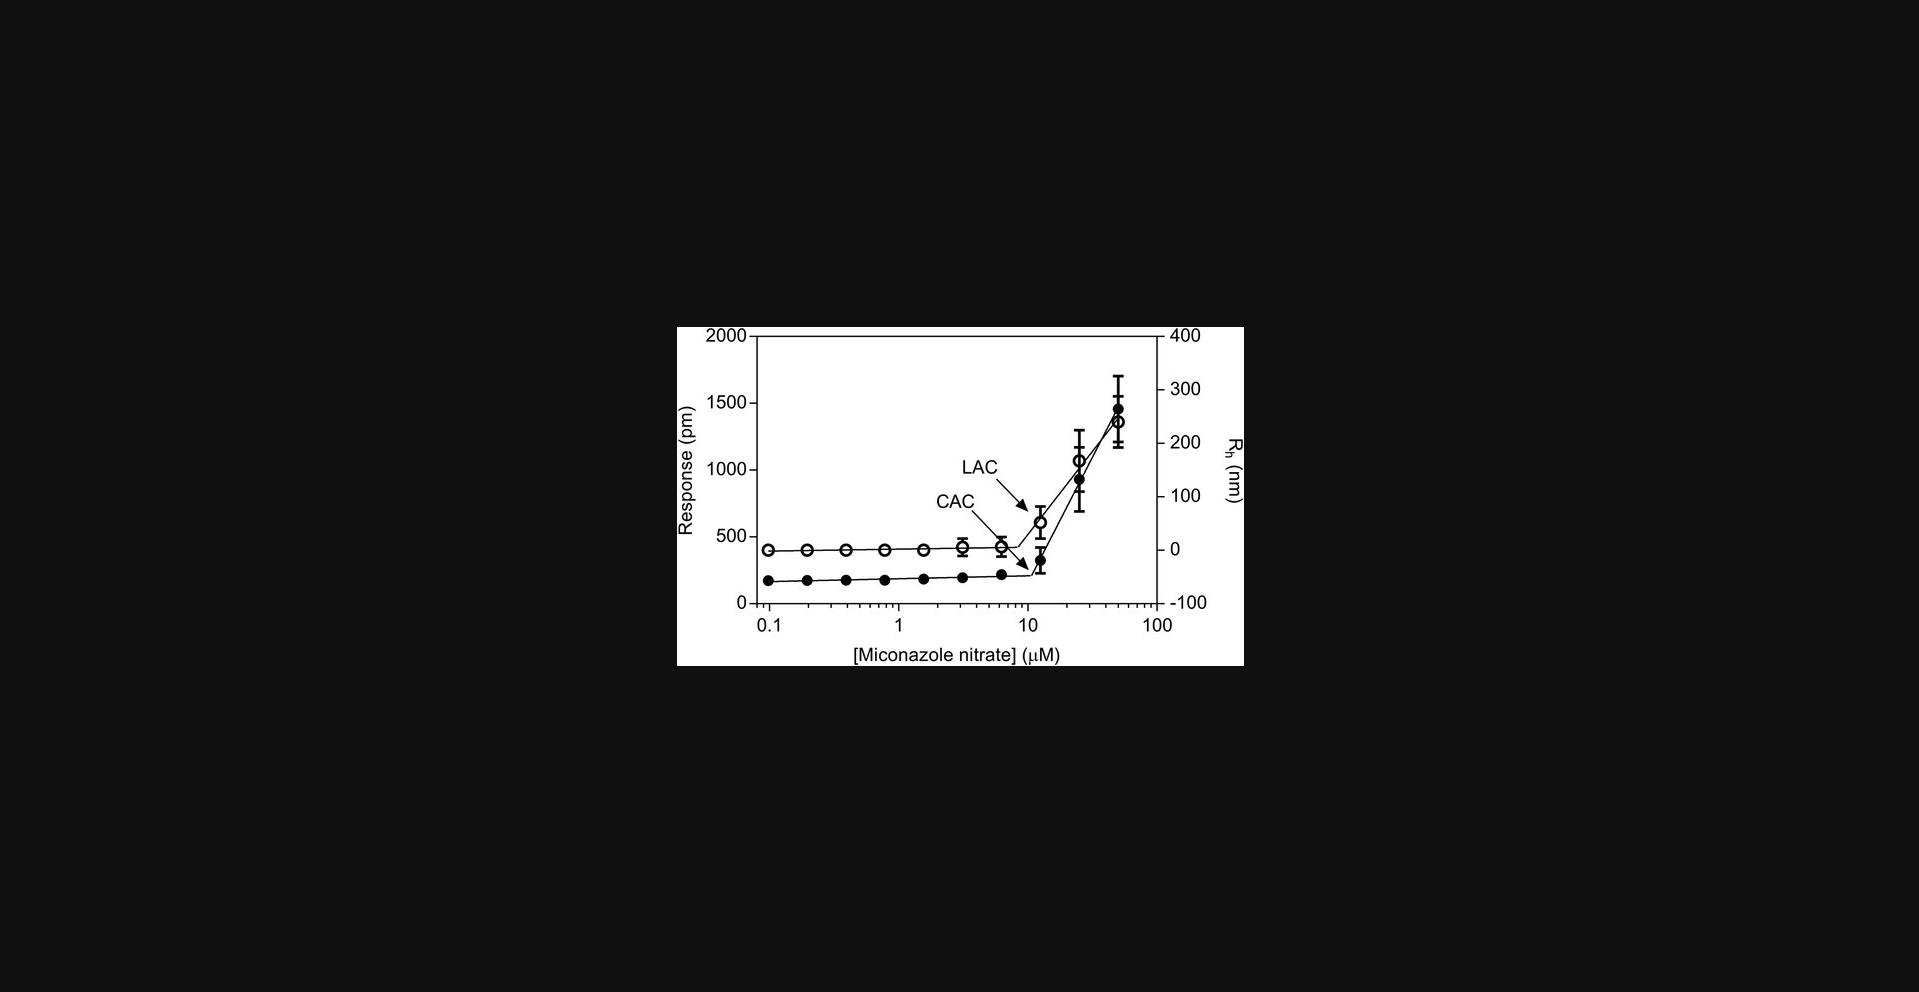
Small-molecule aggregation is the self-assembly of multiple molecules into a new structure that may be either homogenous or heterogenous in size and may be soluble or form a precipitate. Aggregates can be over 1 billion Daltons in mass. Aggregation is dependent on concentration, and the transition from unaggregated to aggregated compound occurs at a concentration called the critical aggregation concentration (CAC; Coan & Shoichet, 2008). The process can be described in terms of a pre-aggregation region with little to no formation of aggregated compound until the CAC is reached, at which point there is a distinct increase in the extent of aggregation (Fig. 1). It is important to note that aggregation is dependent on context (concentration, pH, buffer, detergent). For instance, all of the compounds in Table 1 are approved drugs that aggregate in some conditions at some concentration. In addition, compounds can exhibit specific binding and inhibition below the CAC.
| Compound | RWG CAC (μM) | DLS LAC (μM) | DLS Rh (50 μM) (nm) |
|---|---|---|---|
| Clotrimazole | 12 ± 1 | 10 ± 4 | 153 ± 54 |
| Econazole | 14 ± 1 | 42 ± 14 | —a |
| Ketoconazole | 1.8 ± 0.3 | 9.4 ± 5.4 | —a |
| Miconazole nitrate | 10 ± 1 | 13 ± 6.4 | 240 ± 48 |
| Nicardipine | 7.4 ± 0.5 | 42 ± 14 | 84 ± 48 |
- a Rh values at 50 µM could not be determined for econazole and ketoconazole due to data heterogeneity and the presence of extremely large particles.
High-throughput methods to identify aggregation are necessary in the earliest stages of hit evaluation to de-risk early drug discovery. Enzymatic assays that follow changes in apparent compound activity in the presence of detergents (Feng & Shoichet, 2006; McGovern, Helfand, Feng, & Shoichet, 2003; Ryan, Gray, Lowe, & Chung, 2003) or changes in enzyme concentration (Habig et al., 2009; McGovern, Caselli, Grigorieff, & Shoichet, 2002) provide an indirect approach, dependent on certain assumptions, to infer but not directly detect the presence of compound interference by aggregation. Direct observation of aggregate formation is provided by the biophysical methods of resonant waveguide grating (RWG; Blevitt et al., 2017; Chan et al., 2009) and by dynamic light scattering (DLS; Coan & Shoichet, 2008; Coan, Maltby, Burlingame, & Shoichet, 2009; Irwin et al., 2015; McGovern et al., 2003; Pohjala & Tammela, 2012; Seidler, McGovern, Doman, & Shoichet, 2003). Here we present high-throughput microplate-based RWG and DLS protocols for monitoring small-molecule aggregation.
Basic Protocol 1: RESONANT WAVEGUIDE GRATING (RWG) IN 384-WELL OR 1536-WELL PLATE FORMATS TO DETECT COMPOUND AGGREGATION
RWG is a label-free biophysical technique that detects the change in wavelength of reflected light due to an event within 200 nm of the surface of the detector. For aggregation, this event would presumably be the formation of aggregates that interact with the microplate well at the surface of the biosensor plate.
Materials
-
Buffer (see Critical Parameters)
-
Test compounds and controls
-
Dimethylsulfoxide (DMSO; e.g., EMD Millipore MX1457)
-
Resonant waveguide grating optical biosensor instrument [e.g., Corning Epic BT or Perkin Elmer EnSpire (discontinued)]
-
Assay plate, optical biosensor, 384-well with lid (Corning 5040) or 1536-well with lid (Corning 5090)
-
Filter, 0.22-µm, 250-ml (e.g., Corning 430756)
-
Multichannel pipette (e.g., ThermoFisher Scientific E1-ClipTip)
-
Pipette tips (e.g., ThermoFisher 94410150; ClipTip 384)
-
Reagent reservoir, 25-ml (e.g., VistaLab 3054-1005)
-
Microplate centrifuge (e.g., ThermoFisher Scientific Heraeus Multifuge X3 with TX-1000 rotor)
-
Source plate, Echo-compatible, 384-well, polypropylene (e.g., Labcyte P-05525)
-
Linear regression software such as Prism (GraphPad Software) or KaleidaGraph (Synergy Software)
-
Spreadsheet software such as Excel (Microsoft Corporation)
-
Optional : Acoustic dispenser (e.g., Labcyte Echo or Biosystems ATS)
-
Optional : Liquid dispenser (e.g., Thermo Scientific Multidrop Combi or Formulatrix Tempest)
Data collection
1.Turn on the RWG instrument 60 min prior to use.
2.Dispense 30 µl of filtered buffer into each well of a 384-well assay plate.
3.Centrifuge plate for 3 min at 336 × g (1200 rpm in a TX-1000 rotor), 20°C.
4.Incubate plate at room temperature for 120 min in the RWG instrument.
5.Read buffer baseline.
6.Remove the plate from the instrument.
7.Prepare compounds at a concentration of 10 mM in DMSO (e.g., EMD Millipore MX1457). Add 30 μl DMSO to columns 2-11 and 14-23 of a 384-well source plate. Add 60 μl of 10 mM stock compound to columns 1 and 13 and mix. Transfer 30 μl from column 1 to column 2.Repeat the transfer to the next column across the plate to column 11 to obtain an eleven-point, two-fold serial dilution of the compound. Repeat for columns 13-23.Place 30 μl DMSO in each well of columns 12 and 24 as negative controls. At least one eleven-point two-fold dilution should be of a positive control such as miconazole nitrate (e.g., Tocris 301, ≥99% purity by HPLC). This step can be performed at any stage, often prior to step 1.
8.Centrifuge compound source plate for 5 min at 2103 × g (3000 rpm in a TX-1000 rotor), 20°C.
9.Dispense 300 nl from the source plate (step 7) to the 384-well assay plate replicating the source plate layout [final DMSO concentration of 1% (v/v)].
10.Centrifuge plate for 3 min at 336 × g (1200 rpm in a TX-1000 rotor), 20°C.
11.Incubate plate for 60 min at 20°C in the RWG instrument.
12.Read plate using the same settings as in step 5.
13.Remove plate.
Data analysis with linear regression
14.Inspect the data. For an aggregating molecule, a shallow linear change in wavelength shift is expected below the CAC and a steeper linear change in wavelength shift is expected above the CAC (Fig. 1). For a non-aggregating molecule, either no change or a shallow increase of less than 200 to 400 pm is expected for compounds in buffers containing 1% (v/v) DMSO.
15.Fit the data below the CAC to a straight line (y 1 = m 1x + c 1) and fit the data above the CAC to a second straight line (y 2 = m 2x + c 2). The CAC is the concentration at which the two lines intersect and is calculated using the equation (c 2 − c 1)/(m 1 − m 2).
Data analysis based on DMSO response
16.Calculate the mean response plus six times the standard deviation for the control wells containing buffer and 1% (v/v) DMSO. This value is used as a threshold to determine if and at what concentration a compound is aggregating. Aggregating compounds will have a response greater than the threshold at one or more concentrations, whereas non-aggregating compounds will have a response less than the threshold at the tested concentrations. For an aggregating compound, the lowest tested concentration at which the threshold is crossed can be considered an estimate of the CAC.
Basic Protocol 2: DYNAMIC LIGHT SCATTERING (DLS) IN 384-WELL PLATE FORMAT TO DETECT COMPOUND AGGREGATION
DLS measures the fast (nanosecond) fluctuations of scattered light intensity by particles in solution as they diffuse due to Brownian motion, and determines the translational diffusion coefficient. The translational diffusion coefficient can be used to calculate the particle hydrodynamic radius (R h) and size using equations derived from the first principles of classical physics (Stetefeld, McKenna, & Patel, 2016).
Materials
-
Ethanol
-
Nitrogen (N2) source
-
Test compounds and controls
-
Dimethylsulfoxide (DMSO; e.g., EMD Millipore MX1457)
-
Assay buffer (see Critical Parameters)
-
Dynamic light scattering (DLS) instrument (e.g., Wyatt DynaPro Plate Reader II, Wyatt DynaPro NanoStar, or Malvern Panalytical Zetasizer)
-
Assay plate, 384-well, low-volume, non-treated, black with clear bottom (e.g., Corning 3540)
-
Flashlight
-
Microplate centrifuge (e.g., ThermoFisher Scientific Heraeus Multifuge X3 with TX-1000 rotor)
-
Multichannel pipette (e.g., ThermoFisher Scientific E1-ClipTip)
-
Pipette tips, ClipTip 384 (e.g., ThermoFisher 94410150)
-
Reagent reservoir, 25-ml (e.g., VistaLab 3054-1005)
-
Source plate, Echo-compatible, 384-well, polypropylene (e.g., Labcyte P-05525)
-
Optional : Acoustic dispenser (e.g., Labcyte Echo or Biosystems ATS)
-
Optional : Liquid dispenser (e.g., Thermo Scientific Multidrop Combi or Formulatrix Tempest)
-
Spreadsheet software such as Excel 2016 (Microsoft Corporation)
-
DLS analysis software such as Dynamics version 7.8 (Wyatt Technology Corporation)
-
Optional : Linear regression software such as Prism (GraphPad Software) or KaleidaGraph (Synergy Software)
Data collection
1.Turn on DLS instrument at least 30 min prior to use and set temperature to 25°C.
2.Clean bench with ethanol to remove dust particles.
3.Place plate cover supplied with the assay plates on the bottom of a 384-well plate. In a fume hood, illuminate the plate with a flashlight and tilt plate to spot large dust particles. Remove any dust particles with 10-s bursts of N2.
4.Centrifuge compound stock solutions for 10 min at 14,000 × g (e.g., 12,000 rpm in a F45-24-11 rotor), 20°C.
5.Dispense 30 µl of assay buffer into specified wells.
6.Centrifuge the plate for 5 min at 583 × g (e.g., 1500 rpm in a TX-1000 rotor), 20°C.
7.Prepare compounds at a concentration of 10 mM and dissolved in DMSO. Add 30 μl DMSO to columns 2-11 and 14-23 of a 384-well source plate. Add 60 μl of 10 mM stock compound to columns 1 and 13 and mix. Transfer 30 μl from column 1 to column 2.Repeat the transfer to the next column across the plate to column 11 to obtain an eleven-point, two-fold serial dilution of the compound. Repeat for columns 13-23.Place 30 μl DMSO in each well of columns 12 and 24 as negative controls. At least one eleven-point two-fold dilution should be of a positive control such as miconazole nitrate (e.g., Tocris 301, ≥99% purity by HPLC). This step can be performed at any stage, often prior to step 1.
8.Centrifuge compound source plate for 5 min at 2103 × g (e.g., 3000 rpm in a TX-1000 rotor), 20°C.
9.Dispense 300 nl of test substance from the source plate (step 7) into specified wells of the 384-well assay plate. Add 30 μl of buffer [final DMSO concentration of 1% (v/v)]. Place DMSO in each well of columns 12 and 24 and eleven-point two-fold dilutions of test compounds in wells 1-11 and 13-23 of each row.
10.Centrifuge plate for 3 min at 583 × g (e.g., 1500 rpm in a TX-1000 rotor), 20°C.
11.Check the bottom of the assay plate for particles, and spray with 10-s bursts of nitrogen to remove particles on the bottom of the assay plate if necessary.
12.Place assay plate in DLS instrument for at least 15 min to allow plate to equilibrate to 25°C.
13.Collect DLS data. Example parameters for a DynaPro Plate Reader II:
- Number of times to measure each well: 1
- Number of times to scan the selected regions: 1
- Enable Auto-attenuation: Yes
- Acquire an image of each well: Yes
- Number of DLS acquisitions: 10
- Temperature: 25°C
- DLS Acquisition Time: 3 to 5 s.
The DLS acquisition time may be increased for large particles to ensure the signal decays to baseline during the acquisition time.
14.Remove plate.
Data analysis
15.Open data in DLS software.
16.Set cutoffs for data analysis between 1.5 µs and 1 s.
17.Add data filter in the summary table to mask acquisitions with an autocorrelation intensity outside of the baseline limit of 1 ± 0.02.
18.Mask acquisitions with no measured particles.
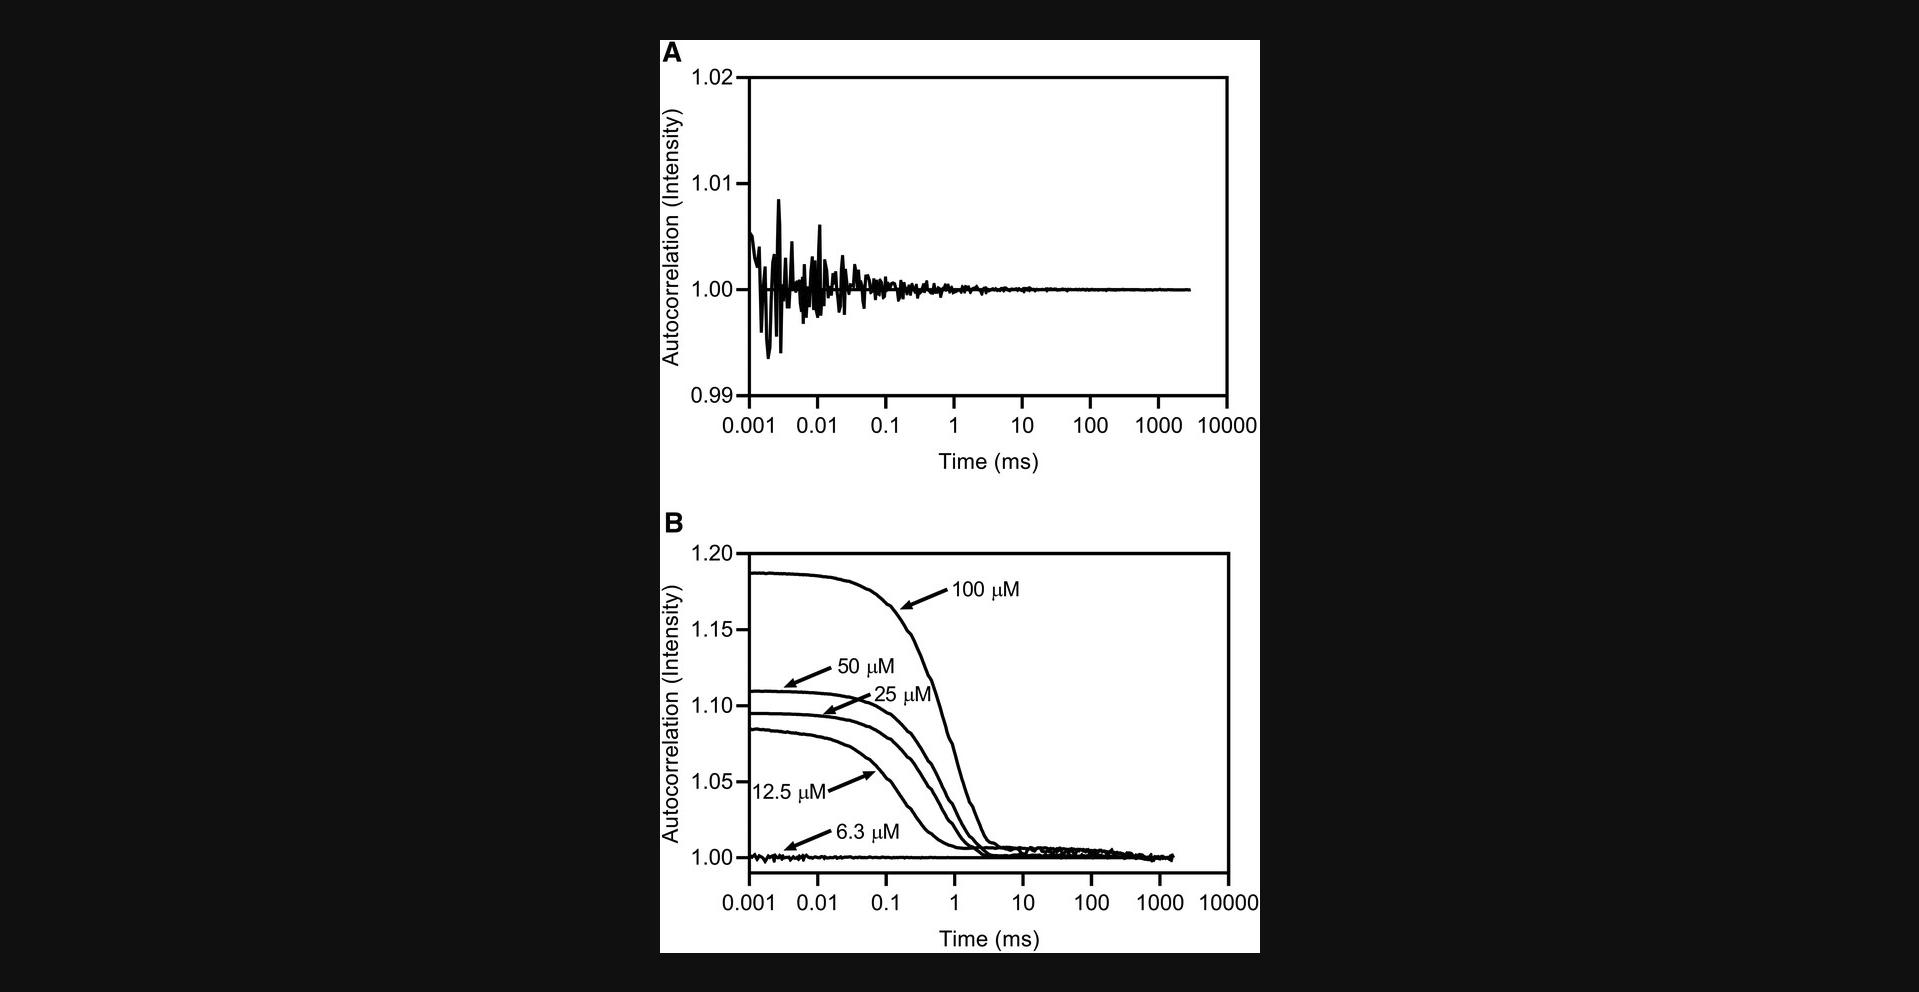
19.Inspect the acquisitions for the DMSO/buffer and buffer-only control wells. Calculate the percentage of acquisitions with no measured particles. The autocorrelation function should center on a value of 1 and exhibit noise around the baseline (Fig. 5A).
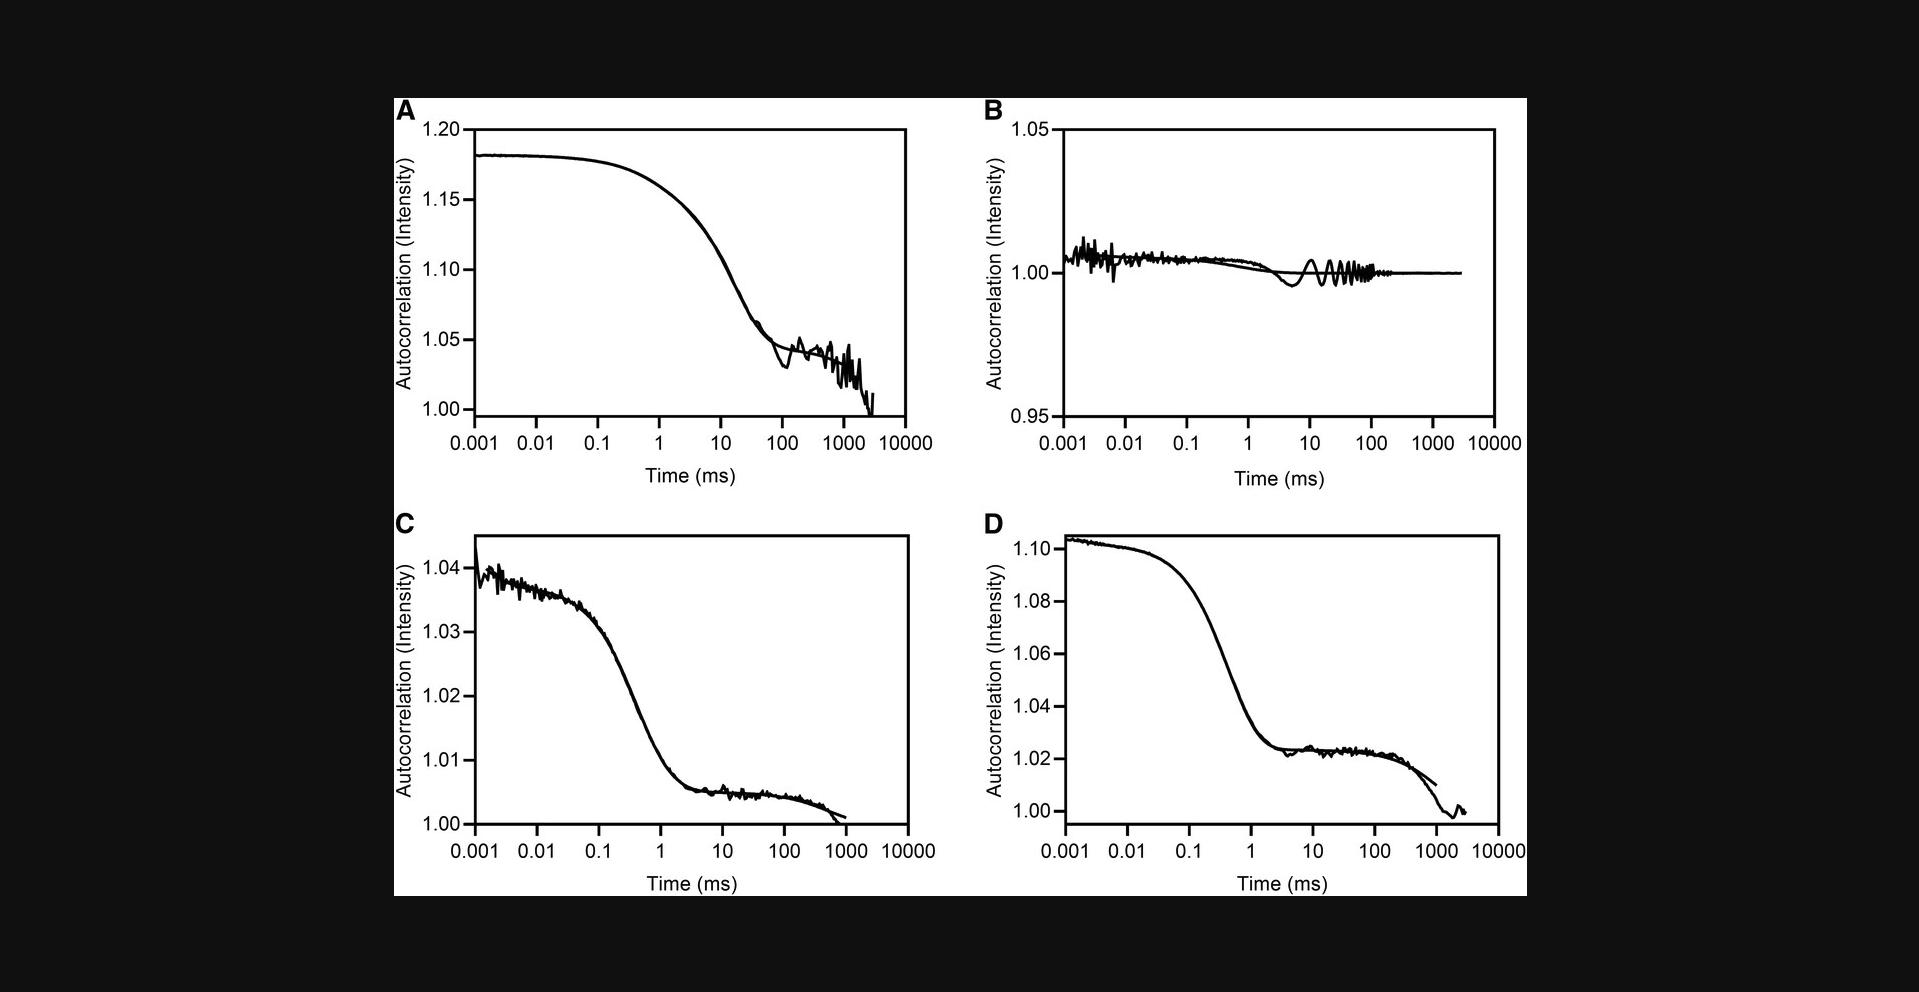
20.Inspect all compound acquisitions (autocorrelation plots and images if available) on a well-by-well basis. Acceptable data show an exponential decay to a value of 1 (Fig. 5B). Data should only be used in calculating the hydrodynamic radius (R h) if the autocorrelation function exhibits the behavior of the example in Figure 5B. Examples of data that should not be used are shown in Figure 6.Inspect the regularization fit for each acquisition to confirm goodness of fit.
21.Determine the lowest compound concentration at which particles are observed in at least 70% of the acquisitions. This is the Lowest Aggregation Concentration (LAC).
22.Alternatively, if the data are of sufficient quality, the R h values can be analyzed with linear regression to calculate the CAC (see Basic Protocol 1, step 15).
COMMENTARY
Background Information
Equivalency of DLS and RWG
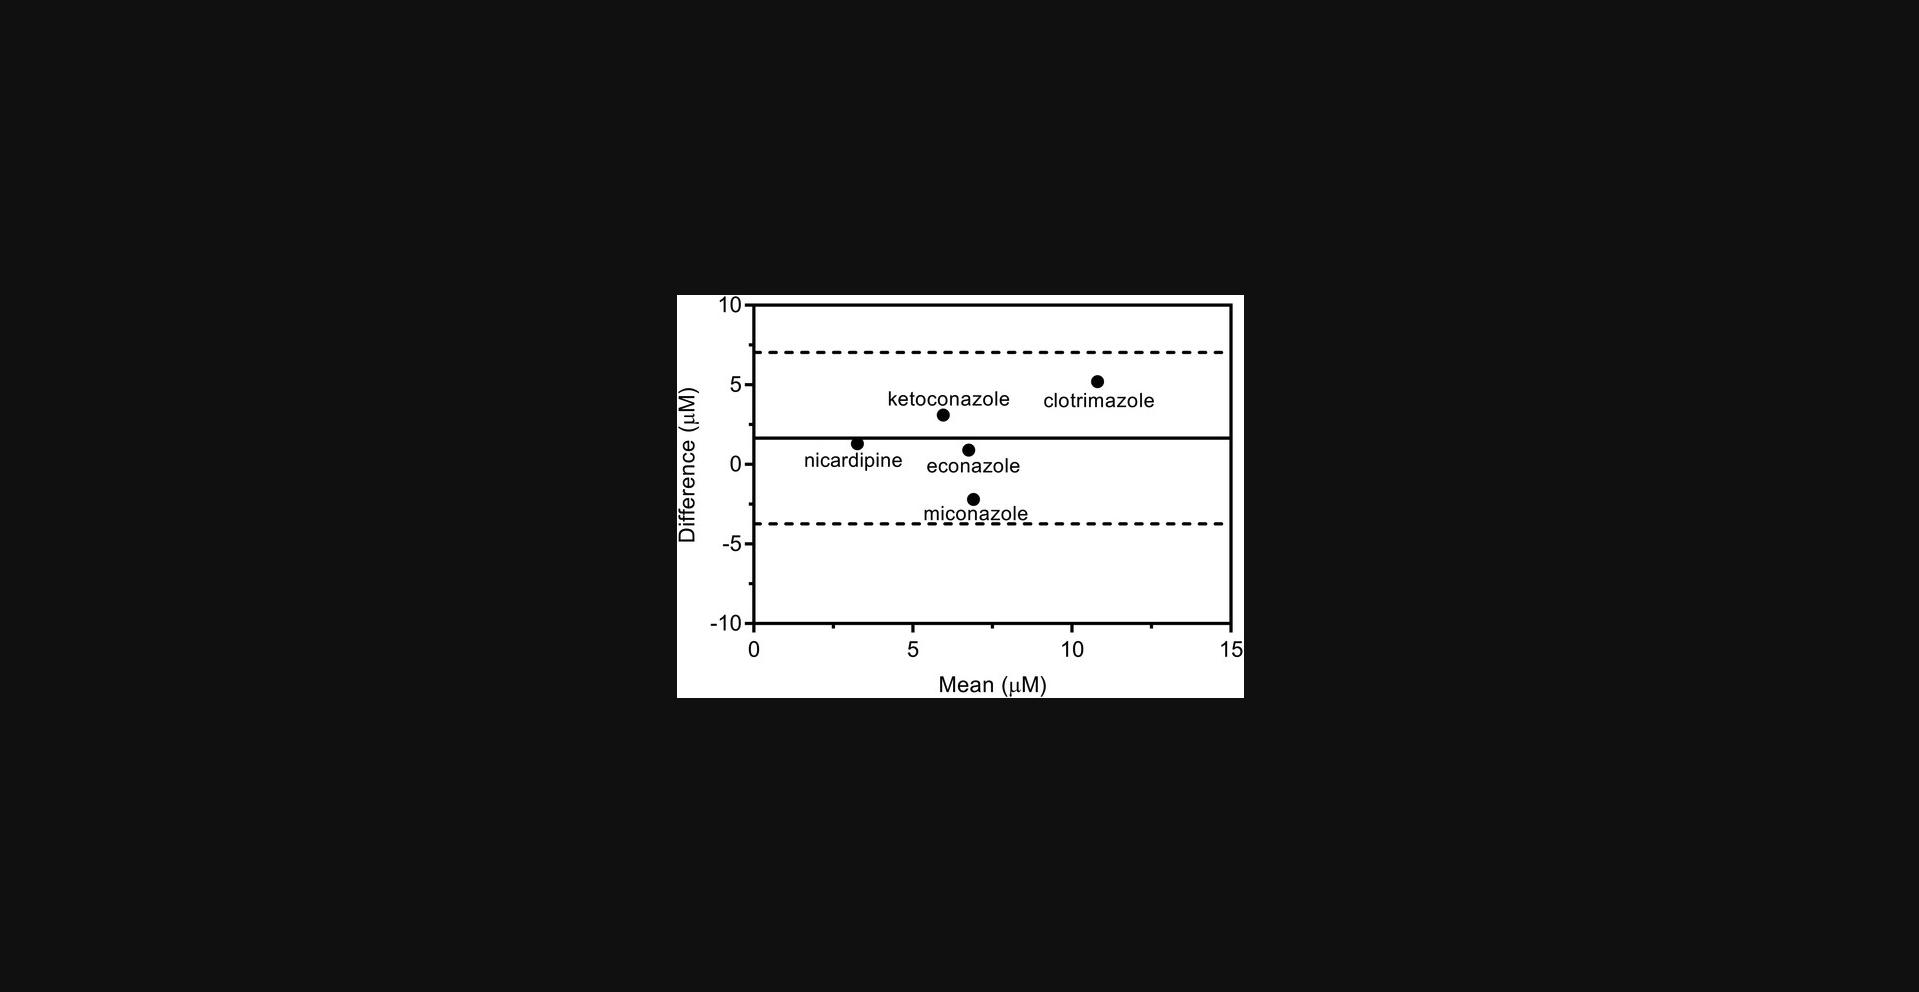
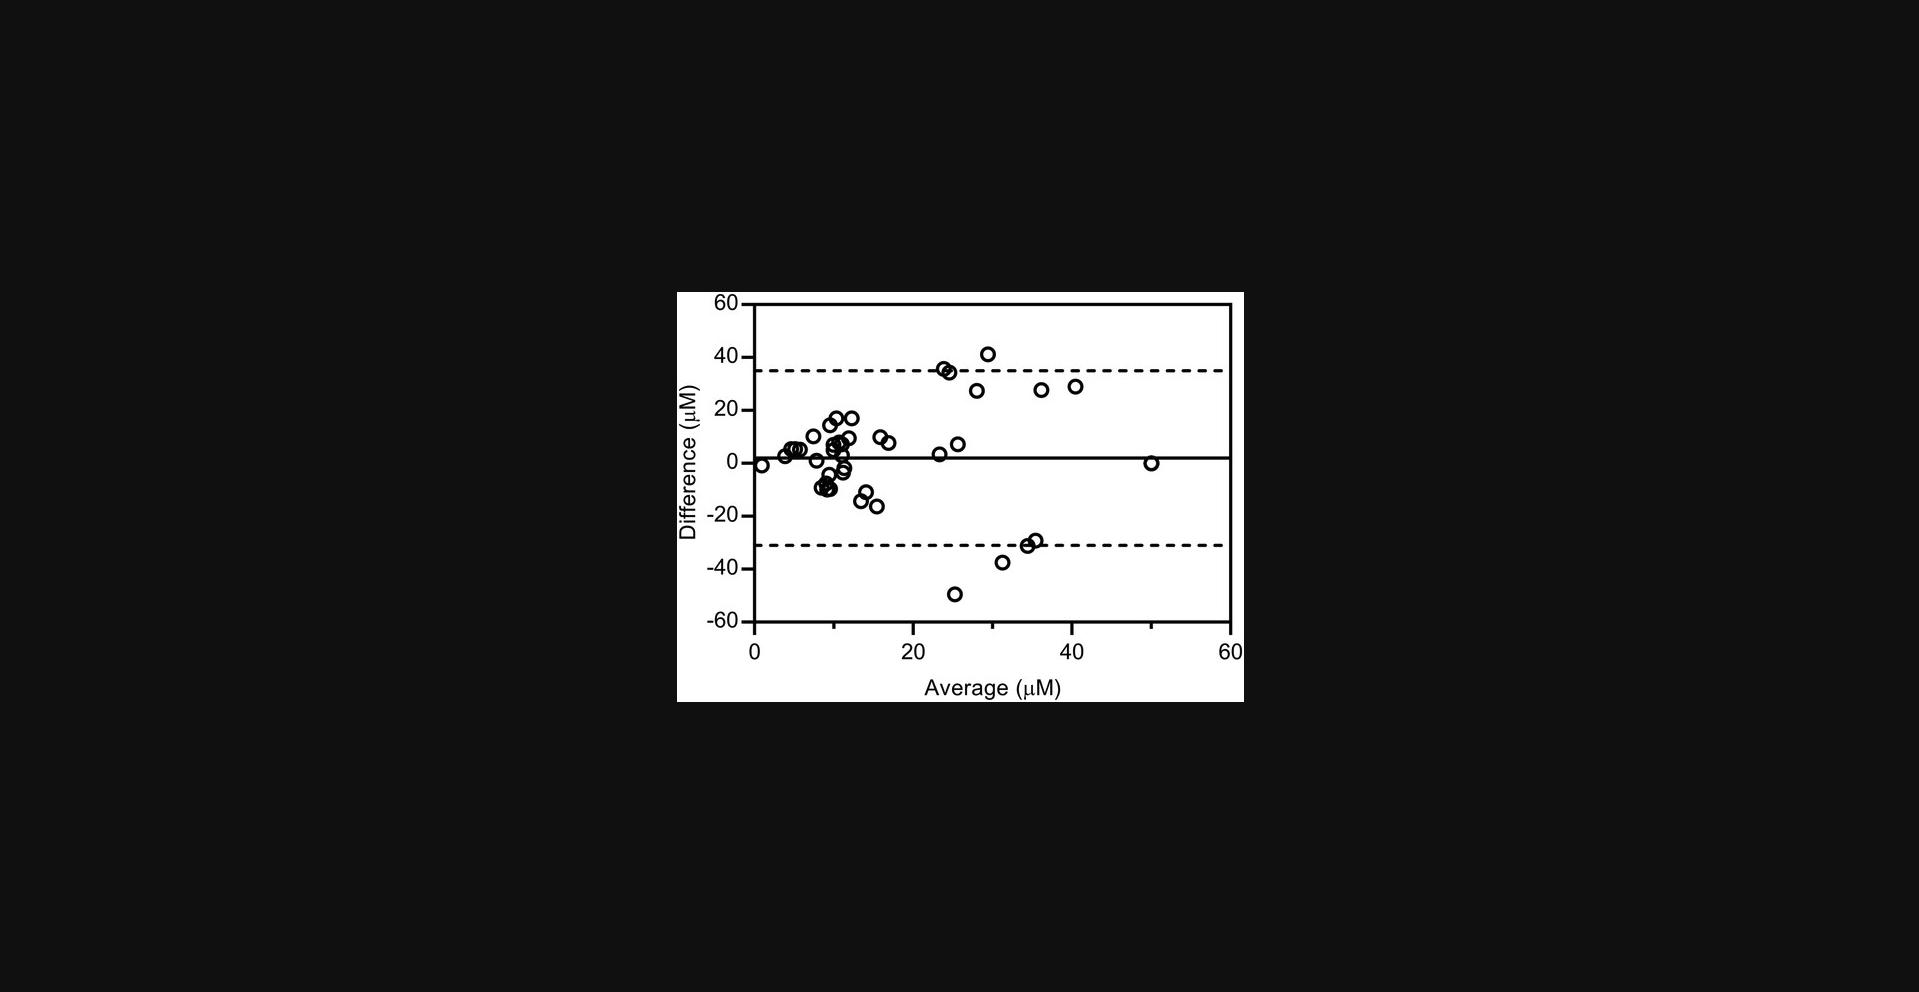
The physical basis of DLS and RWG is different, and so it may not be assumed a priori that the two methods give equivalent results. Aggregation concentrations were measured for thirty-three previously reported aggregating compounds identified from the ChEMBL database (Irwin et al., 2015) and for the known aggregators clotrimazole, econazole, ketoconazole, miconazole nitrate, and nicardipine (McGovern et al., 2003; Seidler et al., 2003). The two assay methods are equivalent as judged by a Bland-Altman analysis (Fig. 7), which quantifies the agreement between two different methods of measurement (Bland & Altman, 1986; Giavarina, 2015). In addition, ten known non-aggregating compounds (ChEMBL1329712, ChEMBL1483036, ChEMBL17052, ChEMBL228369, ChEMBL239674, ChEMBL337993, fluconazole, prednisone, sulfadiazine, and thalidomide) were characterized with DLS and RWG. In all but two cases the compounds acted as expected, that is, did not aggregate by either method. Two compounds showed aggregation in DLS, observed at 13 µM for ChEMBL239674 and 19 µM for ChEMBL337993, but did not show aggregation in RWG. The reason for this is unknown, but may reflect the high sensitivity of DLS to small numbers of large particles. However, as described above, both biophysical methods give statistically equivalent results and neither method appears particularly sensitive to false positives or false negatives (Fig. 7).
Three compounds stated to be non-aggregators are found in this study to aggregate by both DLS and RWG. Ketoconazole was reported as a non-aggregator based on detergent sensitivity, enzyme concentration sensitivity, and DLS (Seidler et al., 2003). ChEMBL3113390 and ChEMBL283196 were also reported as non-aggregators based on detergent sensitivity and DLS (Irwin et al., 2015). The buffers are ostensibly the same in the different studies. The apparent contradiction may represent differences in compound handling, compound purity, or subtle differences in buffer including DMSO concentration.
Comparison with biochemical methods
Compound aggregation can be inferred indirectly from sensitivity of compound activity to detergent (McGovern et al., 2003; Ryan et al., 2003; Feng & Shoichet, 2006). If detergent abrogates the inhibitory effect of a compound, then it is assumed that the inhibition is the result of an aggregate rather than a specific mechanism. Since enzyme assays can be run in 384-well and 1536-well plates, detergent sensitivity provides a high-throughput approach to indirectly monitor for compound aggregation (Feng & Shoichet, 2006). The observed effect may depend, however, on the detergent used and detergent concentration (Ryan et al., 2003). Care should be taken to use the detergent at a concentration below the critical micelle concentration, since it is plausible that micelles simply sequester the small molecule, aggregating or not, to give the appearance of a loss of compound activity and a false positive aggregation result.
Another biochemical approach specific to enzymes is to test compound activity as a function of enzyme concentration (Habig et al., 2009; McGovern et al., 2002). Aggregating compounds lose potency at higher enzyme concentrations. For this approach, the inhibitor K d needs to be significantly greater than the enzyme concentration (Auld, Inglese, & Dahlin, 2017).
Both biochemical methods can be used to infer that compounds may be false positives due to aggregation. However, these methods do not provide a CAC value and imply aggregation via loss of compound activity in a qualitative manner. In contrast, DLS and RWG provide direct and quantitative measures of compound self-assembly.
Inference of aggregation as the source of apparent compound activity
Unlike tests such as assay sensitivity to detergent or enzyme concentration, biophysical measurements provide information on the compound and not the effect of the compound on the assay. The observed CAC, therefore, needs to be evaluated in the light of the apparent activity. If the CAC is much higher (≥ten-fold) than the concentration at which the compound shows activity, it is likely that the compound is not forming aggregates that influence the observed activity. In contrast, if a CAC value is within three-fold of the apparent potency (e.g., IC50), then the apparent activity of the molecule may be due to aggregation.
Critical Parameters
Buffer composition
Aggregation is dependent on the buffer (pH, buffer, detergent, other additives). Aggregation should therefore be measured under the same conditions as the biochemical assay, including the same buffer. The two biophysical techniques described here can be used with any type of buffer that is suitable for a biochemical assay, including buffers with additives such as salt or DTT. For RWG, the DMSO concentration must be carefully matched in the samples and controls to avoid a response based on DMSO rather than the compound. All solutions should be prepared with molecular-biology-grade water (e.g., Corning 46-000-CM) and chemicals of the highest quality, and filtered with a 0.22-μm filter.
Compound characterization
Compounds that are degraded can appear as aggregators when in fact the parental compound does not aggregate. Alternatively, the parent compound may aggregate whereas the degradation product does not. Compounds, therefore, should be as pure as possible (at least 90% and preferably 95% or greater). Purity should be determined directly on freshly prepared solutions of the compound of interest using techniques such as liquid chromatography, mass spectrometry, or nuclear magnetic resonance (see Current Protocols article: Holland-Crimmin, Gosnell, & Quinn, 2011), as opposed to relying on a manufacturer's specification. Compound degradation can occur rapidly at room temperature in DMSO, so compounds should be stored at −20°C under low humidity (see Current Protocols article: Holland-Crimmin et al., 2011). Finally, a method to determine the actual concentration of the test compound should be used, since compound concentration can be affected by degradation, water uptake by DMSO, or slow precipitation. Quantitative nuclear magnetic resonance (to measure compound concentration) provides a universal method to measure reliably the concentration of a small molecule (Liu, Kolpak, Wu, & Leo, 2012).
Positive controls
A number of positive controls for aggregation are commercially available, including clotrimazole, econazole, ketoconazole, miconazole, miconazole nitrate, and nicardipine (Table 1). Preparing fresh solutions weekly is recommended to minimize compound degradation. Miconazole nitrate is a reproducible control with a robust assay response in both DLS and RWG. The CAC for miconazole nitrate in 50 mM potassium phosphate, pH 7.0, is 10 ± 1 μM (Fig. 1), while the LAC by DLS is 13 ± 6 μM. The LAC is the lowest tested concentration at which aggregates are observed and is expected to be higher than the CAC obtained by the linear fit method (Fig. 1).
Parameters specific to RWG
Two methods can be used to calculate the CAC from RWG. In one, the RWG responses below and above the CAC are fit to straight lines, and the CAC is taken as the intersection of the two fits (Fig. 1). In the second method, the mean of the buffer signal plus six standard deviations is used to identify the concentration at which the RWG response meets a threshold above buffer alone. The first method provides a more precise measure of the CAC, but is time consuming to apply to a large number of samples. The second method provides a fast way to screen for compounds that aggregate, which can be followed with linear regression analysis if desired.
Parameters specific to DLS
The main critical issue with DLS is to ensure that samples are free from bubbles and contaminating particles such as dust. Bubbles and particles will cause large signals in the autocorrelation function as the particles move in and out of the detector, and will cause repeated measurements on the same well to be inconsistent. Autocorrelation functions in the presence of particles or bubbles will appear as those in Figure 6 (artifactual) and not as in Figure 5 (acceptable). If a small number of acquisitions exhibit functions such as those shown in Figure 6, then the bulk of the data can still be analyzed with the offending data excluded from the analysis. However, if ≥30% of the data reflect contaminating particles, then the experiment should be repeated with attention to the filtration, centrifugation, and nitrogen flush steps described in Basic Protocol 2.
The total acquisition time should be considered, since evaporation may occur after 1.5 hr. Data collection for a full 384-well plate requires 3 hr, and if such a plate is used, the wells should be covered with oil (Basic Protocol 2 step 12). Alternatively, using only half of a 384-well plate to reduce the data collection time to approximately 1.5 hr eliminates the need for oil. The latter approach may be preferable in the absence of practice in layering oil on microplates.
There are multiple ways to quantify aggregation by DLS. Normalized scattering intensity has previously been reported to determine CAC (Irwin et al., 2015), as it is dependent on the particle concentration. However, this method is particularly prone to false positives from dust particles and typically has large error, especially in the region just above the CAC, thus requiring many replicates (Wyatt Technology Technical Note TN7002; see Internet Resources). For some well-behaved compounds, such as miconazole nitrate, it is possible to determine the CAC by plotting the calculated R h values determined using a cumulants or regularization fit at each concentration and fitting, as described in Basic Protocol 1, step 15 (Fig. 1, Table 1). However, R h values can often be quite variable, particularly in the aggregation transition region where the fit quality is poor due to low signal intensity as particles start to assemble, and may appear to be multimodal. This results in the need for many acquisitions and independent replicates. Additionally, some compounds form polydisperse particles that are heterogeneous in size, and meaningful R h values cannot be obtained using a cumulants model or regularization model. Finally, some compounds form extremely large particles, including visible precipitates, above the limit of detection of DLS, and R h values cannot be determined (e.g., econazole and ketoconazole, Table 1). For such cases, the lowest aggregating concentration (LAC) can be reported, which is the concentration at which aggregates are first observed. An advantage of the LAC approach is that pre-defined masking settings in DLS analysis software enable the easy identification of wells with no particles or with very large particles relatively rapidly in an unbiased manner. However, this method still requires careful examination of every acquisition for fit quality, normalized intensity, and unusual behavior. In addition, the LAC is most reproducible between replicates when used in conjunction with a shallow dilution series (i.e., two-fold dilutions).
While the focus here is on a 384-well plate–based method, DLS can be performed in a 96-well plate or on single samples using a cuvette. Of course, sample amounts are higher, throughput is much reduced, and cuvette-based analysis is not practical in a high-throughput environment. The same care is needed with preparing particle-free buffers, DMSO, and test samples, and acquisitions need to be assessed and analyzed as described in Basic Protocol 2. Reusable or disposable cuvettes may be employed if they are compatible with the DLS instrument used for data acquisition. Reusable cuvettes need to be carefully cleaned to avoid sample cross contamination, irrelevant scattering due to particles such as dust, and formation of air bubbles. Wyatt Technology Technical Note TN9000 (see Internet Resources) provides details on cuvette cleaning.
Troubleshooting
Table 2 lists problems, possible causes, and solutions specific to RWG. Miconazole nitrate provides a robust control if the instrument needs to be checked for performance in the aggregation assays (Fig. 1).
| Problem | Possible cause(s) | Solution |
|---|---|---|
| No signal | Plate not inserted correctly | Remove plate and insert correctly |
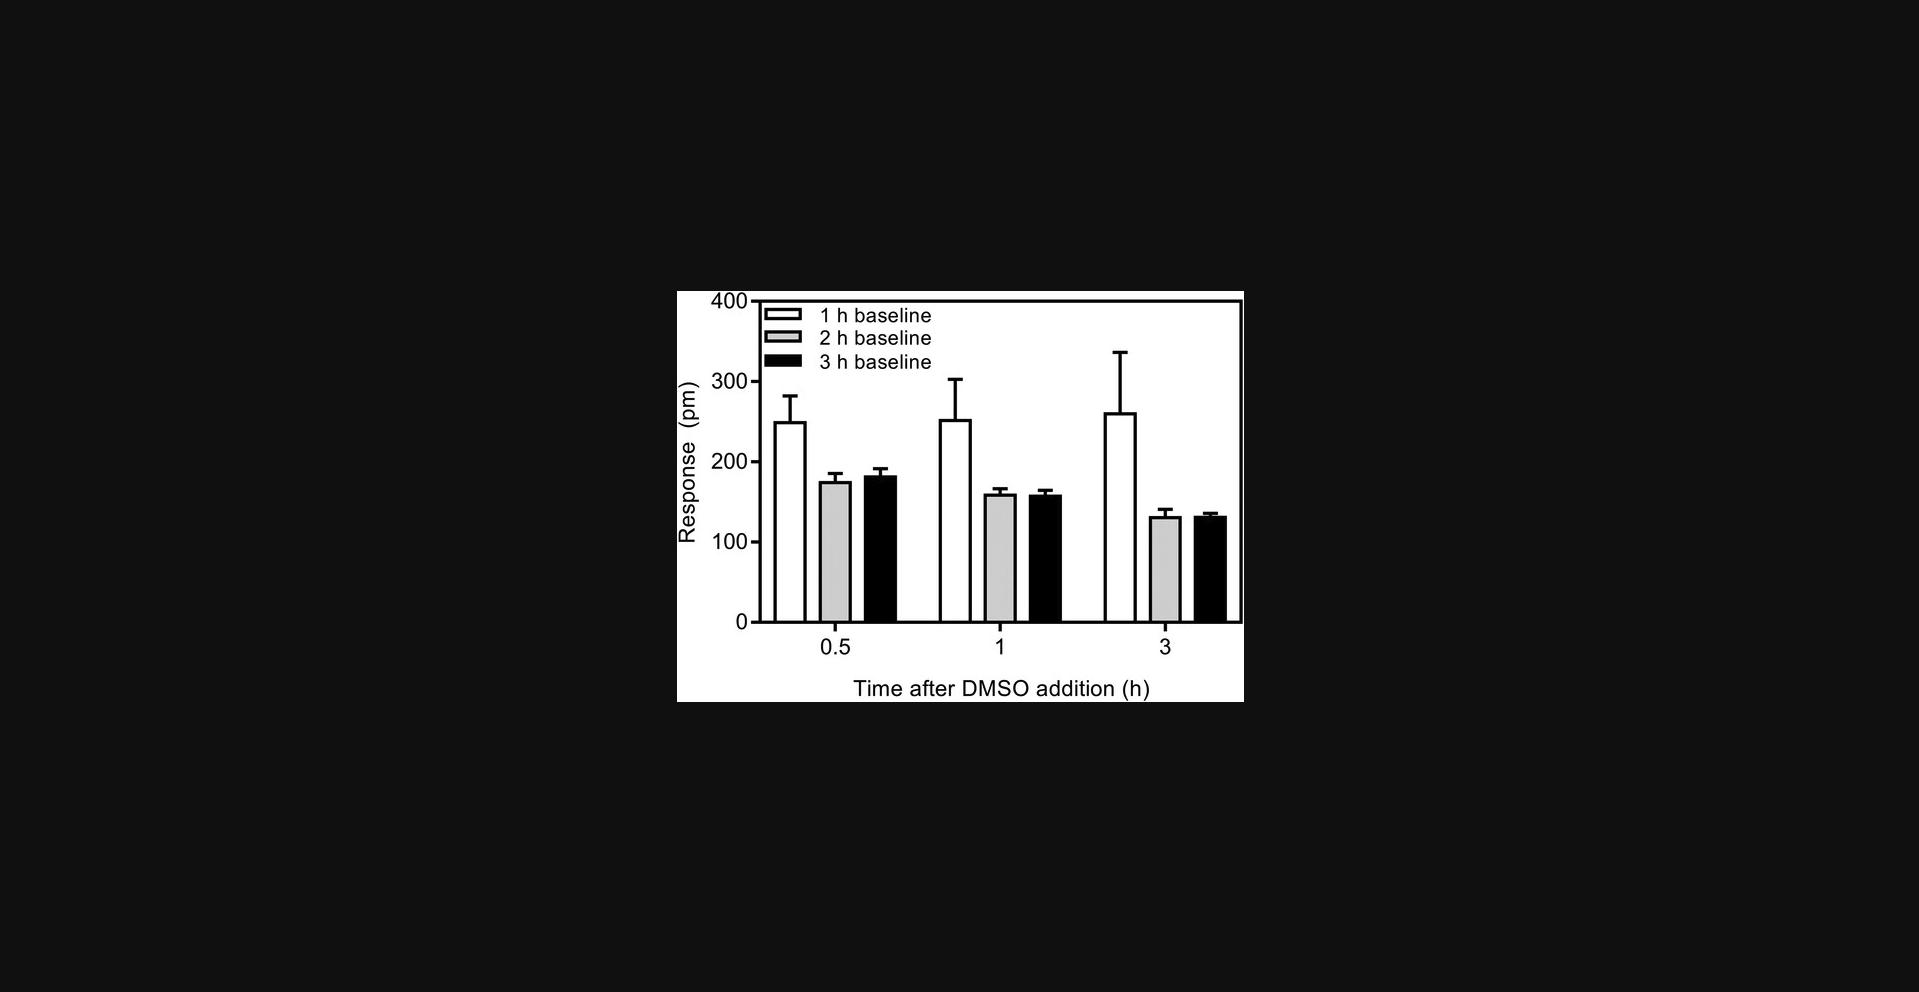
| The response is highly variable for the control wells (see Fig. 2) |
Biosensors are not incubated in buffer for sufficient time |
Optimize the incubation time for the specific buffer used as shown in Fig. 2 |
| The response is higher or lower than expected for the control wells based on historical data | DMSO concentration is incorrect |
Repeat experiment If problem persists use a new bottle of DMSO |
| The response of DMSO/buffer control wells does not match the response of non-aggregating compounds | Source of DMSO is different between control and compound samples | Use the same source of DMSO for all samples |
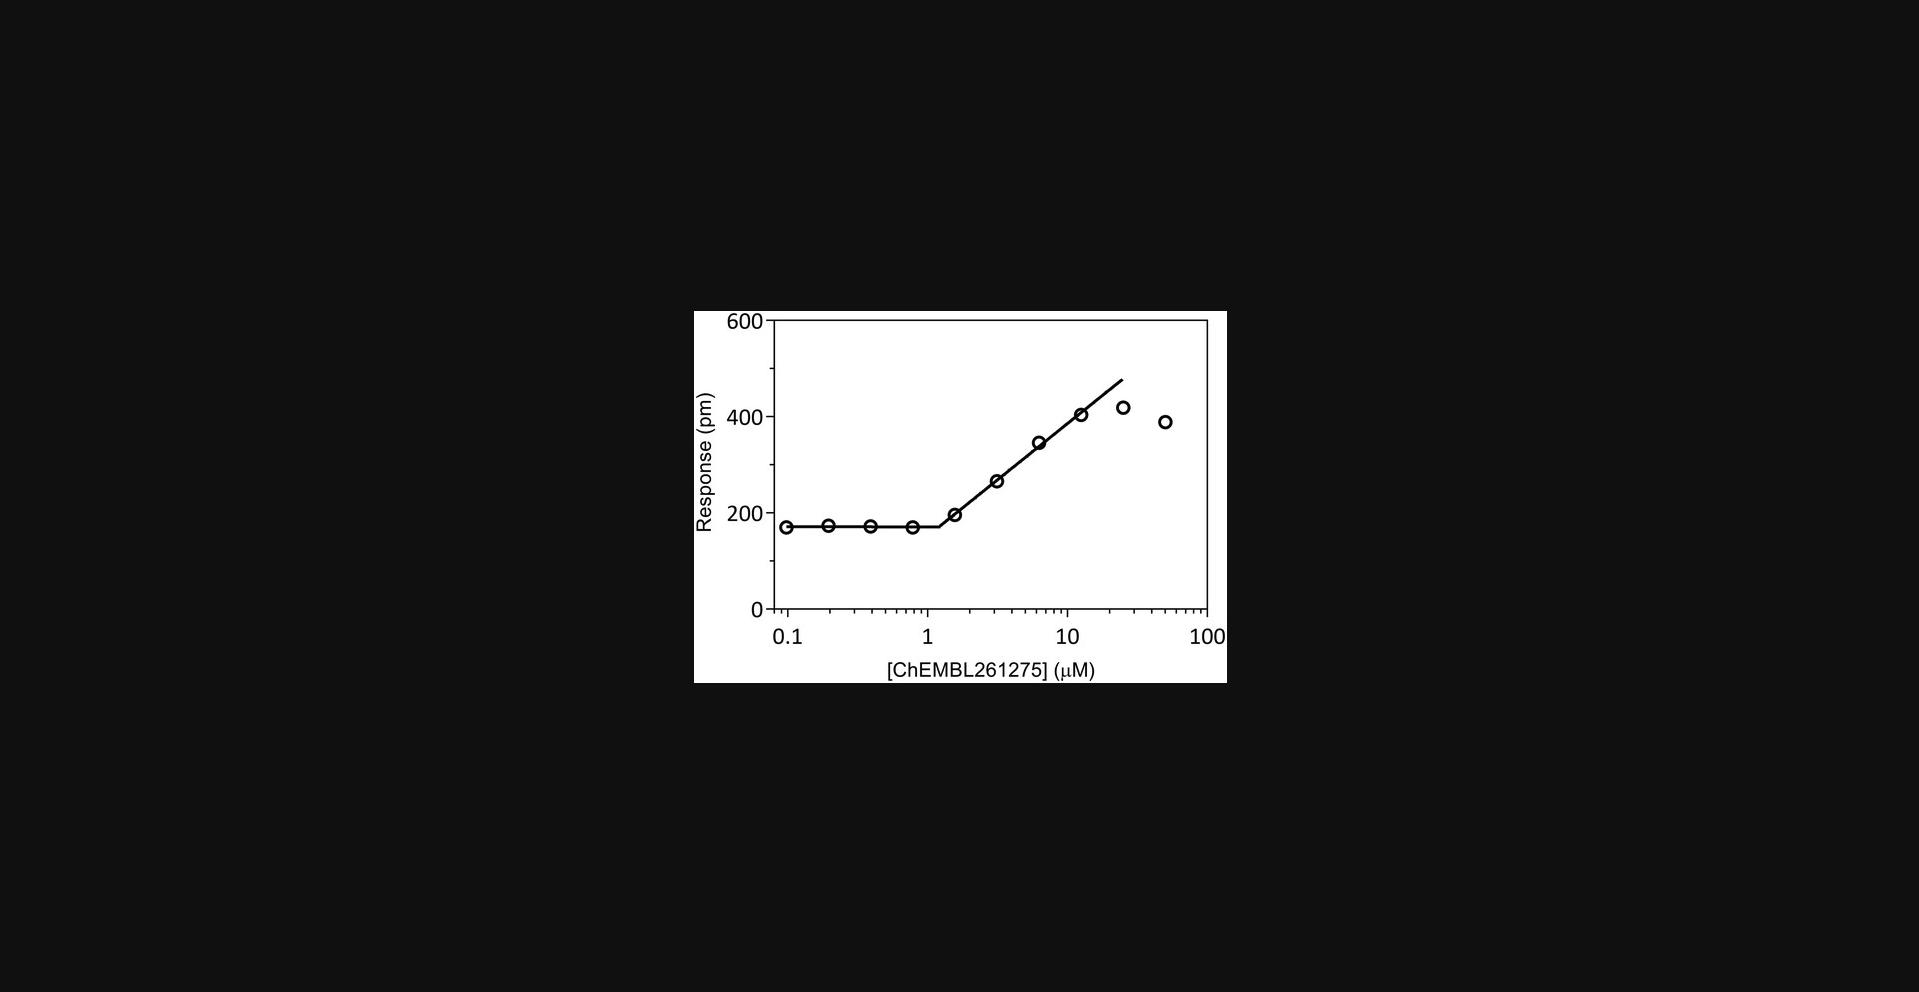
| Data cannot be fit using the linear method due to a hook in response at high concentrations (see Fig. 3) | Compound precipitation | Mask data for affected concentrations or test at lower concentrations |
Table 3 lists problems, possible causes, and solutions specific to DLS. Bovine serum albumin provides a robust control if the instrument needs to be checked, and should give a reproducible R h value of 3.5 nm.
| Problem | Possible cause(s) | Solution |
|---|---|---|
| DMSO/buffer wells do not resemble Fig. 5A | Presence of air bubbles or contaminating particles | Prepare samples using the filtration, centrifugation, and plate-cleaning steps of Basic Protocol 2. Up to 30% of acquisitions can be excluded and the well can still be analyzed (Basic Protocol 2, step 19). |
| Autocorrelation curves of control wells vary during the course of an experiment | Solvent evaporation |
Cover samples with oil to prevent evaporation, ensuring that the oil does not touch the plate surface Alternatively, use less wells to decrease the acquisition time |
| Non-aggregating control compounds appear as aggregates | Presence of air bubbles or contaminating particles including precipitated compounds |
Centrifuge stock vials of compounds and DMSO, or filter through a 0.22-μm filter Use fresh DMSO |
Anticipated Results
Basic Protocol 1 will yield an RWG response that is either flat or gently linear with compound concentration for non-aggregating compounds, with a change in response of less than 500 pm [in 1% (v/v) DMSO]. If compound aggregation is present, there will be a flat or gently linear response at low concentrations and a (marked) change in gradient at the CAC, followed by a linear response of higher gradient (Fig. 1).
Basic Protocol 2 will generate autocorrelation curves with no visible decay at any compound concentration for non-aggregating compounds (Fig. 5A). For aggregating compounds, there will be a concentration-dependent increase in the autocorrelation intensity, decay time, and calculated hydrodynamic radius (Fig. 5B).
Time Considerations
The read time for an RWG 384-well plate is 5 min, and up to 5 hr for a DLS 384-well plate. Determination of CAC values by linear regression for 32 compounds in dose response from 384-well RWG and DLS plates is approximately 1 and 2 to 3 hr, respectively. Analysis by RWG of a typical HTS hit set of 10,000 compounds in dose-response format would take up to 1 to 3 days for data acquisition and analysis. DLS of a typical HTS hit set of 10,000 compounds in dose-response format would take up to 8 weeks for data acquisition and analysis.
Literature Cited
- Auld, D. S., Inglese, J., & Dahlin, J. L. (2017). Assay interference by aggregation. In G. S. Sittampalam, A. Grossman, & K. Brimacombe, et al. (Eds.), Assay Guidance Manual. Bethesda: Eli Lilly and the National Center for Advancing Translational Science. Retrieved from https://www.ncbi.nlm.nih.gov/books/NBK442297/.
- Babaoglu, K., Simeonov, A., Irwin, J. J., Nelson, M. E., Feng, B., Thomas, C. J., … Shoichet, B. K. (2008). Comprehensive mechanistic analysis of hits from high-throughput and docking screens against β-lactamase. Journal of Medicinal Chemistry , 51, 2502–2511. doi: 10.1021/jm701500e.
- Bland, J. M., & Altman, D. G. (1986). Statistical methods for assessing agreement between two methods of clinical measurement. Lancet , 1, 307–310. doi: 10.1016/S0140-6736(86)90837-8.
- Blevitt, J. M., Hack, M. D., Herman, K. L., Jackson, P. F., Krawczuk, P. J., Lebsack, A. D., … Lumb, K. J. (2017). Structural basis of small-molecule aggregate induced inhibition of a protein-protein interaction. Journal of Medicinal Chemistry , 60, 3511–3517. doi: 10.1021/acs.jmedchem.6b01836.
- Chan, L. L., Lidstone, E. A., Finch, K. E., Heeres, J. T., Hergenrother, P. J., & Cunningham, B. T. (2009). A method for identifying small-molecule aggregators using photonic crystal biosensor microplates. JALA , 14, 348–359.
- Coan, K. E., & Shoichet, B. K. (2008). Stoichiometry and physical chemistry of promiscuous aggregate-based inhibitors. Journal of the American Chemical Society , 130, 9606–9612. doi: 10.1021/ja802977h.
- Coan, K. E., Maltby, D. A., Burlingame, A. L., & Shoichet, B. K. (2009). Promiscuous aggregate-based inhibitors promote enzyme unfolding. Medicinal Chemistry , 52, 2067–2075. doi: 10.1021/jm801605r.
- Feng, B., & Shoichet, B. K. (2006). A detergent-based assay for the detection of promiscuous inhibitors. Nature Protocols , 1, 550–553. doi: 10.1038/nprot.2006.77.
- Feng, B. Y., Simeonov, A., Jadhav, A., Babaoglu, K., Inglese, J., Shoichet, B. K., & Austin, C. P. (2007). A high-throughput screen for aggregation-based inhibition in a large compound library. Journal of Medicinal Chemistry , 50, 2385–2390. doi: 10.1021/jm061317y.
- Ferreira, R. S., Bryant, C., Ang, K. K. H., McKerrow, J. H., Shoichet, B. K., & Renslo, A. R. (2009). Divergent modes of enzyme inhibition in a homologous structure-activity series. Journal of Medicinal Chemistry , 52, 5005–5008. doi: 10.1021/jm9009229.
- Ganesh, A. N., Donders, E. N., Schoichet, B. K., & Shoichet, M. S. (2018). Colloidal aggregation: From screening nuisance to formulation nuance. Nano Today , 19, 199–200. doi: 10.1016/j.nantod.2018.02.011.
- Giavarina, D. (2015). Understanding Bland-Altman analysis. Biochemia Medica , 25, 141–151. doi: 10.11613/BM.2015.015.
- Goode, D. R., Totten, R. K., Heeres, J. T., & Hergenrother, P. J. (2008). Identification of promiscuous small molecule activators in high-throughput enzyme activation screens. Journal of Medicinal Chemistry , 51, 2346–2349. doi: 10.1021/jm701583b.
- Habig, M., Blechschmidt, A., Dressler, S., Hess, B., Patel, V., Billich, A., … Klumpp, M. (2009). Efficient elimination of non-stoichiometric enzyme inhibitors from HTS hit lists. Journal of Biomolecular Screening , 14, 679–689. doi: 10.1177/1087057109336586.
- Holland-Crimmin, S., Gosnell, P., & Quinn, C. (2011). Compound management: Guidelines for compound storage, provision, and quality control. Current Protocols in Chemical Biology , 3, 141–152. doi: 10.1002/9780470559277.ch110095.
- Irwin, J. J., Duan, D., Torosyan, H., Doak, A. K., Ziebart, K. T., Sterling, T., … Shoichet, B. K. (2015). An aggregation advisor for ligand discovery. Journal of Medicinal Chemistry , 58, 7076–7087. doi: 10.1021/acs.jmedchem.5b01105.
- Jadhav, A., Ferreira, R. S., Klumpp, C., Mott, B. T., Austin, C. P., Inglese, J., … Simeonov, A. (2010). Quantitative analysis of aggregation, autofluorescence, and reactivity artifacts in a screen for inhibitors of a thiol protease. Journal of Medicinal Chemistry , 53, 37–51. doi: 10.1021/jm901070c.
- Liu, X., Kolpak, M. X., Wu, J., & Leo, G. C. (2012). Automatic analysis of quantitative NMR data of pharmaceutical compound libraries. Analytical Chemistry , 84, 6914–6918. doi: 10.1021/ac301544u.
- McGovern, S. L., Caselli, E., Grigorieff, N., & Shoichet, B. K. (2002). A common mechanism underlying promiscuous inhibitors from virtual and high-throughput screening. Journal of Medicinal Chemistry , 45, 1712–1722. doi: 10.1021/jm010533y.
- McGovern, S. L., Helfand, B. T., Feng, B., & Shoichet, B. K. (2003). A specific mechanism of nonspecific inhibition. Journal of Medicinal Chemistry , 46, 4265–4272. doi: 10.1021/jm030266r.
- Pohjala, L., & Tammela, P. (2012). Aggregating behavior of phenolic compounds—A source of false bioassay results. Molecules , 17, 10774–10790. doi: 10.3390/molecules170910774.
- Ryan, J., Gray, N. M., Lowe, P. N., & Chung, C. (2003). Effect of detergent on “Promiscuous” inhibitors. Journal of Medicinal Chemistry , 46, 3448–3451. doi: 10.1021/jm0340896.
- Sassano, M. F., Doak, A. L., Roth, B. L., & Shoichet, B. K. (2013). Colloidal aggregation causes inhibition of G protein-coupled receptors. Journal of Medicinal Chemistry , 56, 2406–2414. doi: 10.1021/jm301749y.
- Seidler, J., McGovern, S. L., Doman, T. N, & Shoichet, B. K. (2003). Identification and prediction of promiscuous aggregating inhibitors among known drugs. Journal of Medicinal Chemistry , 46(21), 4477-4486. doi: 10.1021/jm030191r.
- Shoichet, B. K. (2006). Screening in a spirit haunted world. Drug Discovery Today , 11, 607–615. doi: 10.1016/j.drudis.2006.05.014.
- Stetefeld, J., McKenna, S. A., & Patel, T. R. (2016). Dynamic light scattering: A practical guide and applications in biomedical sciences. Biophysical Review , 8, 409–427. doi: 10.1007/s12551-016-0218-6.
- Thorne, N., Auld, D. S., & Inglese, J. (2010). Apparent activity in high-throughput screening: Origins of compound-dependent assay interference. Current Protocols in Chemical Biology , 14, 315–324. doi: 10.1016/j.cbpa.2010.03.020.
Internet Resources
Screening for Compound Aggregates. Wyatt Technology Technical Note TN7002.
Quartz Cuvette Cleaning Protocol. Wyatt Technology Technical Note TN9000.
Citing Literature
Number of times cited according to CrossRef: 6
- Courtney L. Labrecque, Brian Fuglestad, Ligandability at the Membrane Interface of GPx4 Revealed through a Reverse Micelle Fragment Screening Platform, JACS Au, 10.1021/jacsau.4c00427, 4 , 7, (2676-2686), (2024).
- Jiajun Dong, Brenson A. Jassim, Kedric L. Milholland, Zihan Qu, Yunpeng Bai, Yiming Miao, Jinmin Miao, Yuan Ma, Jianping Lin, Mark C. Hall, Zhong-Yin Zhang, Development of Novel Phosphonodifluoromethyl-Containing Phosphotyrosine Mimetics and a First-In-Class, Potent, Selective, and Bioavailable Inhibitor of Human CDC14 Phosphatases, Journal of Medicinal Chemistry, 10.1021/acs.jmedchem.4c00149, 67 , 11, (8817-8835), (2024).
- Zihan Qu, Aaron D. Krabill, Zhong-Yin Zhang, High-Throughput Discovery and Characterization of Covalent Inhibitors for Protein Tyrosine Phosphatases, Protein Tyrosine Phosphatases, 10.1007/978-1-0716-3569-8_19, (301-316), (2023).
- Christophe Molina, Lilia Ait-Ouarab, Hervé Minoux, Isometric Stratified Ensembles: A Partial and Incremental Adaptive Applicability Domain and Consensus-Based Classification Strategy for Highly Imbalanced Data Sets with Application to Colloidal Aggregation, Journal of Chemical Information and Modeling, 10.1021/acs.jcim.2c00293, 62 , 8, (1849-1862), (2022).
- Marco Robello, Hongchao Zheng, Mrinmoy Saha, Kara M. George Rosenker, Subrata Debnath, Jay Prakash Kumar, Harichandra D. Tagad, Sharlyn J. Mazur, Ettore Appella, Daniel H. Appella, Alkyl-substituted N-methylaryl-N′-aryl-4-aminobenzamides: A new series of small molecule inhibitors for Wip1 phosphatase, European Journal of Medicinal Chemistry, 10.1016/j.ejmech.2022.114763, 243 , (114763), (2022).
- Parnian Lak, Henry O’Donnell, Xuewen Du, Matthew P. Jacobson, Brian K. Shoichet, A Crowding Barrier to Protein Inhibition in Colloidal Aggregates, Journal of Medicinal Chemistry, 10.1021/acs.jmedchem.0c02253, 64 , 7, (4109-4116), (2021).

