CODEX Imaging Setup and Processing Experiment Protocol
Kavya.Anjani, Miguel Rivera, Zoltanlaszik
Disclaimer
DISCLAIMER – FOR INFORMATIONAL PURPOSES ONLY; USE AT YOUR OWN RISK
The protocol content here is for informational purposes only and does not constitute legal, medical, clinical, or safety advice, or otherwise; content added to protocols.io is not peer reviewed and may not have undergone a formal approval of any kind. Information presented in this protocol should not substitute for independent professional judgment, advice, diagnosis, or treatment. Any action you take or refrain from taking using or relying upon the information presented here is strictly at your own risk. You agree that neither the Company nor any of the authors, contributors, administrators, or anyone else associated with protocols.io, can be held responsible for your use of the information contained in or linked to this protocol or any of our Sites/Apps and Services.
Abstract
CODEX system is the combination of an (1) oligo-nucleotide based antibody labeling-detection technique, (2) a microfluidics instrument coupled with an inverted microscope capable of whole slide scanning, and an (3) ImageJ-based analysis platform. This experimental setup allows the automation of immunofluorescence signal detection across several staining cycles of a single tissue section
This protocol describes detailed methods used in CODEX imaging experiments at the Laszik Lab.
Steps
Imaging Setup
Launch the CODEX Instrument Management Software and enter cycle, marker id and exposure time information. Minimize the window.
Place the plate with the CODEX-tagged dyes in its designated place in the instrument.
Clean any dried buffer on the bottom of the stained coverslip with a wet kimwipe and dry off any residual liquid.
Turn on the Keyence scanner and load the cassette into the scanner.
Select the following Keyence settings:
- Turn on all fluorescent channels. Set to white.
- Low photobleach
- Mono
- High Resolution
- X20 air objective
- XY-stitching
- Z-stack
- Set center and number of images/Set Edge Points
Navigate the sample using the DAPI channel.
Use the “Navigation” window to capture regions of the sample.
Click upper and lower limit to keep z-stack in range.
Set the pitch for the z-stack. (1.5 µm )
Click “Start Capture” to set up location to save image files.
Switch back and maximize the CODEX Instrument Management window and click "Start Experiment".
CODEX Image Processing
Raw CODEX image data is transferred from acquisition computer to the processing computer using “Transfer Data” feature from CODEX Instrument Manager. Image processing pipeline includes two main components prior to image analysis; (1) image processing and (2) quality control steps.
Image processing: This is a fully automated and standardized protocol currently running on Akoya’s processor version 1.7.0.6.


Image alignment across cycles
To ensure positional consistency for reliable marker expression assessment, tissue displacement is corrected using 3D phase correlation. For each cycle, the nuclear stain pattern is compared to that of the reference cycle, which by default is DAPI of the second cycle. The calculated offsets are used to align all cycles using rigid translation.
Background subtraction
Auto fluorescence from each channel is eliminated using signal from blank cycles at the beginning and end of the run. Carry over signal from one cycle to another is eliminated by scanning at longer exposure time in the beginning with subsequently decreasing exposure times in later cycles. Sequence of markers, antibody concentration, and exposure time were rearranged to minimize carry over signal in subsequent cycles.
Deconvolution and extended field of depth
Enabling deconvolution reduces out of focus light to yield sharp images. Extended field of depth feature collapses all z-stacks into a single best focus image.
Shading correction
Optical vignetting is corrected using BaSiC, a retrospective method for estimating flat-field and correcting microscopy images.
Segmentation
Segmentation involves two steps, finding local maxima and region-growing using the maxima as seed points. Threshold values can be specified by the user to control the region growth. Key segmentation parameters affecting segmentation were radius and cut off range. Radius represents radius of local maxima search, which then serves as the kernel for a region growing algorithm. Decreasing the radius may improve the separation of clumped cells. Cut off range is the threshold for local maxima search. From the peak, the cell volume is grown by adding neighboring voxels whose intensities are between the minimum and maximum cutoff. For example, for 16-bit images, the range is 0 ~ 65,535, so the cutoff range would be 1,310 ~ 64,879. These thresholds aim to eliminate overexposure or low signal indistinct from the background. Images are segmented based on nuclear stain from cycle 2 using water-shed algorithm. Optimal segmentation parameters were found to be radius 6, with cut off range between 0.02 and 0.99. Segmentation settings were optimized to enhance segmentation efficiency by capturing as many true cells while minimizing false segmentation. Quality control gating was used to complement segmentation and eliminate false segmentation artifacts where feasible. Optimized segmentation parameters were validated in multiple CODEX experiments and is now implemented for all CODEX data.

CODEX Image Quality Control Steps
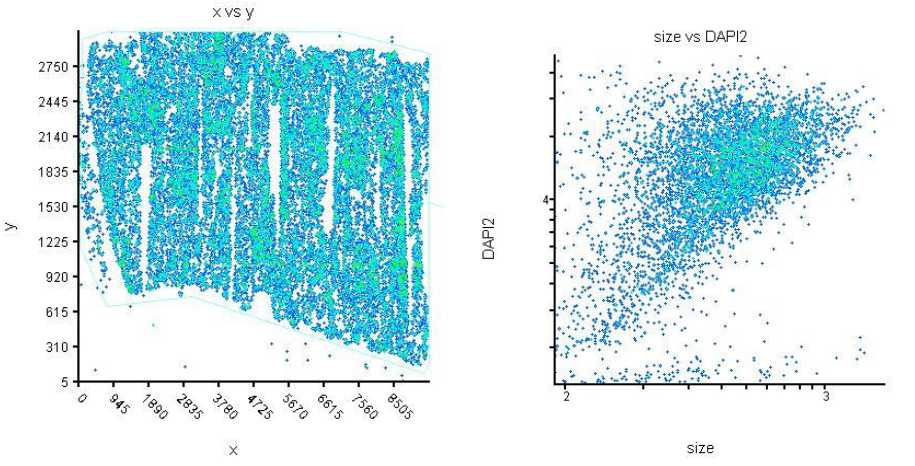
Quality control gating
Quality control gating in MAV is used to eliminate artifacts by retaining sample or region of interest only. Very small image objects and artifacts causing false segmentation are eliminated by DAPI and size QC gating.

Manual gating of population
Populations were generated by manual gating for each marker of interest. Minimum and maximum threshold values for respective markers were adjusted until all cells with desired marker intensity were gated. When marker intensity was low, structural context information was used to set gating threshold thus yielding high accuracy of gating. These markers/populations could be classified as positive or negative. Markers such as CD45, CD38, CD3 displayed wide range of expression level and pattern resulting in multi-dimensional variation. In such cases gating threshold was set to maximize specificity while avoiding potential noise.


CODEX Image Compartmental Segmentation (Clustering) of the Biopsy
Once the cellular population with individual markers were generated, the kidney biopsies were compartmentalized based on some of the main anatomical-structural compartments of the kidney e.g., glomeruli, tubulointerstitium and vessels (arteries and arterioles). Compartmental clustering took place with the help of phenotypical markers using manual annotation.
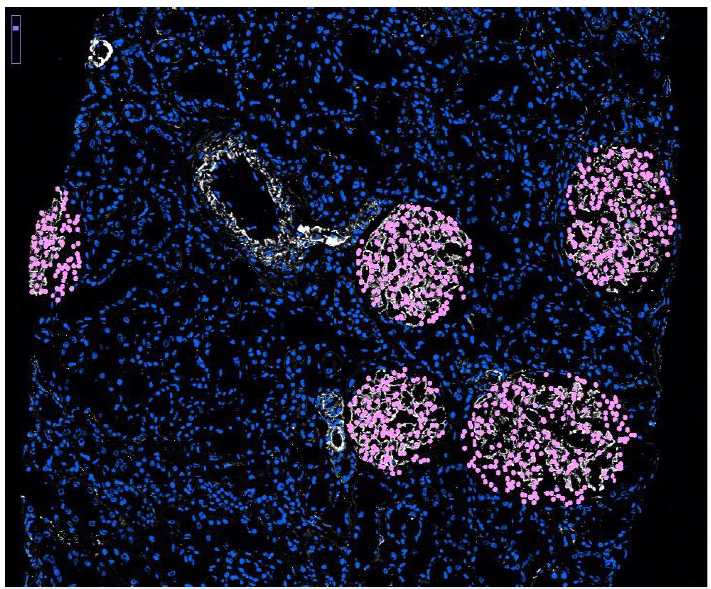
Glomerular compartment
Glomeruli were highlighted using synaptopodin and ROIs were created using polygon section tool around the edge of the glomeruli. This process was performed for every glomerulus in the biopsy. All the glomeruli were combined using “combine (union)” function in MAV to create glomerular compartment.
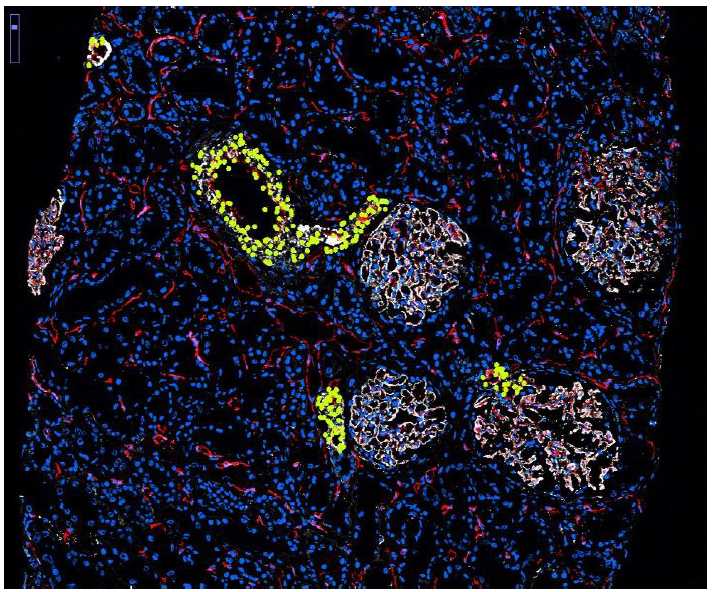
Arterial and arteriolar compartment
Arteries and arterioles were highlighted using synaptopodin and CD31. These structures were identified when synaptopodin was interspersed among smooth muscle cells with inner most lining of CD31+ endothelial cells. All the arteries and arterioles were combined using “combine (union)” function in MAV to create arterial and arteriolar population.
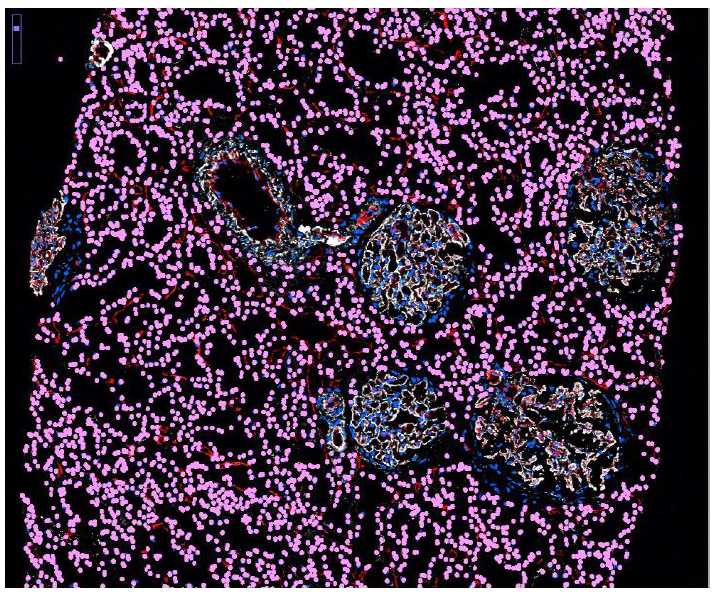
Tubulointerstitial compartment
Glomerular and arterial/arteriolar compartment were sequentially subtracted from all the cells (obtained post QC gating), using “set difference” function in MAV to yield tubulointerstitial compartment.
Total cellular population in each compartment was estimated for each biopsy. Predominant population in each compartment was estimated.
Biaxial gating of coexpressing population
Unique coexpressing population were identified by biaxial gating where populations were manually gated using two specific markers. Resultant double positive population were quality checked to determine if those gated as double positive were true positive or merely due to proximity. All false positive population were manually selected using selection tools in MAV and combined as false positive population. Only overlapping double positive population were considered true population and marked using selection tool in MAV. Either the false positive population were subtracted from double positive population using “set difference” function in MAV to yield true population. Or, alternatively only true positive population from double positive population were selected and retained using “intersection” function in MAV.

CODEX Defining cell populations based on combined phenotypical profiles
Cell populations were also generated based on phenotypic profiles. All CD45+ cells were populated as inflammatory cells. A subset of these CD45+ cells were also CD3+ and hence designated as T lymphocytes. CD45+CD3+ T lymphocytes were subclassified using biaxial gating in subsequent child plot. T helper cells were gated by CD3+CD4+ biaxial gating while T cytotoxic cells were gated using CD3+CD8+.

