BEHAV3D: a 3D live imaging platform for comprehensive analysis of engineered T cell behavior and tumor response
Hans Clevers, Johanna F. Dekkers, Ellen J. Wehrens, Anne C. Rios, Mario Barrera Román, Maria Alieva, Sam de Blank, Diana Petcu, Amber L. Zeeman, Noël M. M. Dautzenberg, Annelisa M. Cornel, Cesca van de Ven, Rob Pieters, Monique L. den Boer, Stefan Nierkens, Friso G. J. Calkoen, Jürgen Kuball, Zsolt Sebestyén
Extended
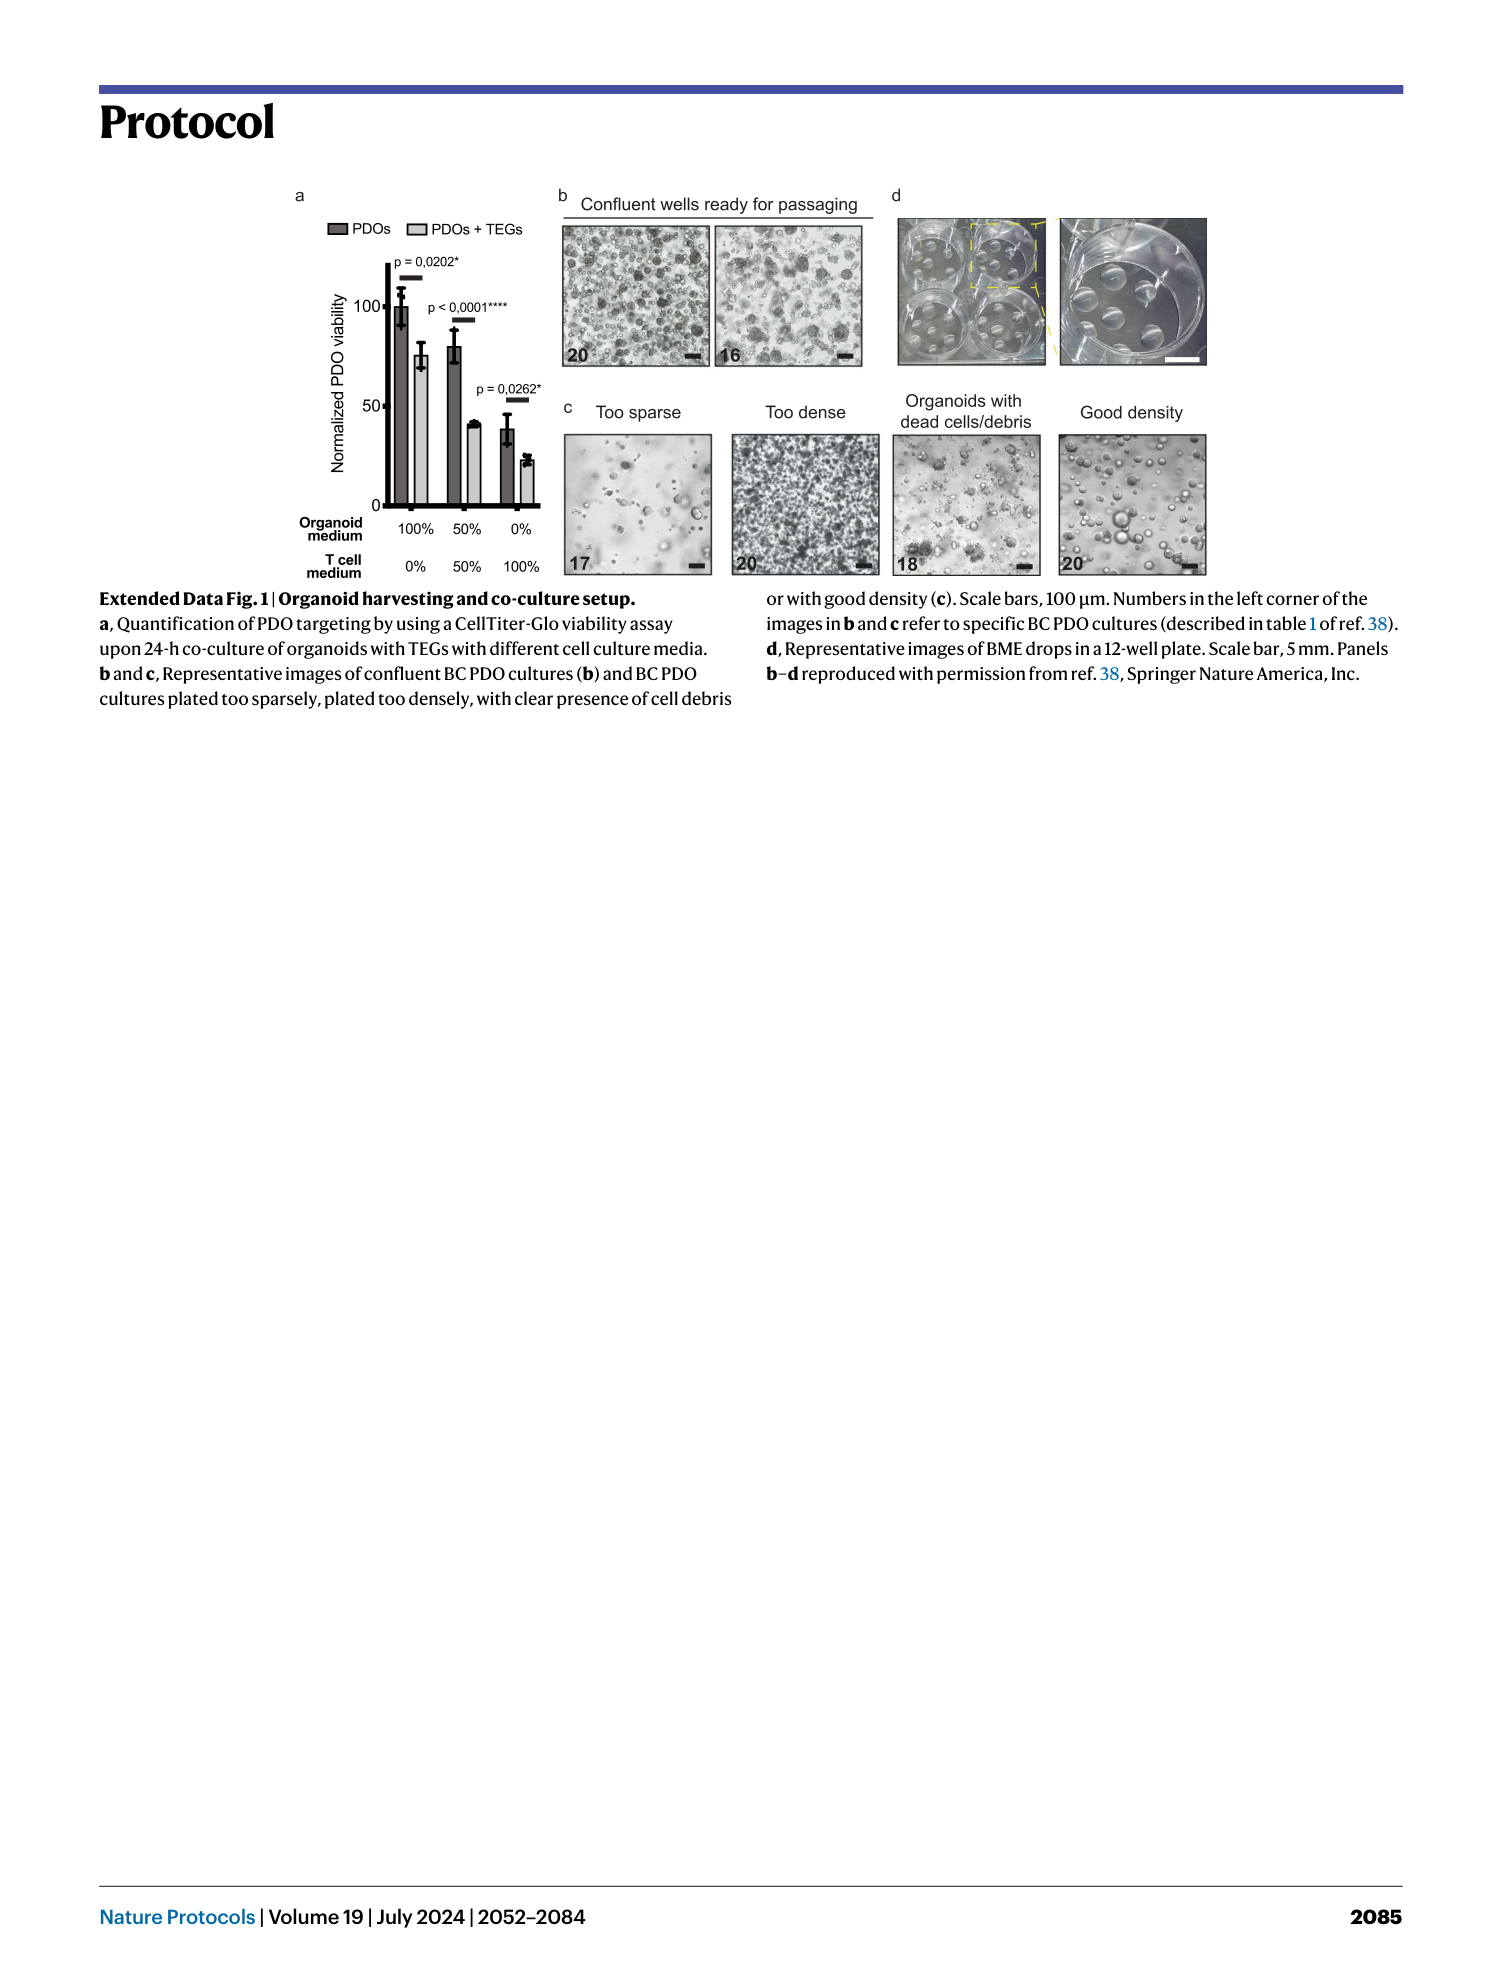
Extended Data Fig. 1 Organoid harvesting and co-culture setup.
a , Quantification of PDO targeting by using a CellTiter-Glo viability assay upon 24-h co-culture of organoids with TEGs with different cell culture media. b and c , Representative images of confluent BC PDO cultures ( b ) and BC PDO cultures plated too sparsely, plated too densely, with clear presence of cell debris or with good density ( c ). Scale bars, 100 μm. Numbers in the left corner of the images in b and c refer to specific BC PDO cultures (described in table 1 of ref. 38 ). d , Representative images of BME drops in a 12-well plate. Scale bar, 5 mm. Panels b–d reproduced with permission from ref. 38 , Springer Nature America, Inc.
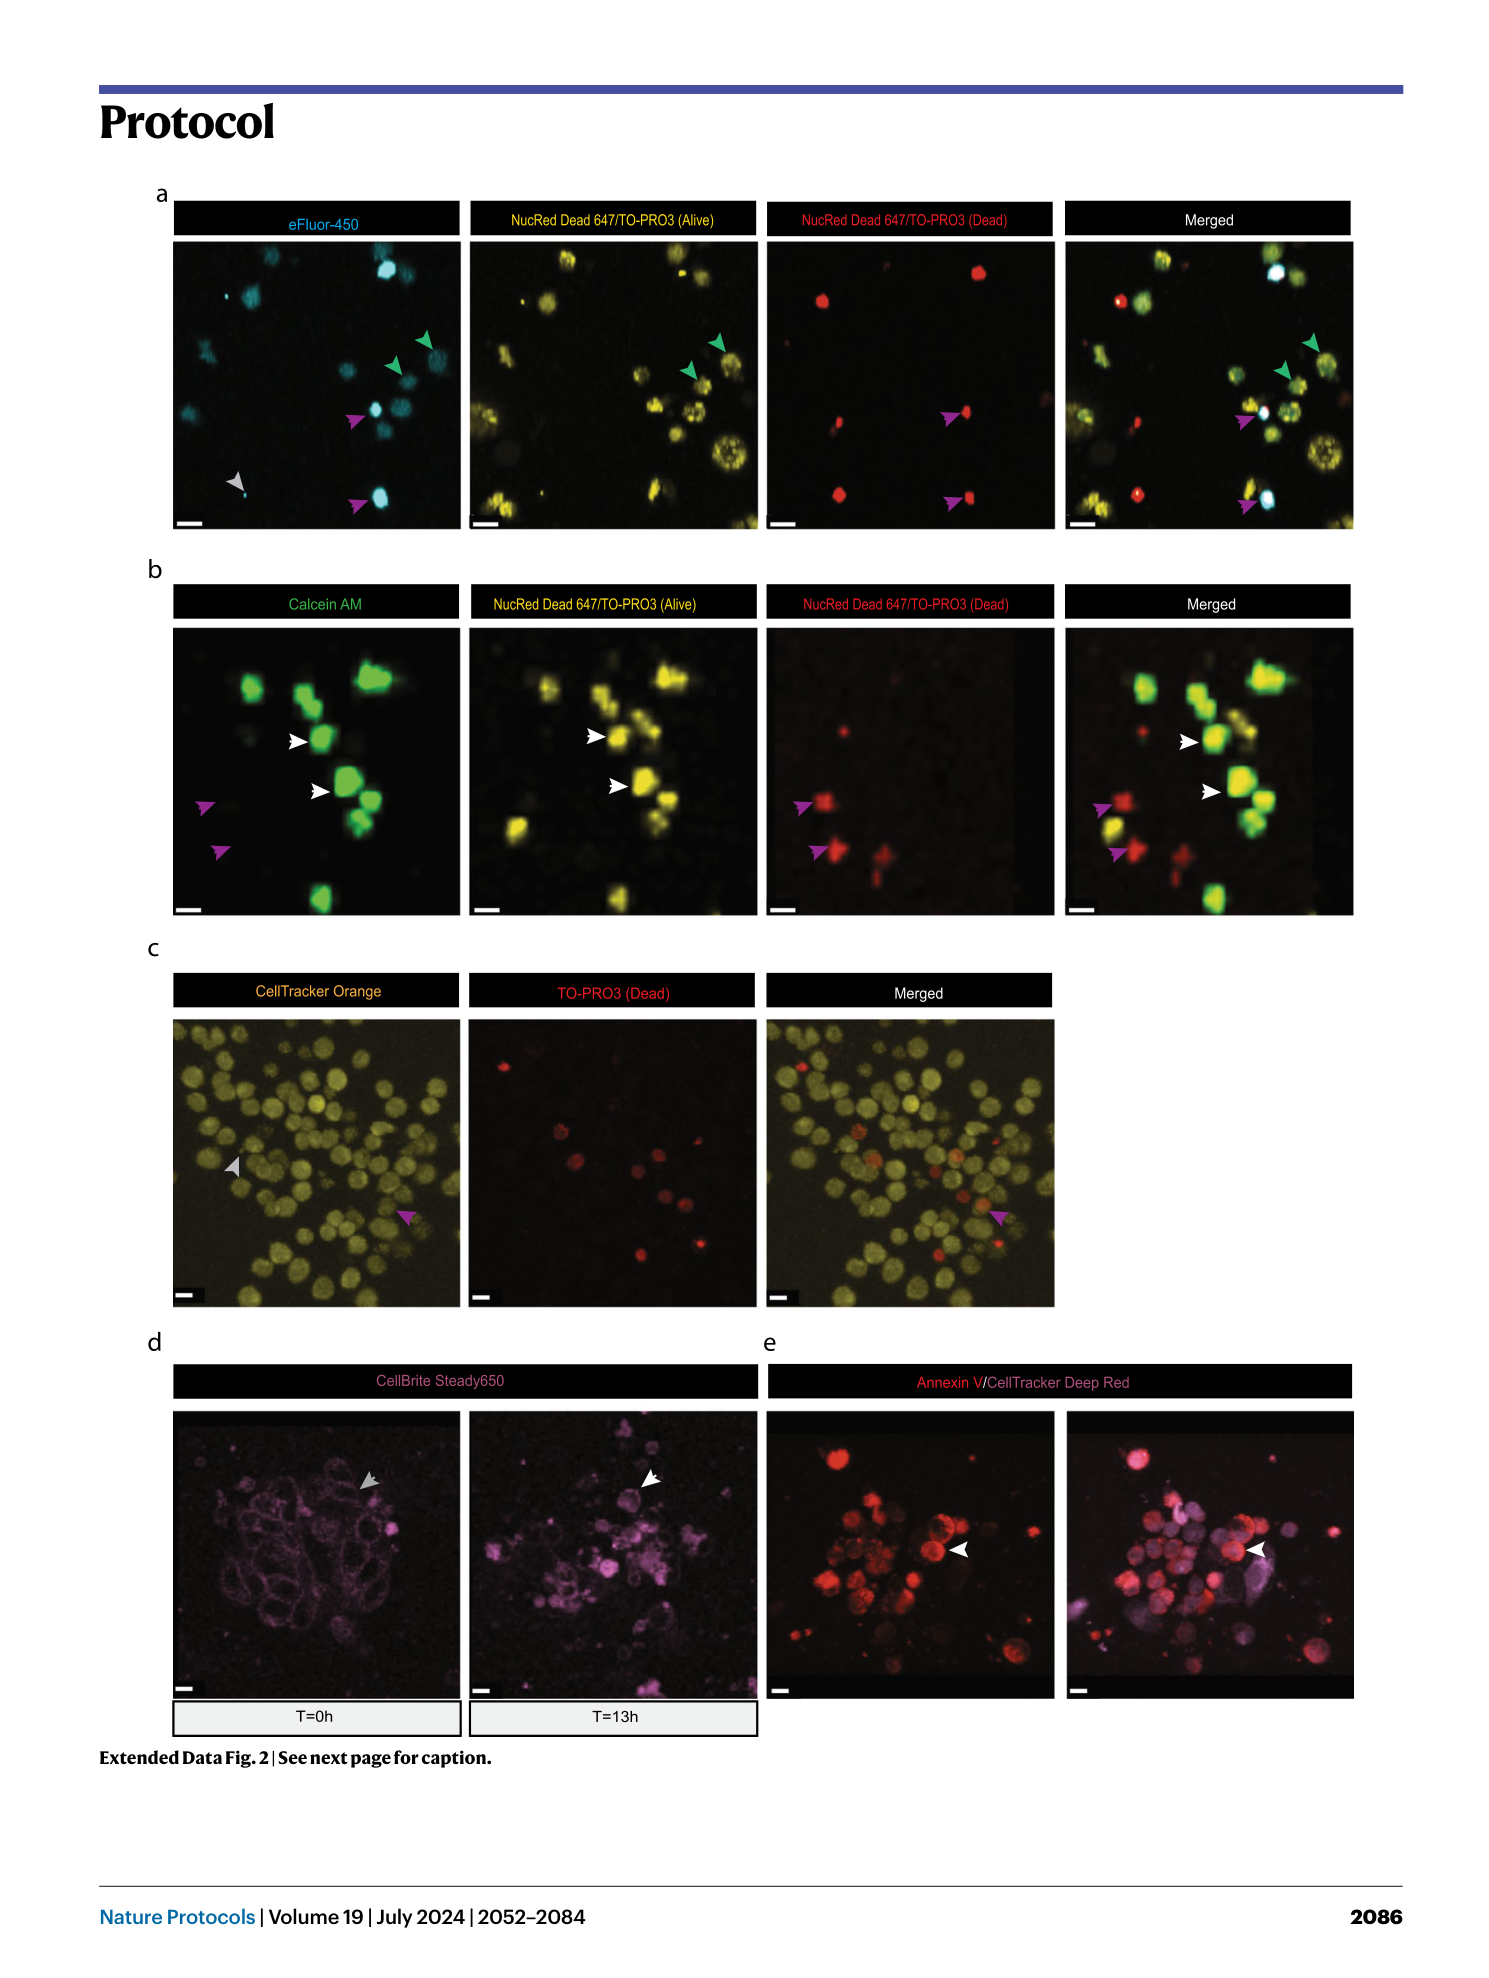
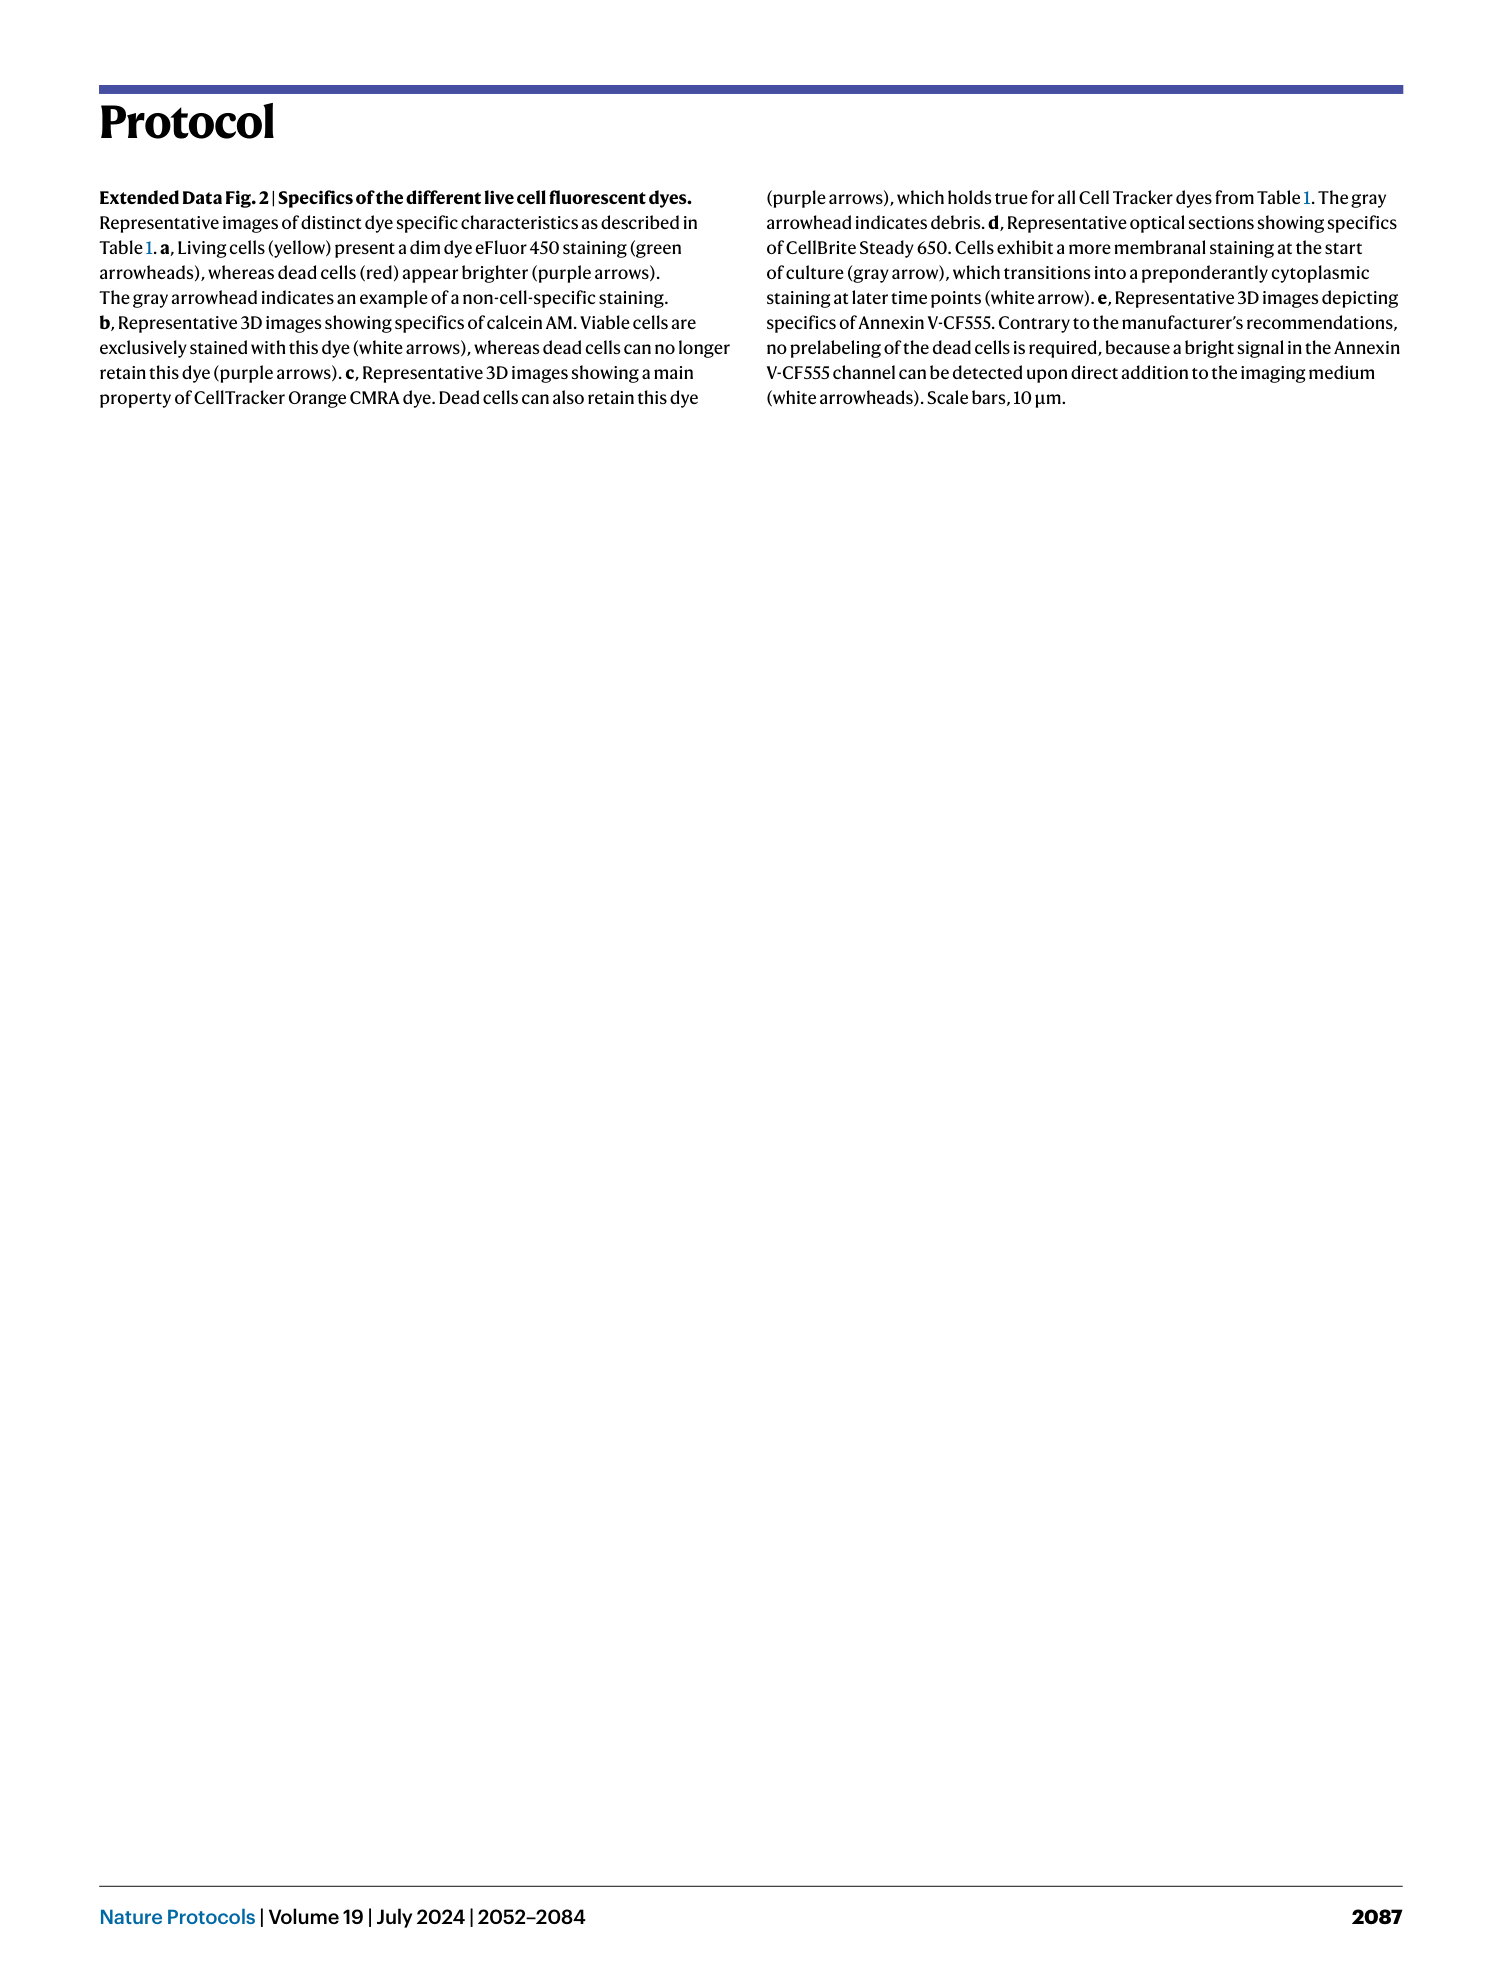
Extended Data Fig. 2 Specifics of the different live cell fluorescent dyes.
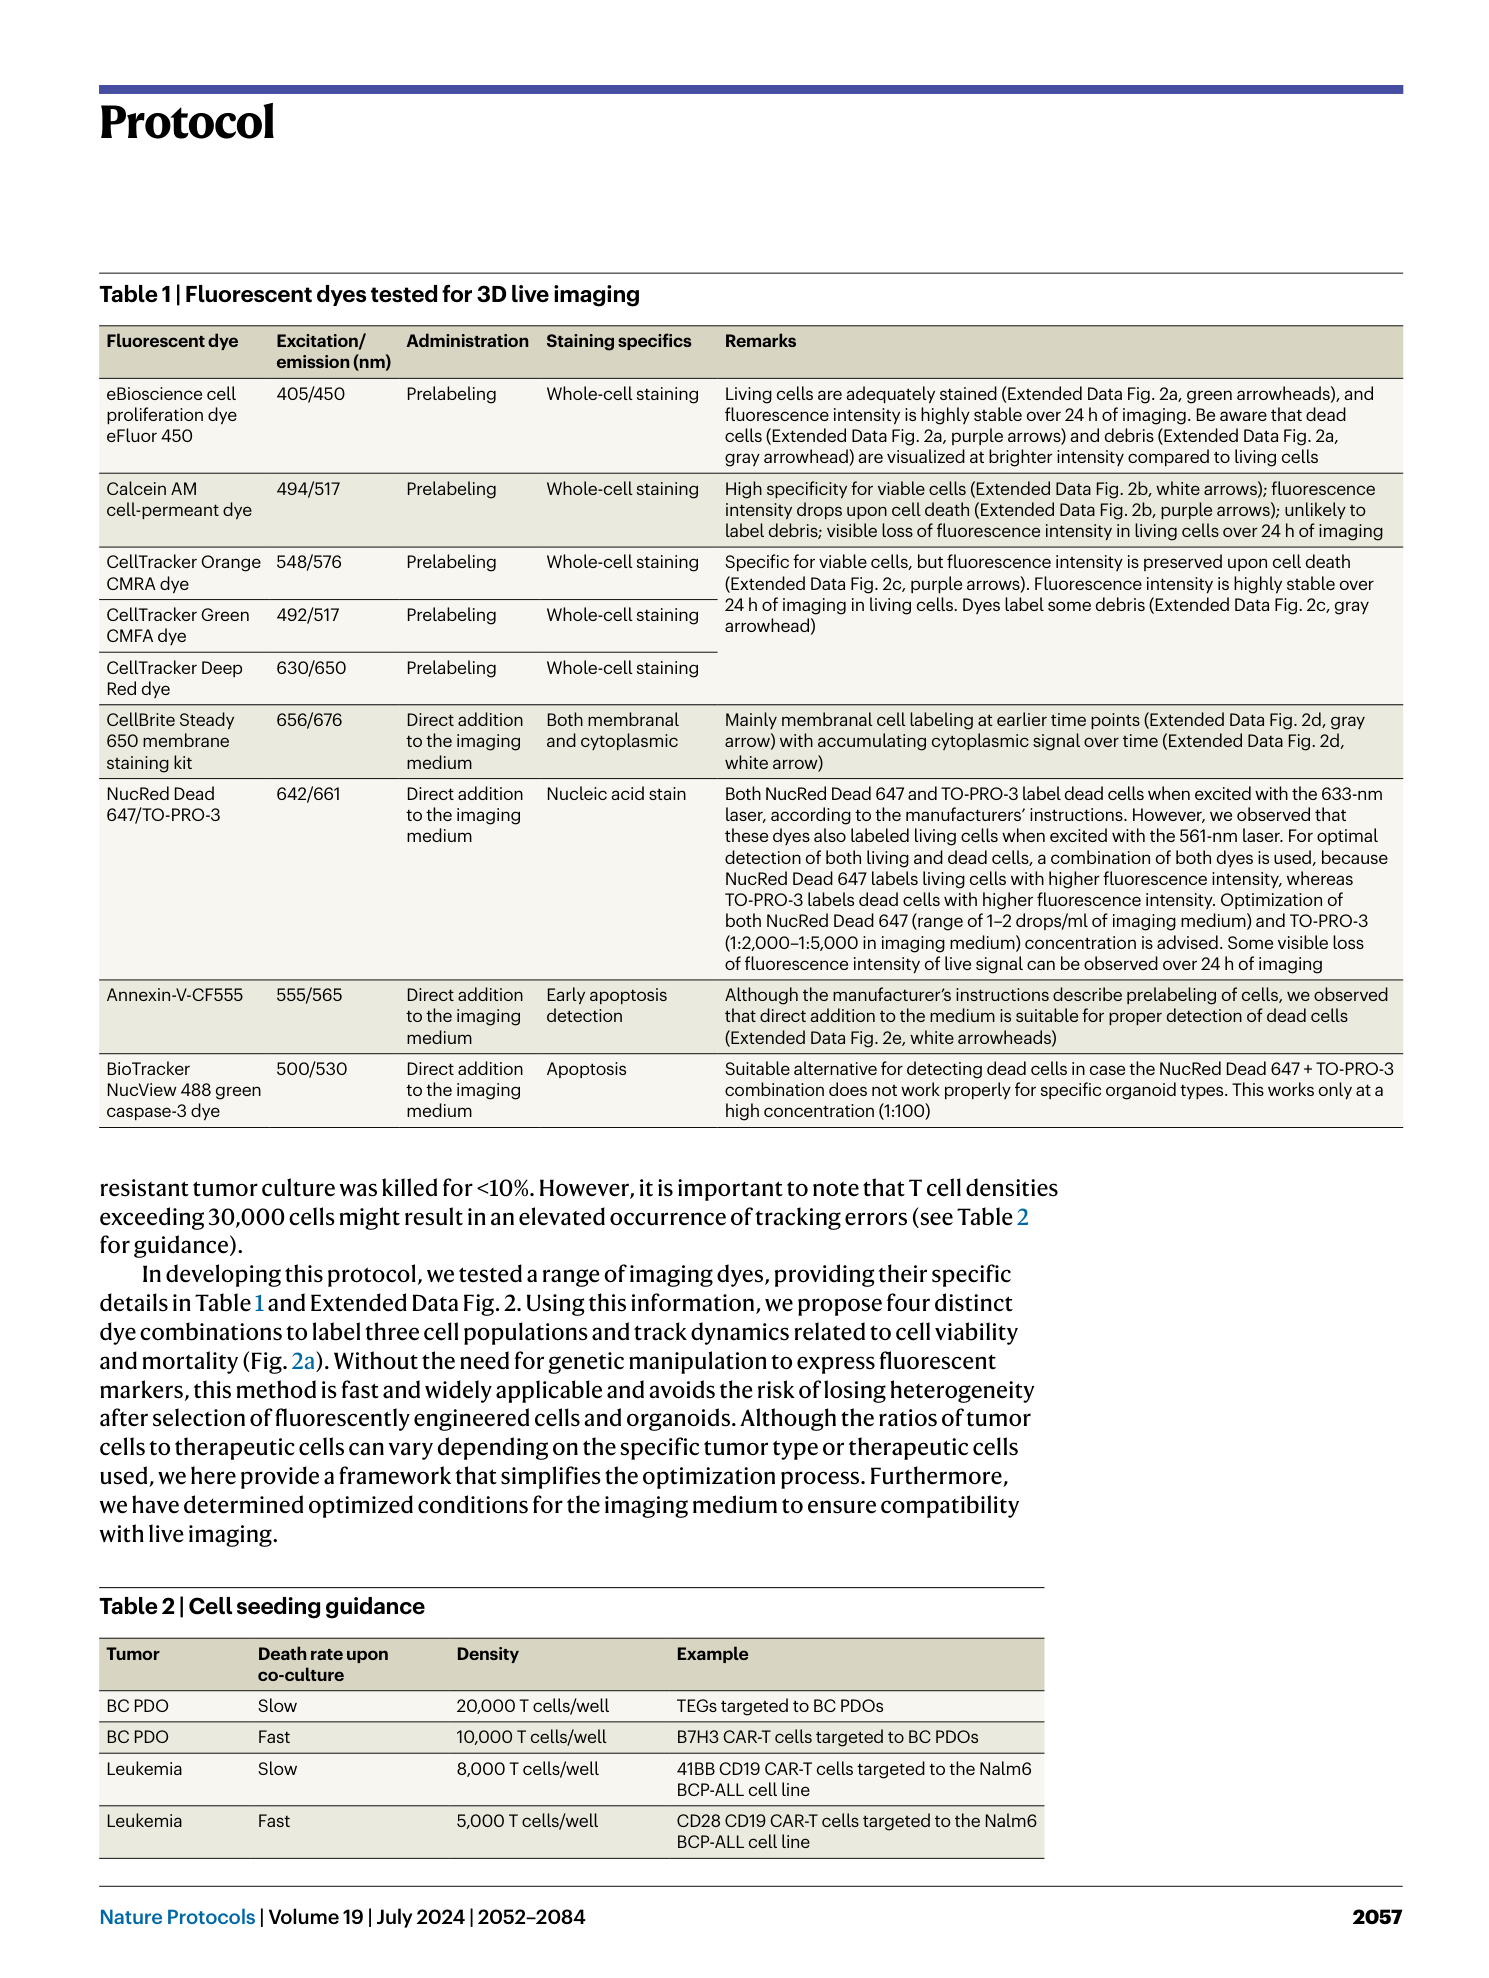
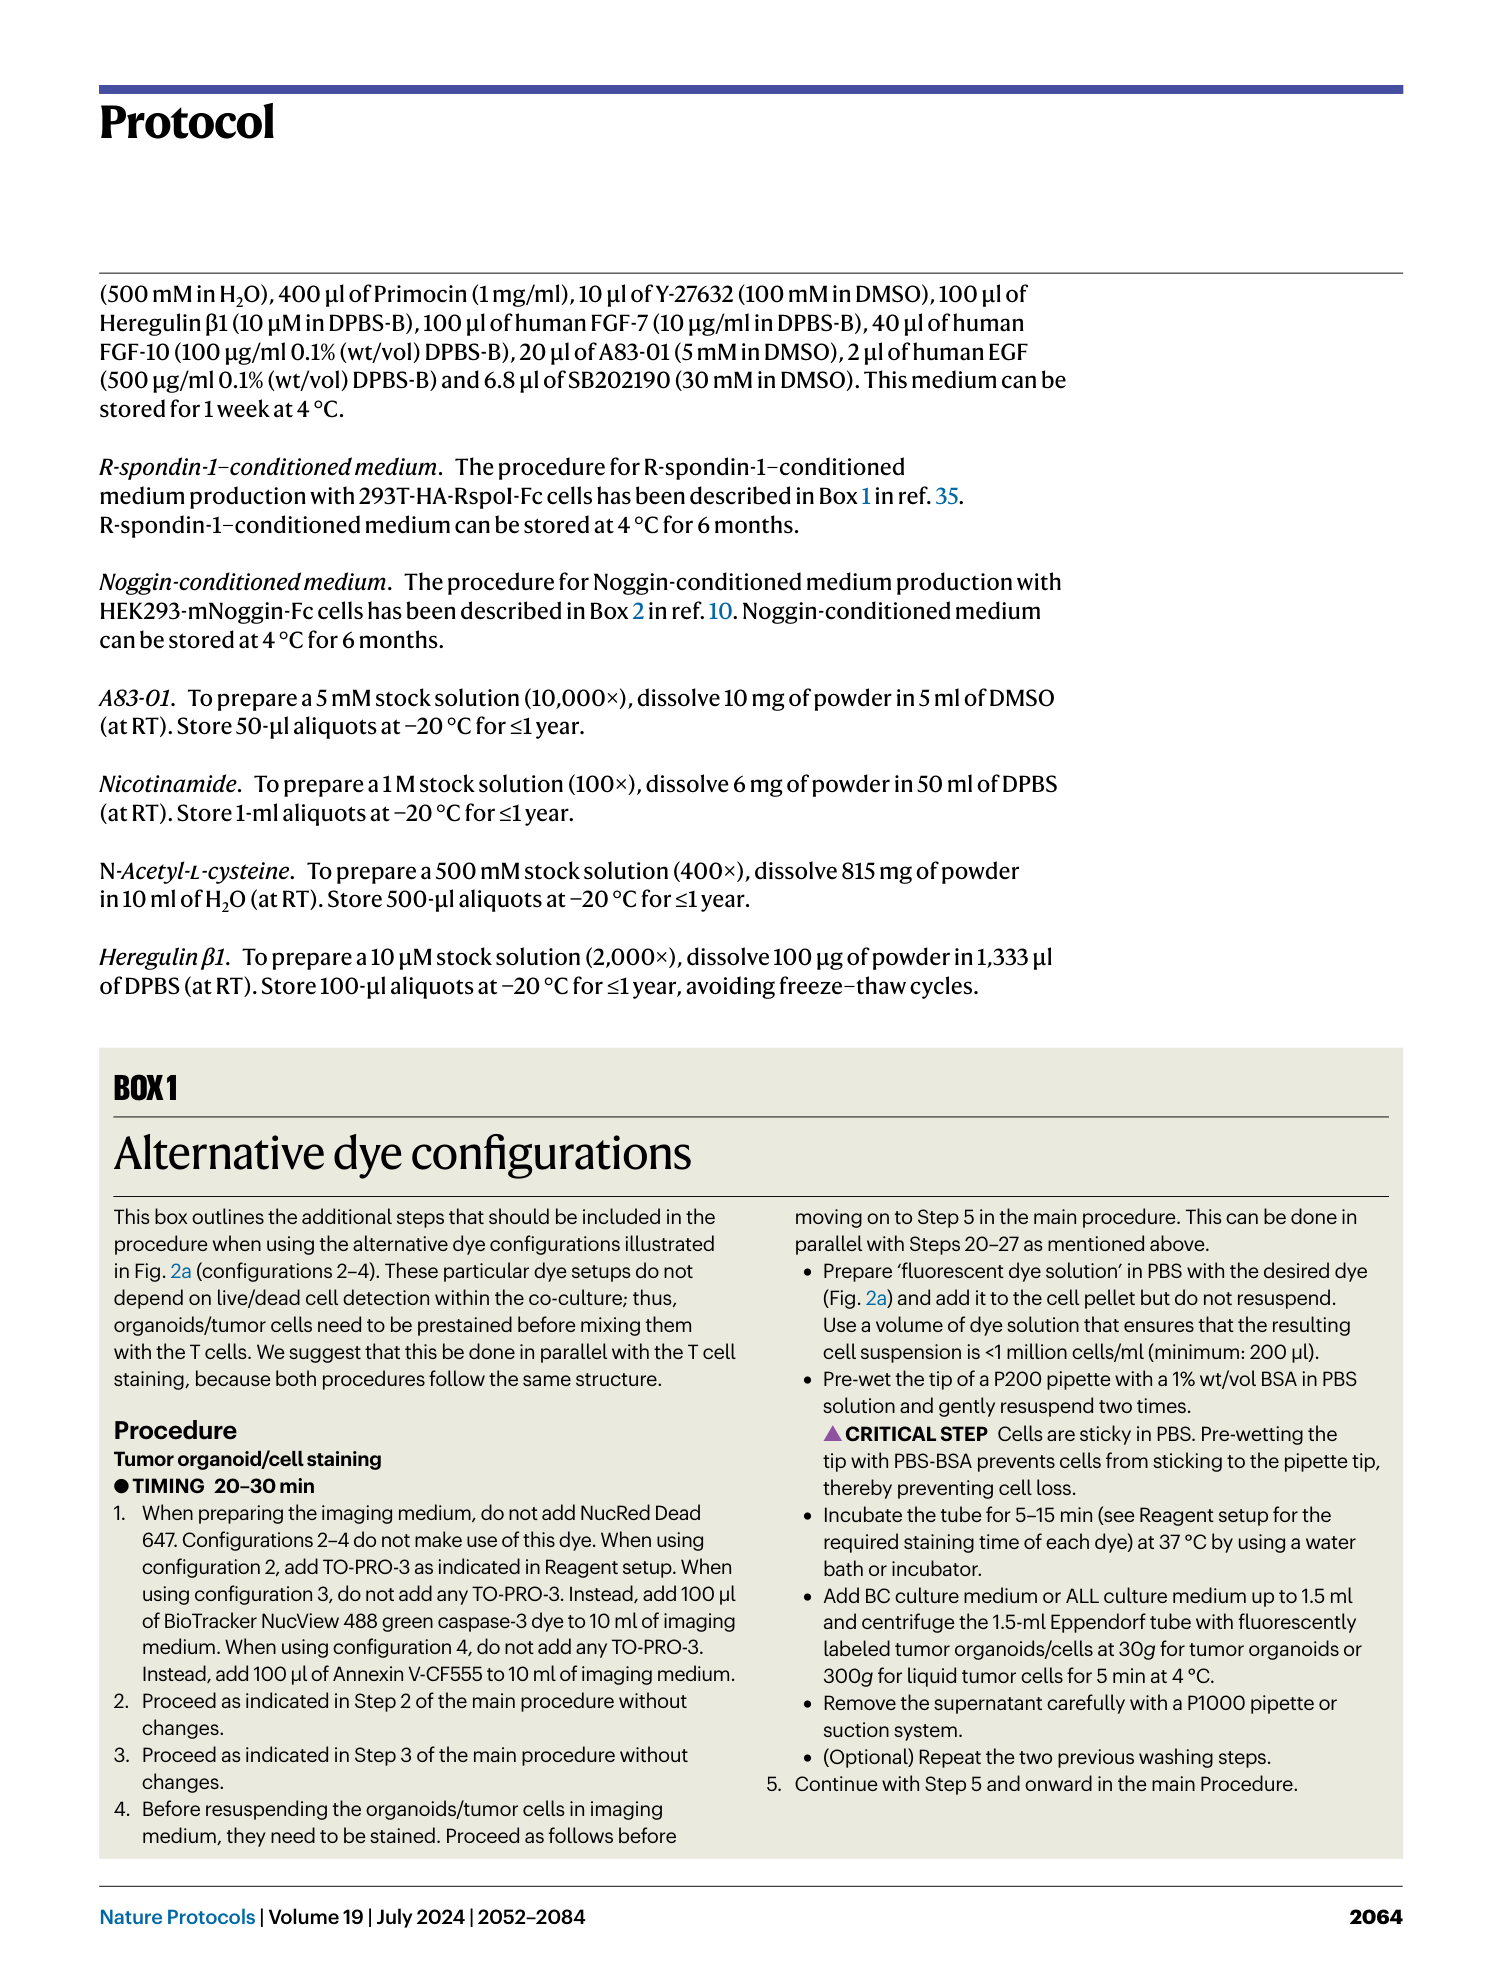
Representative images of distinct dye specific characteristics as described in Table 1 . a , Living cells (yellow) present a dim dye eFluor 450 staining (green arrowheads), whereas dead cells (red) appear brighter (purple arrows). The gray arrowhead indicates an example of a non-cell-specific staining. b , Representative 3D images showing specifics of calcein AM. Viable cells are exclusively stained with this dye (white arrows), whereas dead cells can no longer retain this dye (purple arrows). c , Representative 3D images showing a main property of CellTracker Orange CMRA dye. Dead cells can also retain this dye (purple arrows), which holds true for all Cell Tracker dyes from Table 1 . The gray arrowhead indicates debris. d , Representative optical sections showing specifics of CellBrite Steady 650. Cells exhibit a more membranal staining at the start of culture (gray arrow), which transitions into a preponderantly cytoplasmic staining at later time points (white arrow). e , Representative 3D images depicting specifics of Annexin V-CF555. Contrary to the manufacturer’s recommendations, no prelabeling of the dead cells is required, because a bright signal in the Annexin V-CF555 channel can be detected upon direct addition to the imaging medium (white arrowheads). Scale bars, 10 µm.
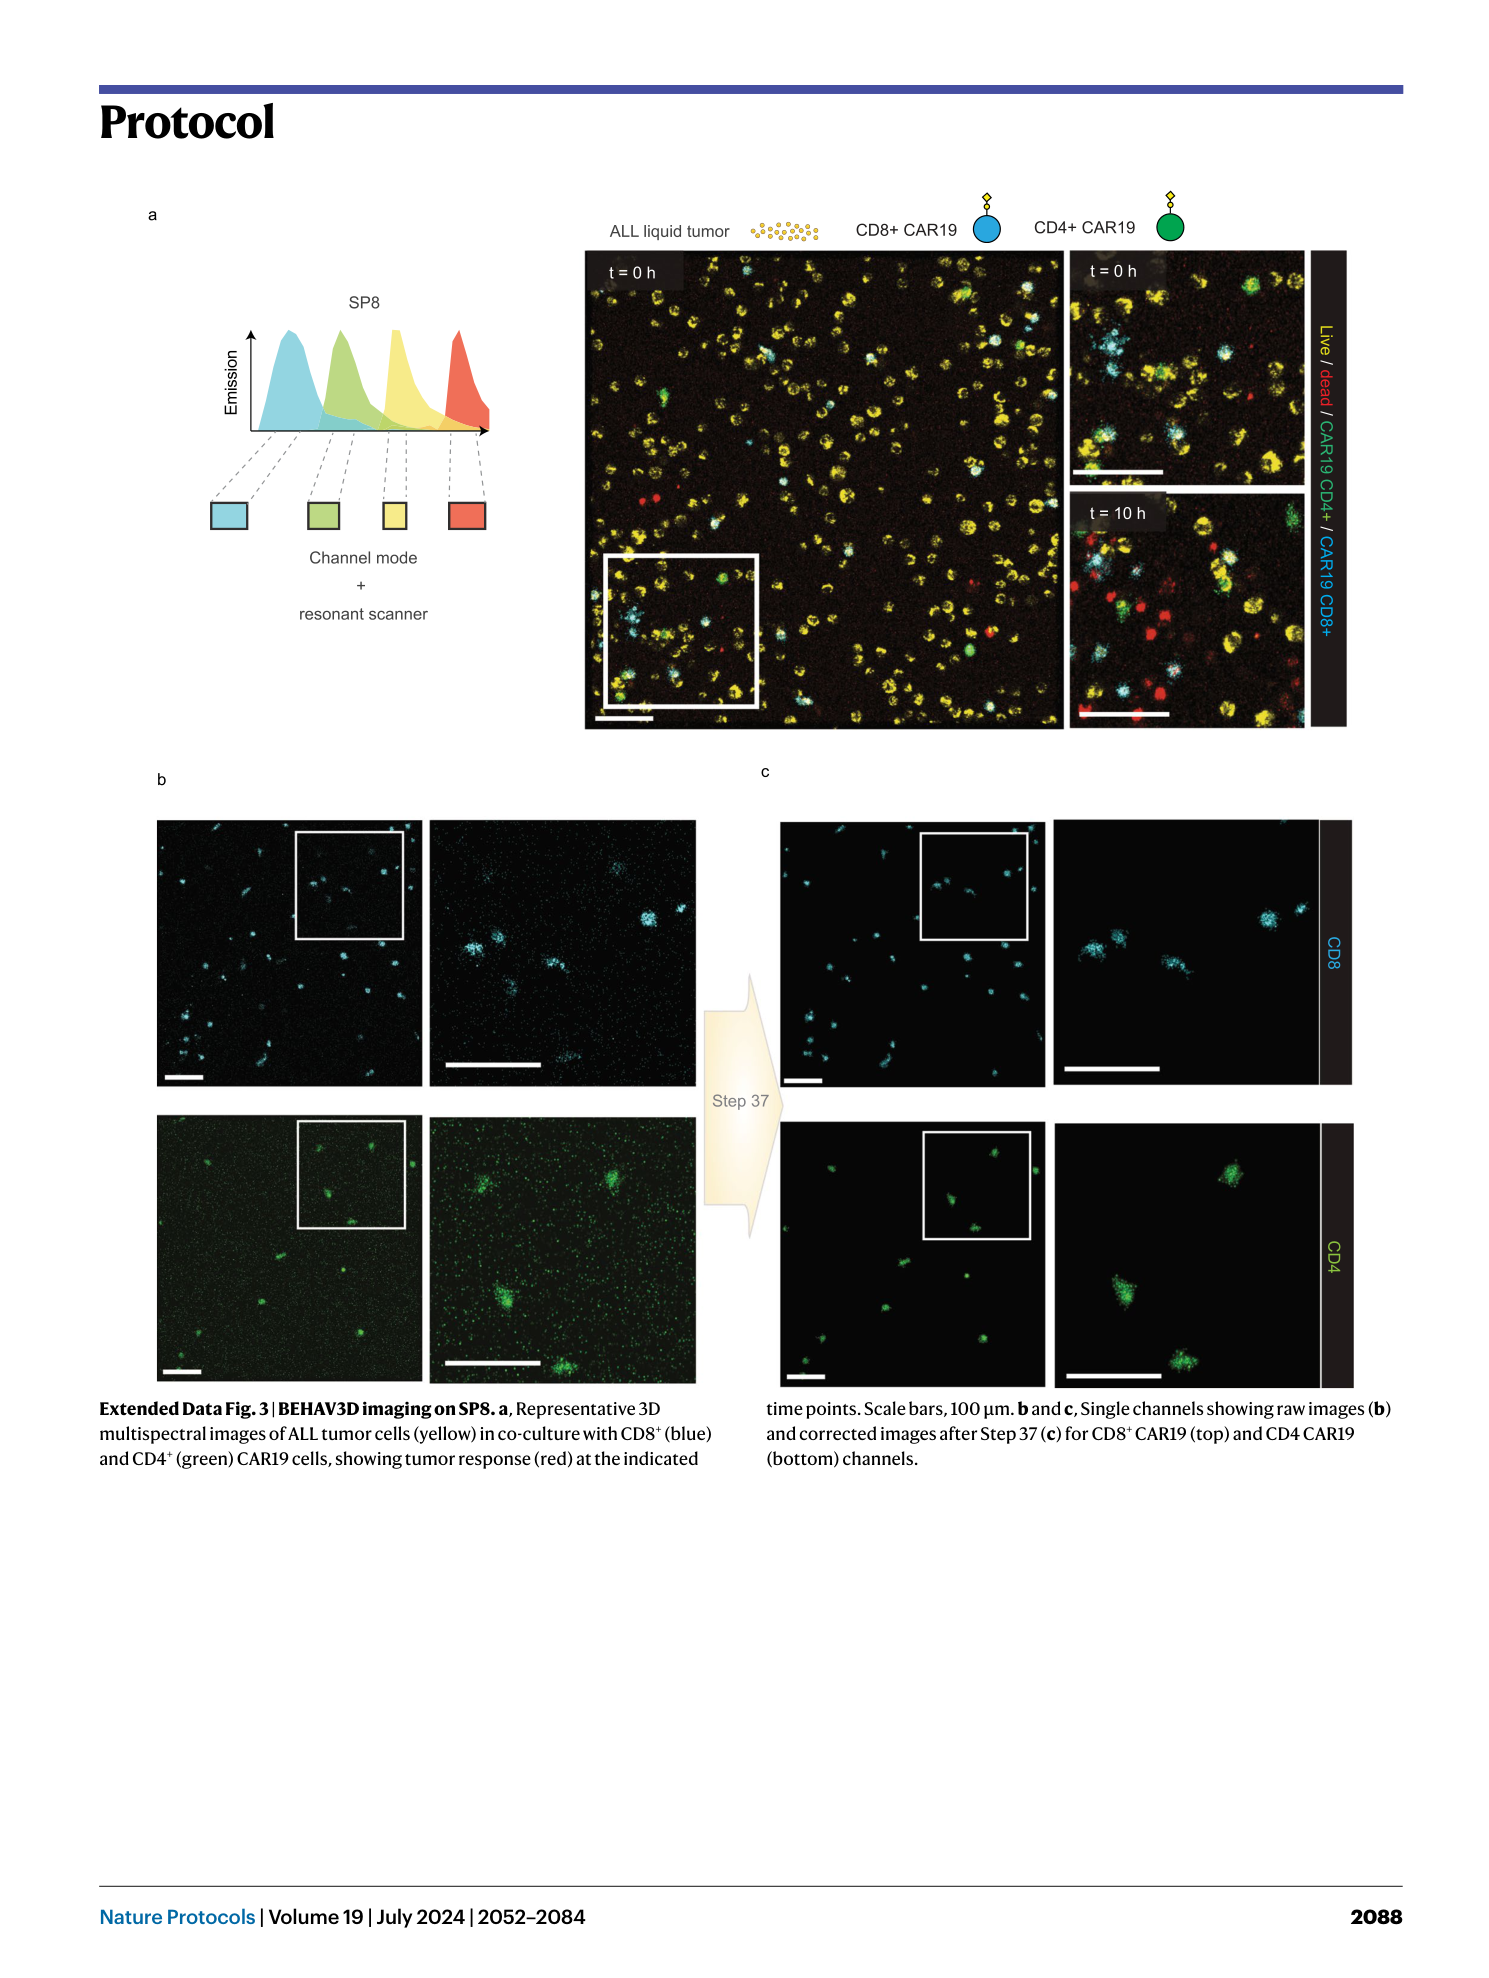
Extended Data Fig. 3 BEHAV3D imaging on SP8.
a , Representative 3D multispectral images of ALL tumor cells (yellow) in co-culture with CD8 + (blue) and CD4 + (green) CAR19 cells, showing tumor response (red) at the indicated time points. Scale bars, 100 µm. b and c , Single channels showing raw images ( b ) and corrected images after Step 37 ( c ) for CD8 + CAR19 (top) and CD4 CAR19 (bottom) channels.
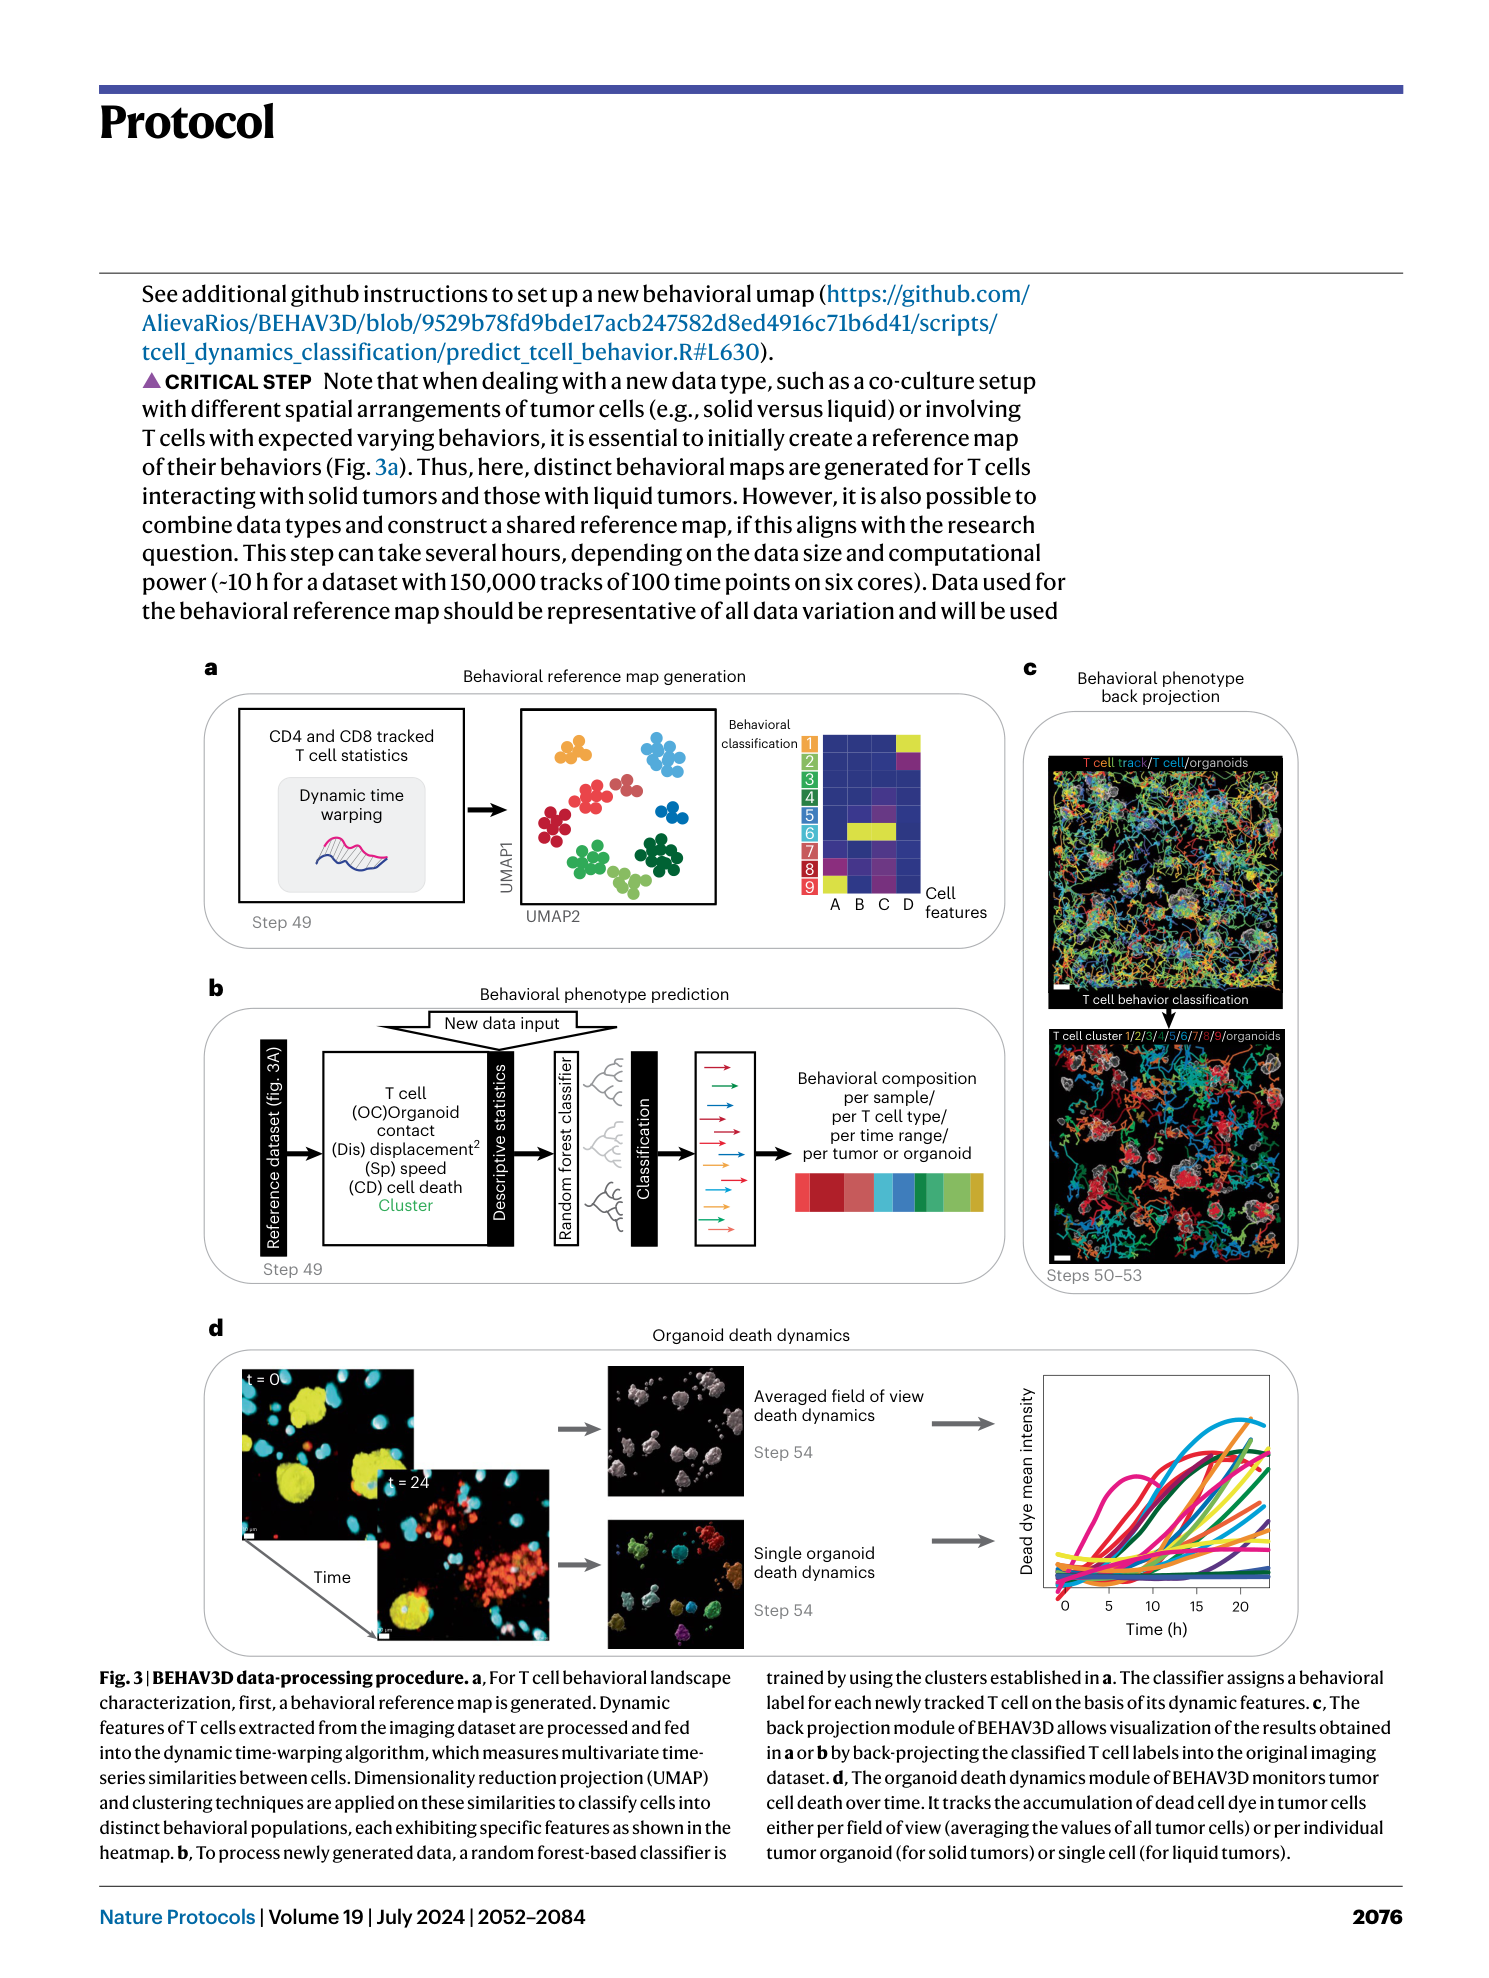
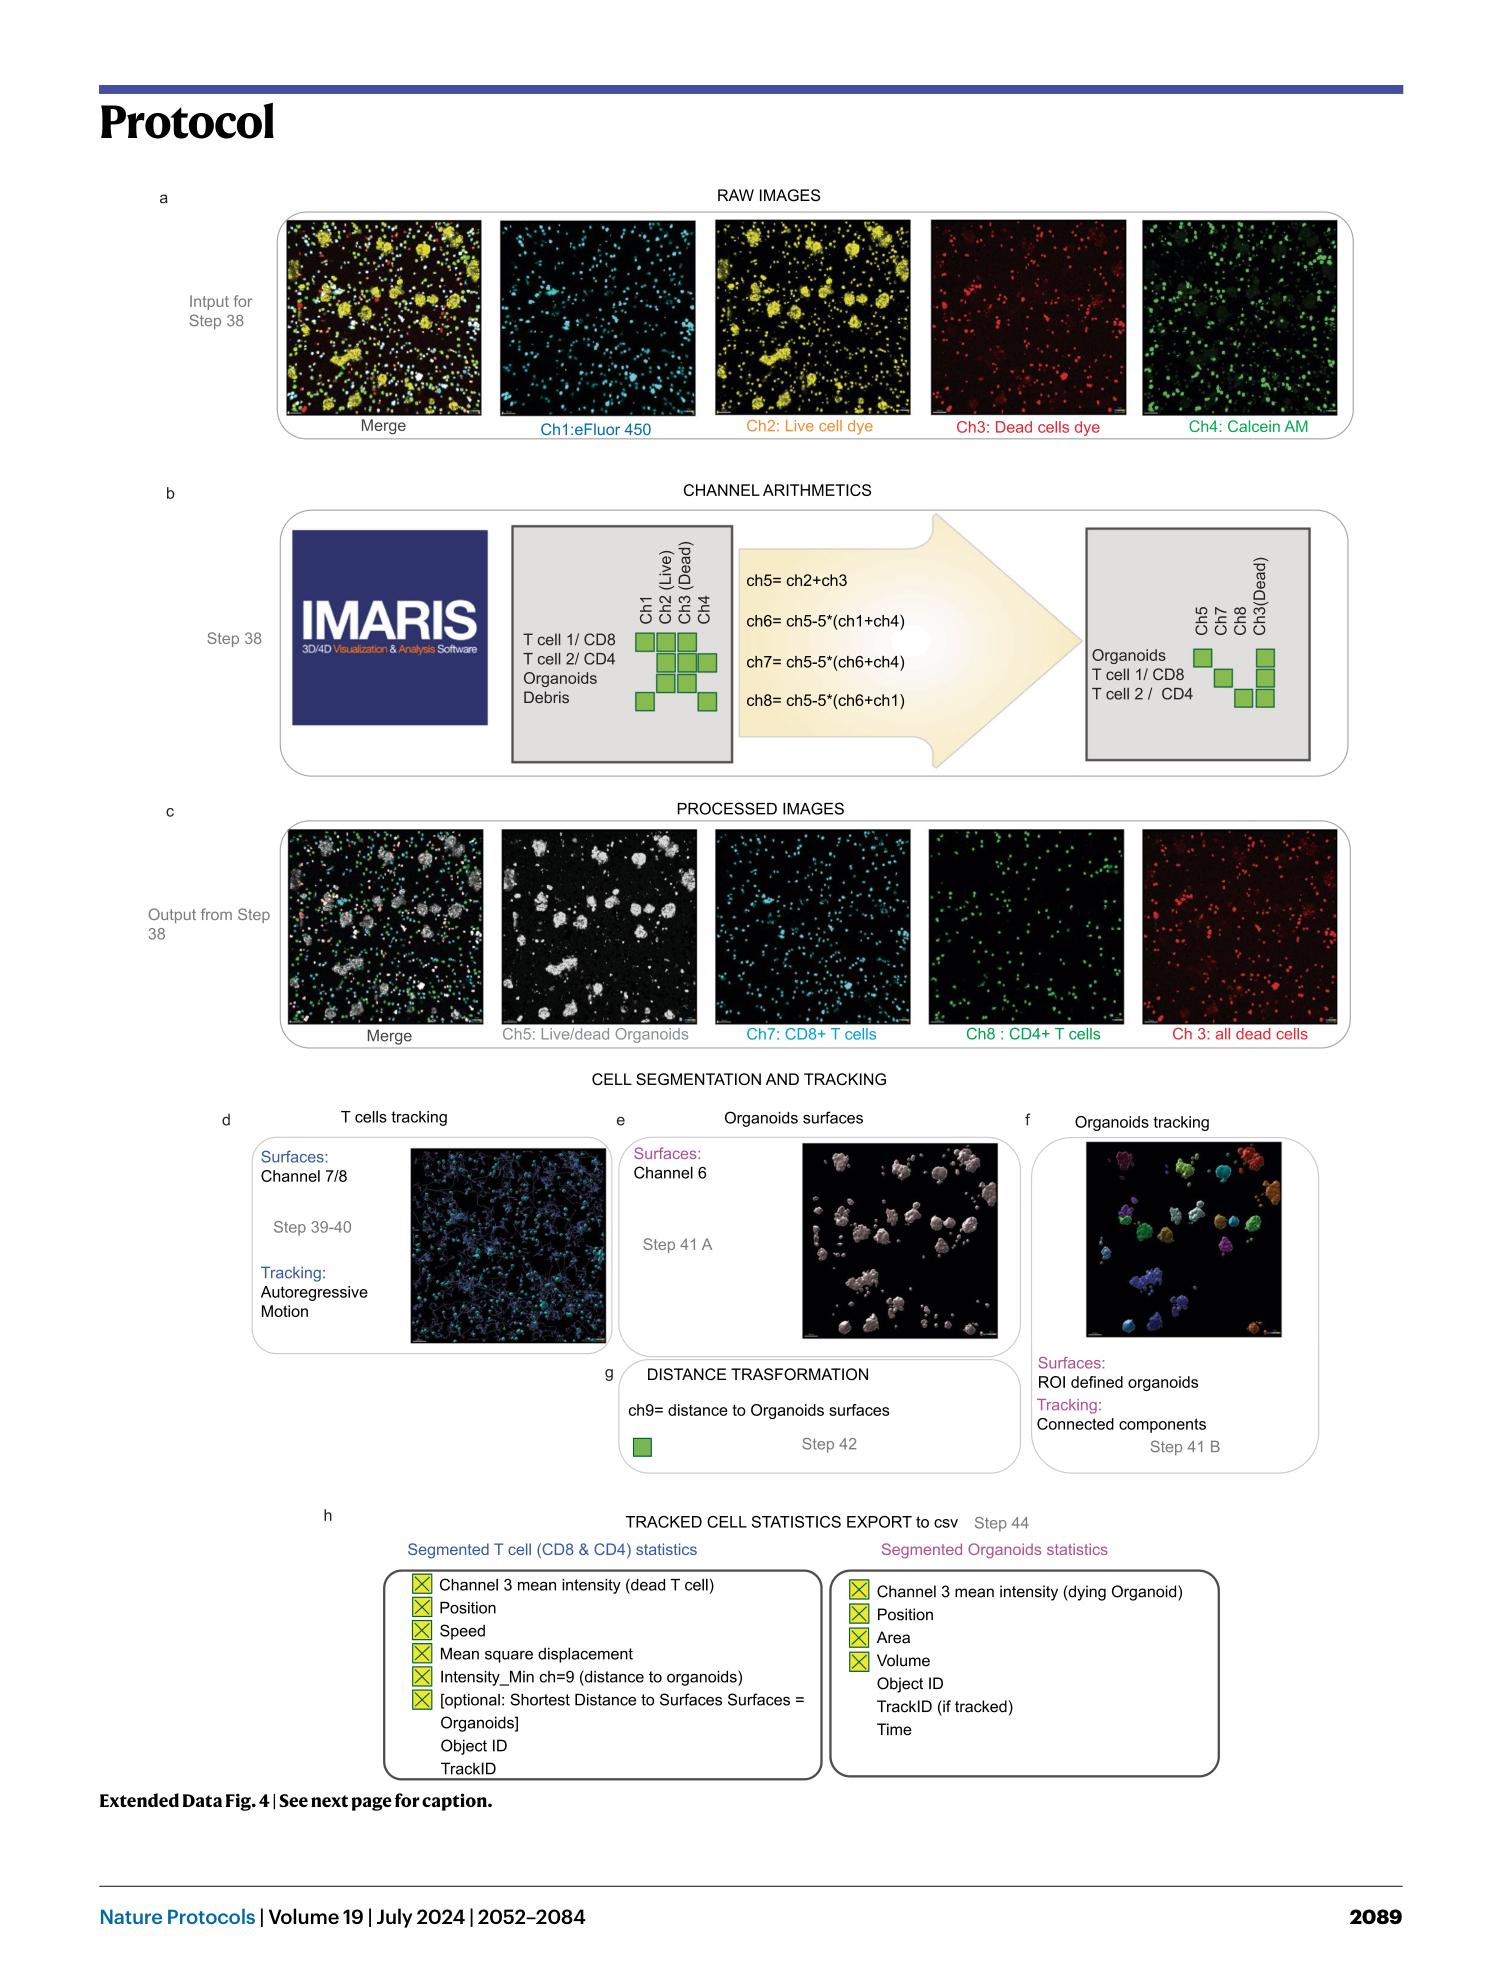
Extended Data Fig. 4 Example of the BEHAV3D image-processing procedure.
a , Representative overlayed and single-channel images of an example dataset consisting of PDOs in co-culture with CD4 + and CD8 + TEGs. These images are used as input for Step 38 explained in b . b and c , Channel arithmetic’s procedure and formulas described in Step 38 ( b ) that generate new image channels with cell-specific signal ( c ). d , Schematic representation of T cell segmentation and tracking in Steps 39 and 40. Channels 7 or 8 are taken as input for either CD8 + T cell or CD4 + T cell tracking. An autoregressive motion algorithm is used for tracking. e , Schematic representation of organoid segmentation in Step 41A for population-based death dynamics monitoring. f , Schematic representation of single organoid tracking in Step 41B. ROIs are defined around each individual organoid to facilitate their separation. A connected components algorithm is used for tracking. g , Optionally, distance transformation in Step 42 can be used to generate a new channel that represents the distance to organoid surfaces. h , T cell and tumor cell dynamic statistics are exported. The yellow boxes indicate the statistics that have to be selected in the statistics tab.
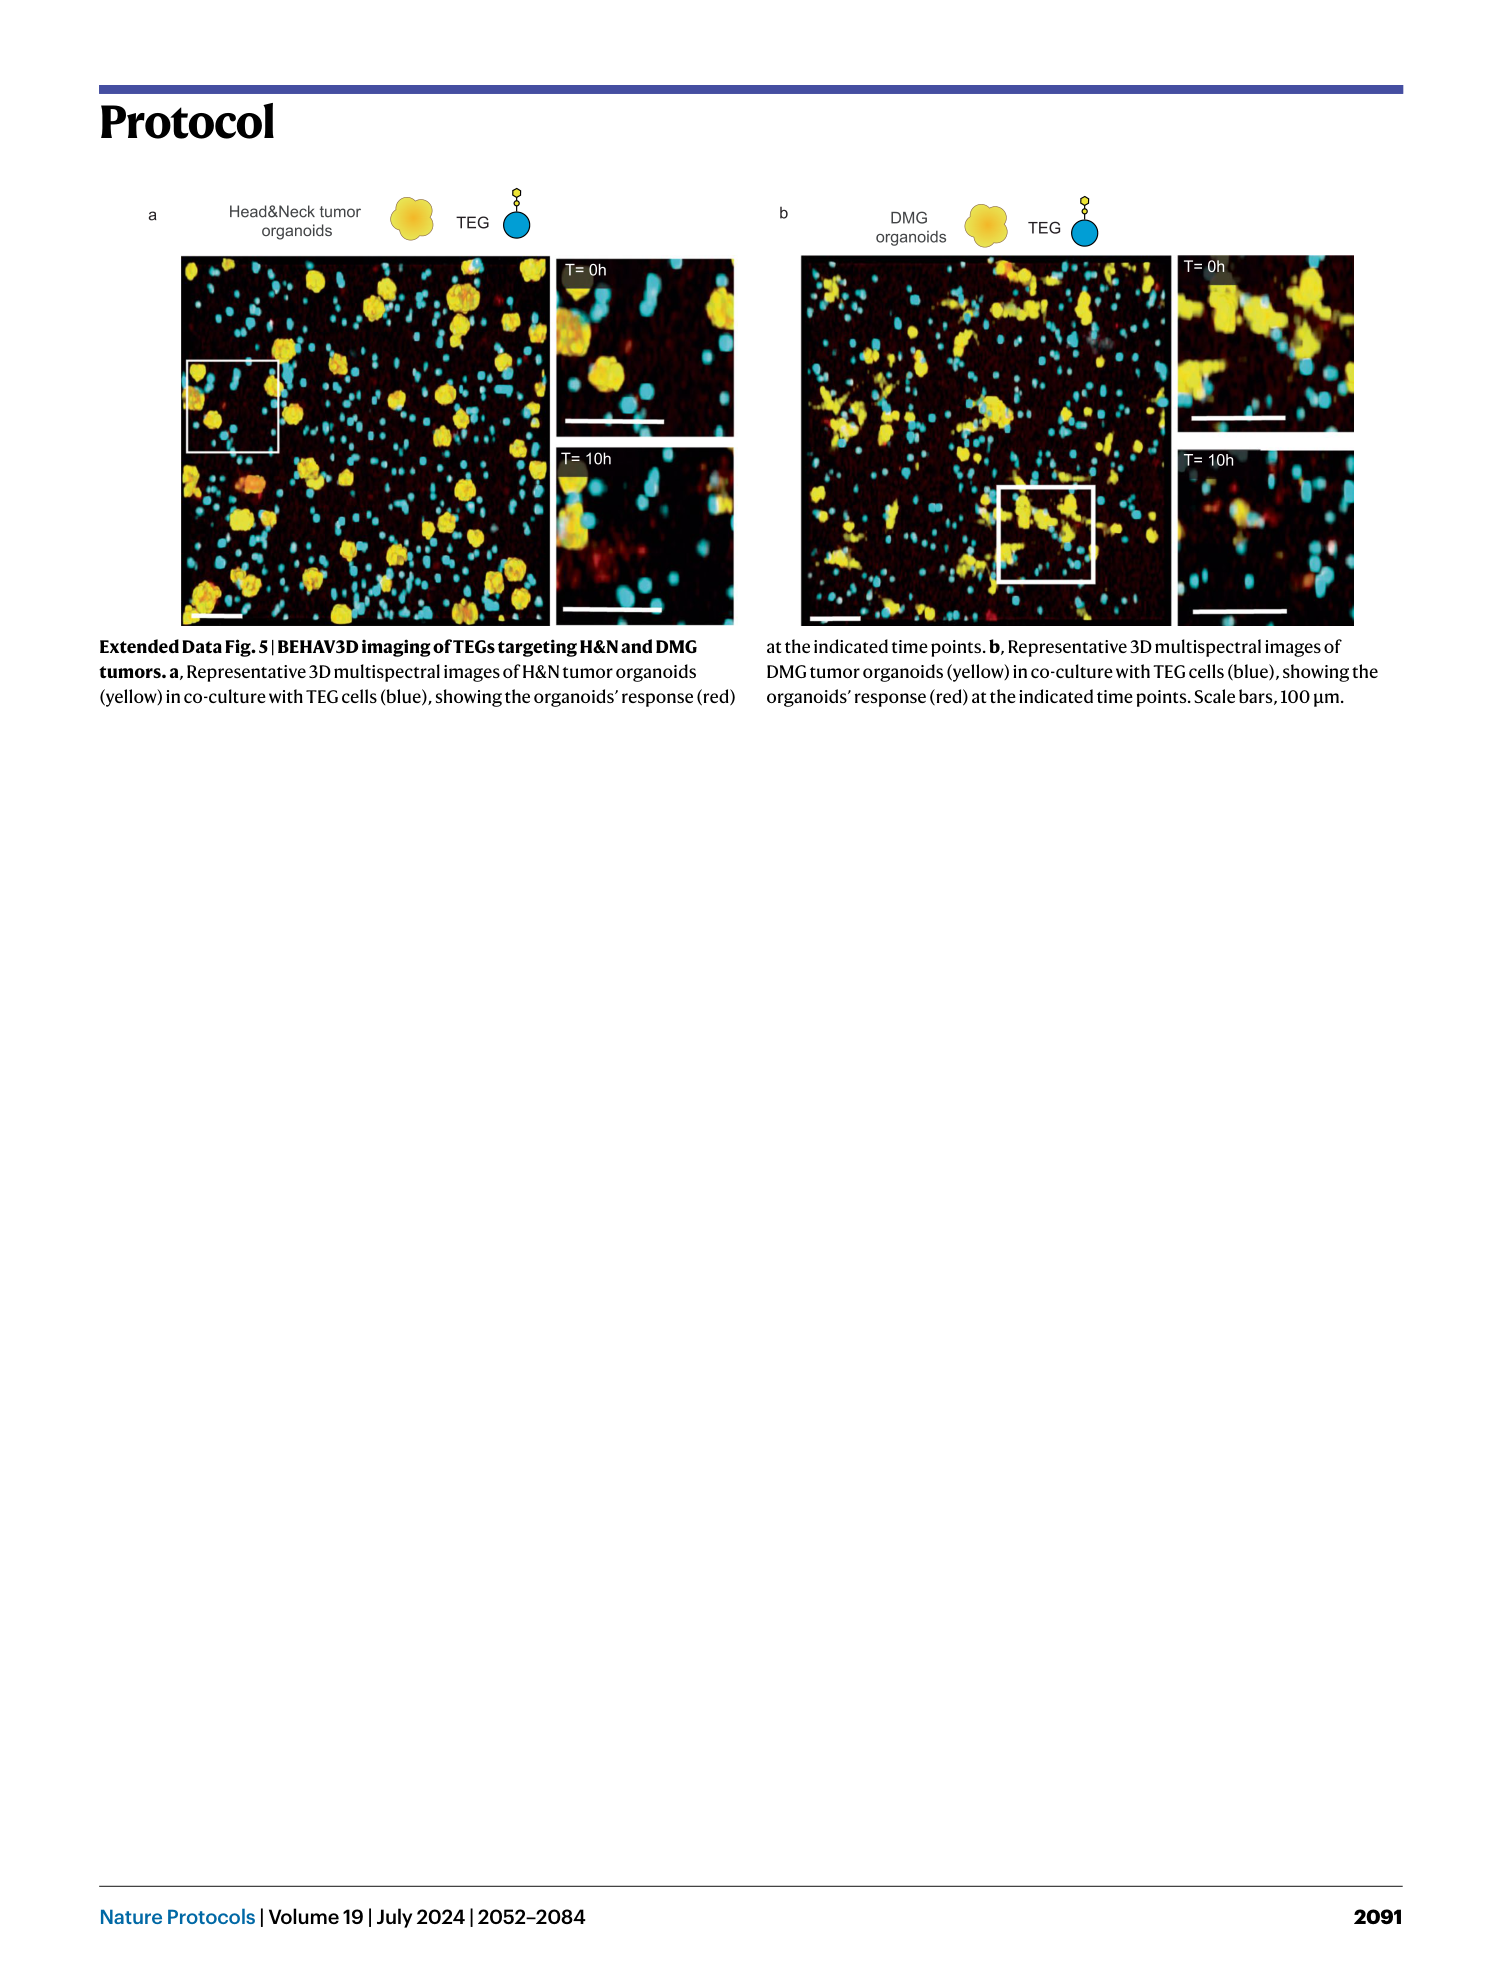
Extended Data Fig. 5 BEHAV3D imaging of TEGs targeting H&N and DMG tumors.
a , Representative 3D multispectral images of H&N tumor organoids (yellow) in co-culture with TEG cells (blue), showing the organoids’ response (red) at the indicated time points. b , Representative 3D multispectral images of DMG tumor organoids (yellow) in co-culture with TEG cells (blue), showing the organoids’ response (red) at the indicated time points. Scale bars, 100 µm.
Supplementary information
Supplementary Information
Supplementary Methods and Figs. 1 and 2
Supplementary Video 1
Representative video of an imaging experiment performed on the Zeiss LSM 880. The left panel displays raw imaging data of a co-culture of CD8 + CAR19 cells (blue), CD4 + CAR19 cells (green) and ALL cells (yellow). Dead dye presence is visualized in red. The right panel displays segmented and tracked data for CD8 + CAR19 cells (blue), CD4 + CAR19 cells (green) and ALL cells (gray). The track of the CAR19 cells represents the cell path over the last hour.
Supplementary Video 2
Representative video of an imaging experiment performed on the Leica SP8. The left panel displays raw imaging data of a co-culture of CD8 + CAR19 cells (blue), CD4 + CAR19 cells (green) and ALL cells (yellow). Dead dye presence is visualized in red. The right panel displays segmented and tracked data for CD8 + CAR19 cells (blue), CD4 + CAR19 cells (green) and ALL cells (gray). The track of the CAR19 cells represents the cell path over the last hour.
Supplementary Video 3
Representative video showing one single TEG cell, displaying morphological plasticity and destroying an entire tumor organoid in over 10 h. The left panel displays raw imaging data with TEG cells (blue) and a BC tumor organoid (yellow). Dead dye presence is visualized in red. The right panel displays segmented and tracked TEG cells (blue) and a BC tumor organoid (gray). The full T cell track is shown in blue.
Supplementary Video 4
Representative video showing one single motile CD8 + CAR19 cell (outlined in purple) performing five tumor cell killings in 8 h. CD8 + CAR19 cells (blue), CD4 + CAR19 cells (green) and ALL cells (yellow). Dead dye presence is visualized in red.
Supplementary Table 1
Table to quantify tracking accuracy metrics
Supplementary Table 2
BEHAV3D metadata template for organoid data processing
Supplementary Table 3
BEHAV3D metadata template for T cell data processing
