A High-Throughput Assay for Quantifying Phenotypic Traits of Microalgae
Phoebe Argyle, Jana Hinners, Nathan G. Walworth, Sinéad Collins, Naomi M. Levine, Martina A. Doblin
Abstract
This outlines a workflow for measuring 10 phenotypic traits of centric diatoms using a variety of methodologies. This method is described in:
Argyle, P. A., Hinners, J., Walworth, N. G., Collins, S., Levine, N. M., & Doblin, M. A. (2021). A high-throughput assay for quantifying phenotypic traits of microalgae. Frontiers in microbiology , 12 , 706235.
Steps
Set up experimental cultures
Experimental cultures are grown in 12-well tissue culture plates. Triplicate cultures per treatment are recommended.
The initial cell concentration should be 2000 cells/mL, but may be altered depending on the anticipated growth.
During developing, 400µL of stock culture at a concentration of 11000 cells/mL was added to 4mL of growth media in each well, resulting in a final volume of 4.4mL at a concentration of 2000 cells/mL.
The concentration of the initial stock culture was measured using flow cytometry as outlined in:
Measuring growth rates of diatom cells in cultureThe stock was then diluted or concentrated using centrifugation 1000x g,20°C to achieve the final concentration of 11000 cells/mL.
NB: The initial concentration of the cultures may be altered depending on anticipated growth, or the species of microalgae being used.
Cultures should be randomised within growth plates. Analysis during method development showed negligible variance due to 'plate' effects, however we recommend position plates randomly within growth incubators and changing their positions daily to minimize potential effects.
Seal plates with breathable seal. These can act in place of the plastic lids of desired.
Equipment
| Value | Label |
|---|---|
| Breathe-Easy® sealing membrane | NAME |
| Plate seal | TYPE |
| Breathe-Easy® | BRAND |
| Z380059-1PAK | SKU |
Track growth
After inoculation, take an initial in vivo fluorescence measurement of each plate using a microplate reader as outlined in :
Measuring growth rates of diatom cells in culture
Return plates to their experimental incubators.
Each day, track the in vivo fluorescence at least one hour after the onset of the photoperiod. During development this would be at 9am, after 'lights on' at 6am, following a 12:12 light cycle.
Light settings may vary depending on the nature of the experiment being conducted.
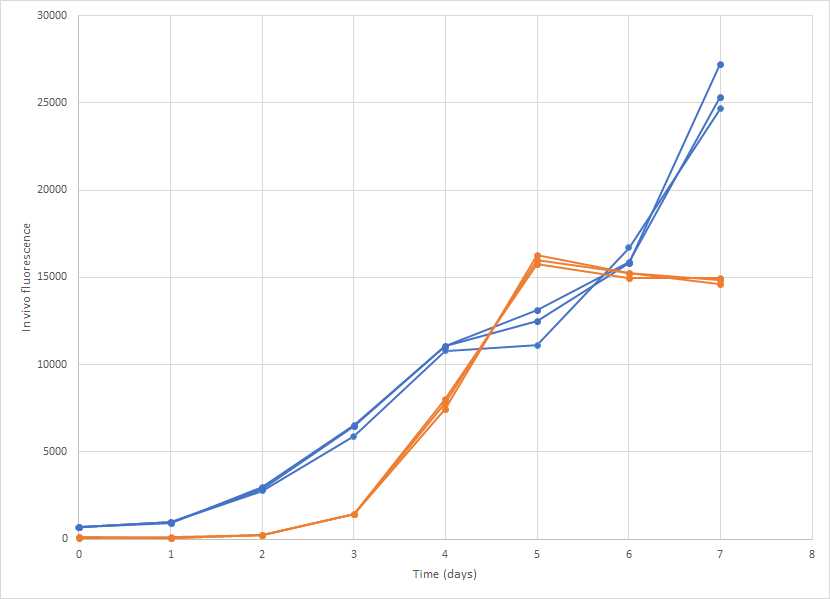
Track the in vivo fluorescence over time, and note the growth phase of the cultures.
Trait measurements are conducted during mid-exponential growth, so some discernment is required to estimate this stage.
For example, in this experiment, the cultures shown in blue are in exponential growth between days 2 and 7, whereas the orange cultures have a short exponential phase between days 2 and 5.
Once the experiment is harvested growth measures can no longer be taken, so if in doubt of the growth phase, an experiment of just the growth may be prudent to anticipate the best time to harvest for trait measurements.

Trait measurements
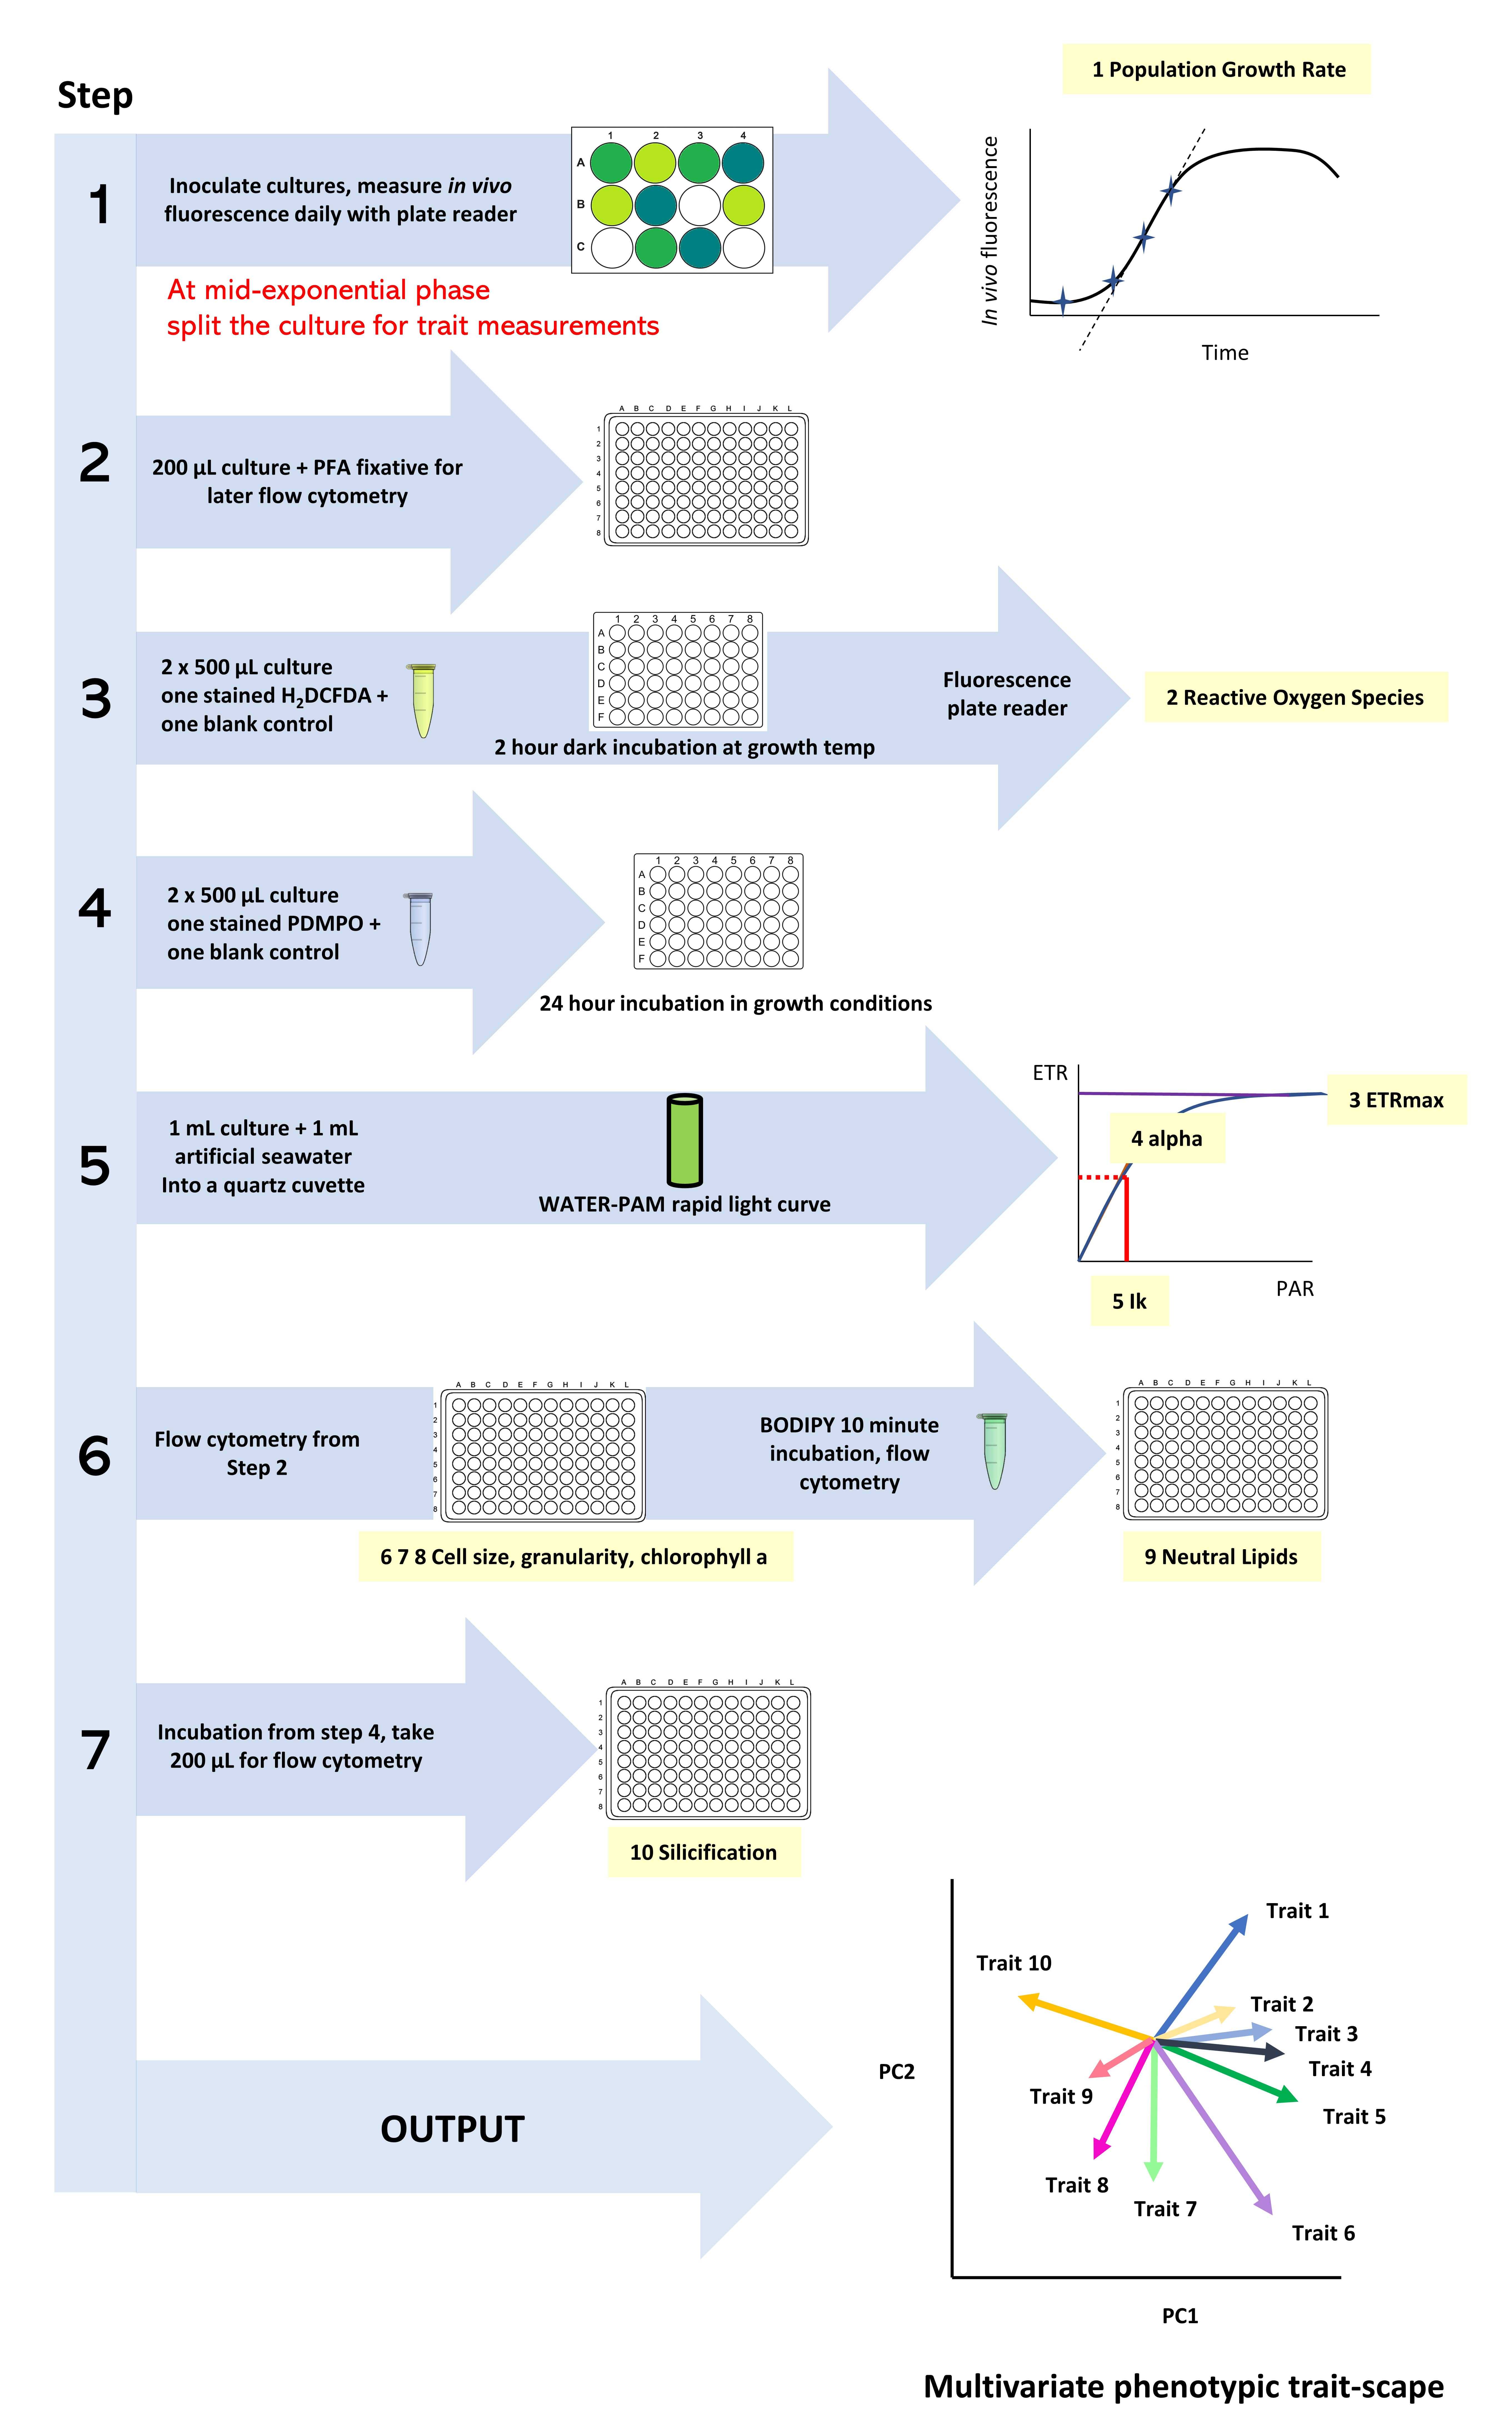
Once a culture has reached mid-exponential phase, trait measurements begin according to the workflow. Note not all culture wells will be ready to harvest on any one day, creating a staggered approach.

Flow cytometry
Taken an aliquot and fix for flow cytometry, according to the protocol:
Flow cytometry trait measurements (size, granularity and chlorophyll-a) of diatoms
Reactive oxygen species
Initiate the Reactive oxygen species assay according to the protocol:
Silicification via PDMPO
Initiate the silicification assay according to the protocol:
LINK TO PDMPO assay to insert after publication
On the following day, when harvesting the next days' cultures, take the aliquots from the previous days' incubation and analyse via flow cytometry (according to the protocol). As this is done in plate-mode, these samples can be analysed while step 10 is completed.
Photophysiolgical traits
Measure the photophysiological traits according to the protocol:
Measuring photophysiological traits of diatoms from Rapid Light Curves using a Water-PAM
Not that during this time, it may be necessary to return to the ROS assay and take the final measurement.
Flow cytometry traits
Conduct flow cytometry analysis of the fixed samples collected in the morning according to the protocol:
Flow cytometry trait measurements (size, granularity and chlorophyll-a) of diatoms
Measure neutral lipids according to the protocol:
Measuring neutral lipids in fixed diatom cells using BODIPY 505/515
Statistical analysis
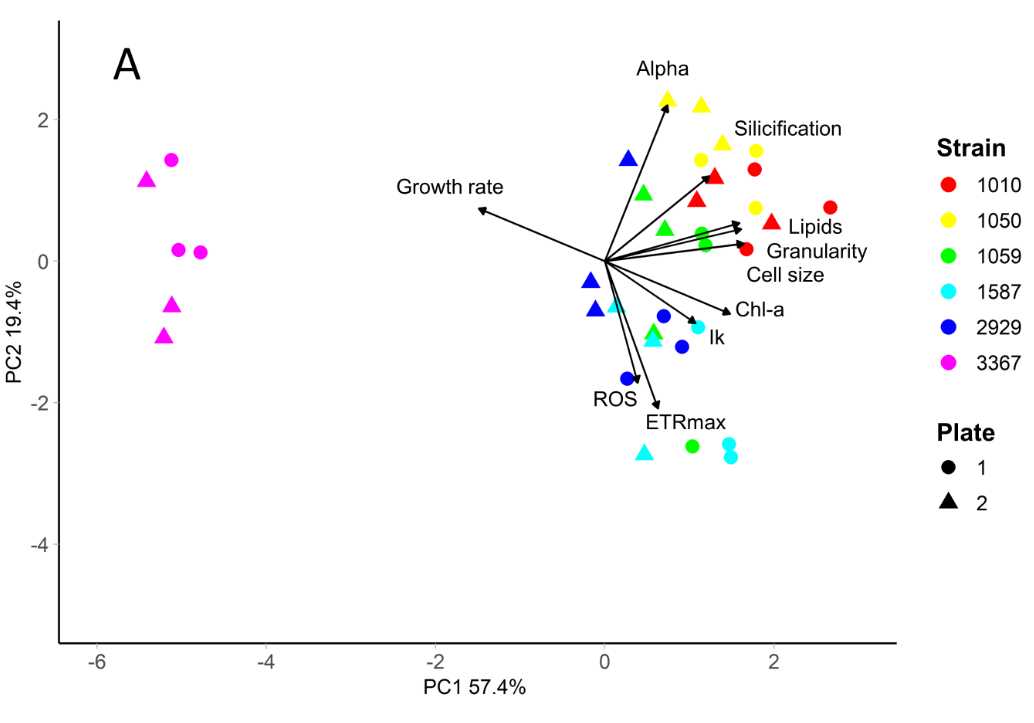
Multivariate trait data can be analysed using Principal Component Analysis to generate a multivariate trait-scape, in which differences between strains or species, as well as relationships between traits, can be visualised.


