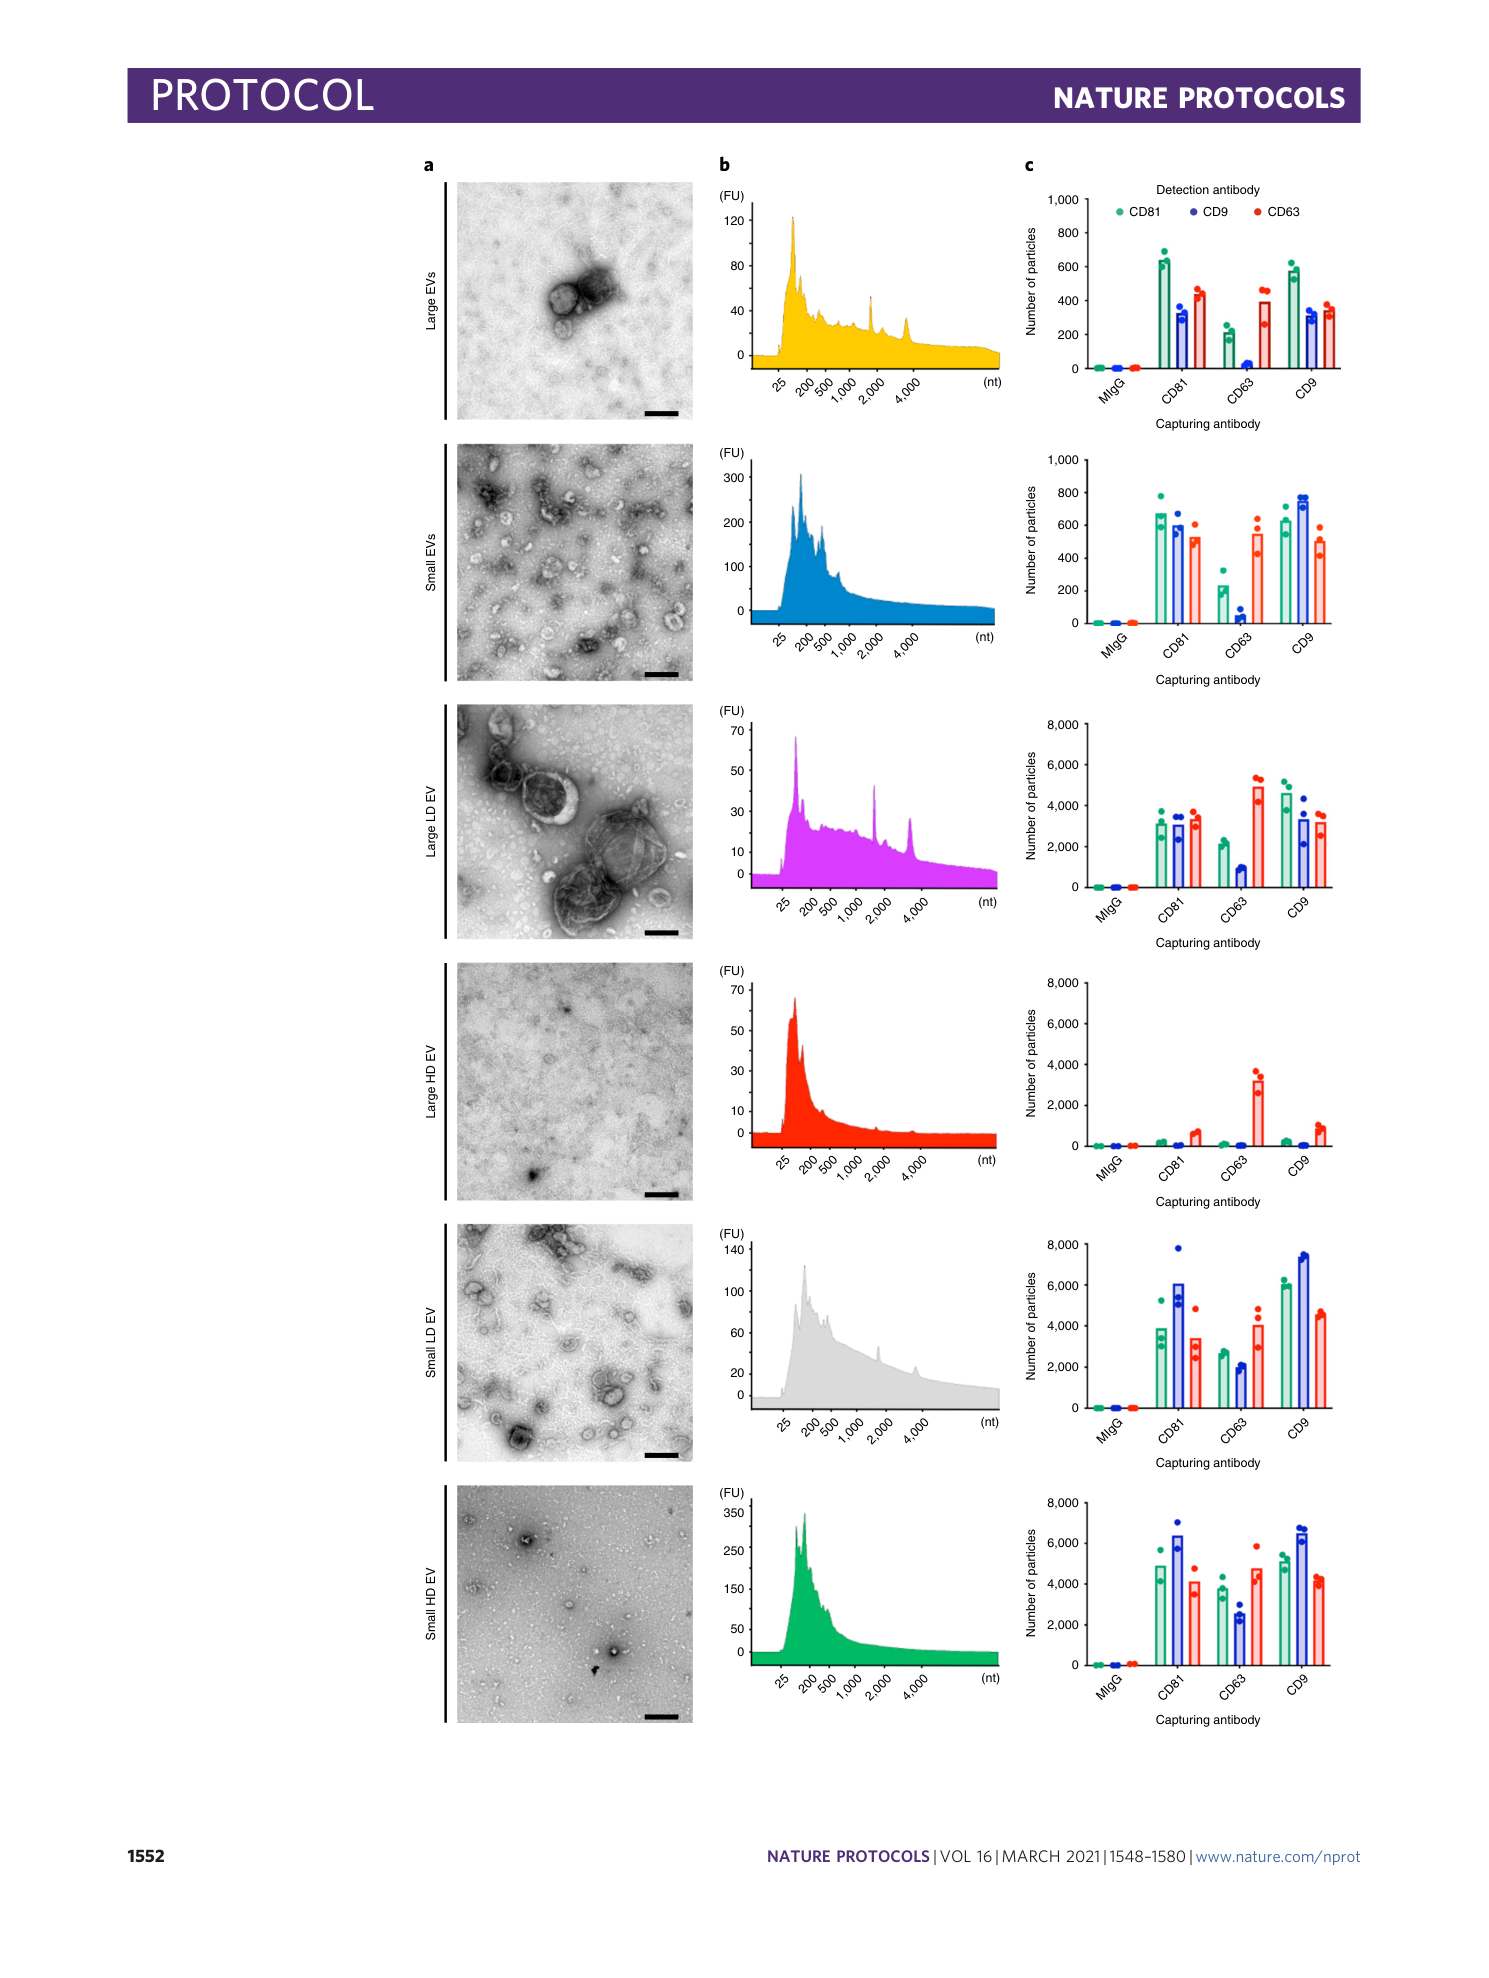
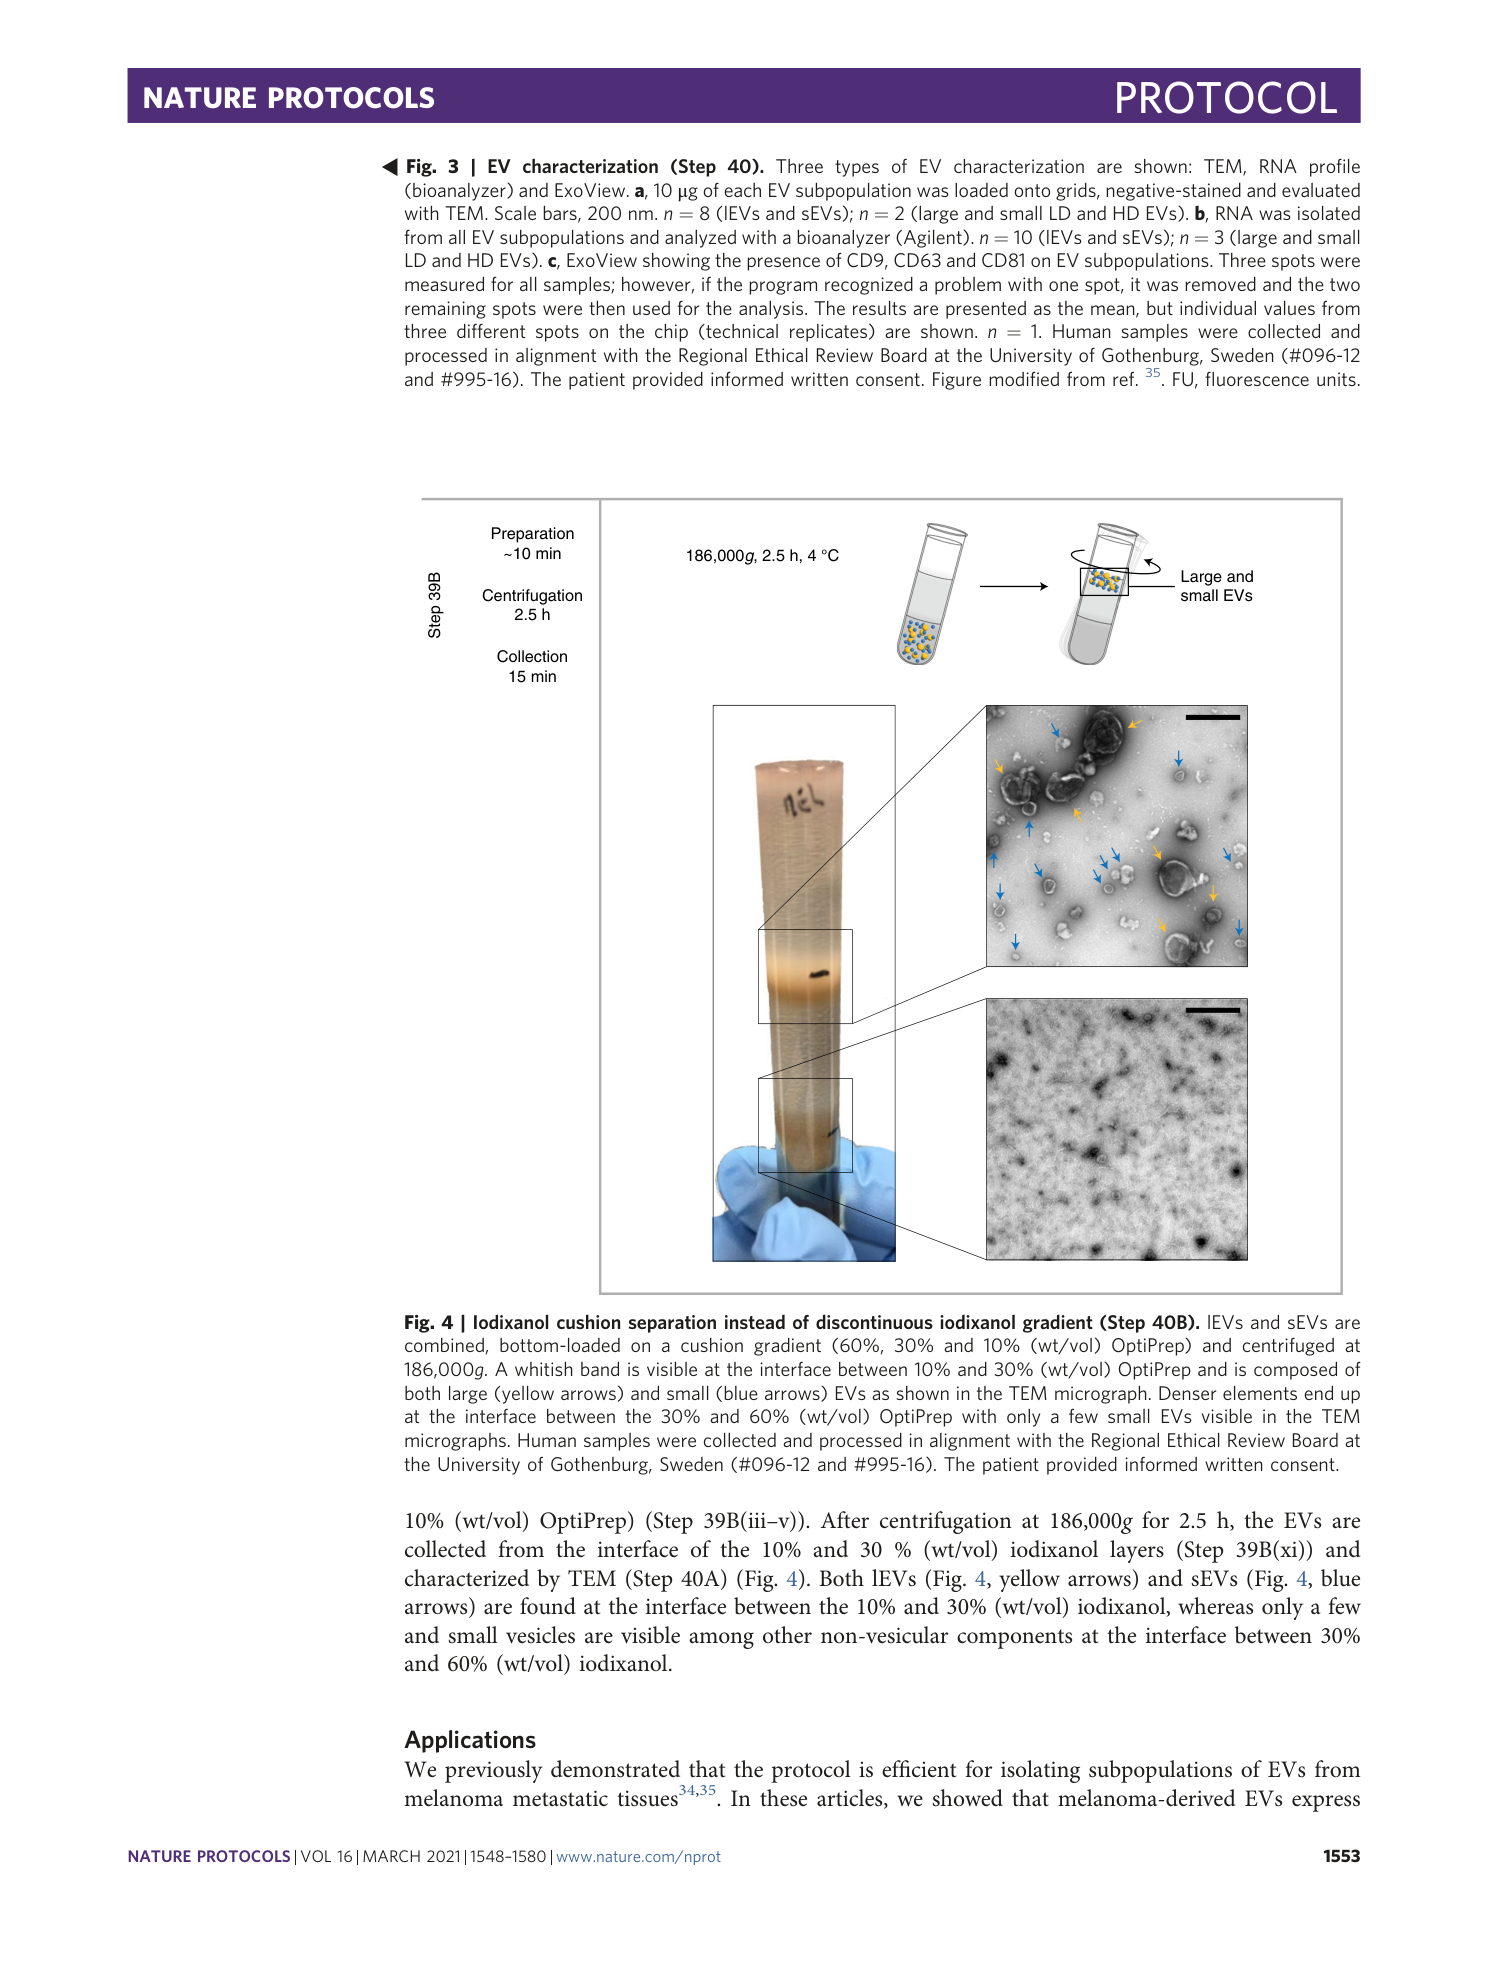
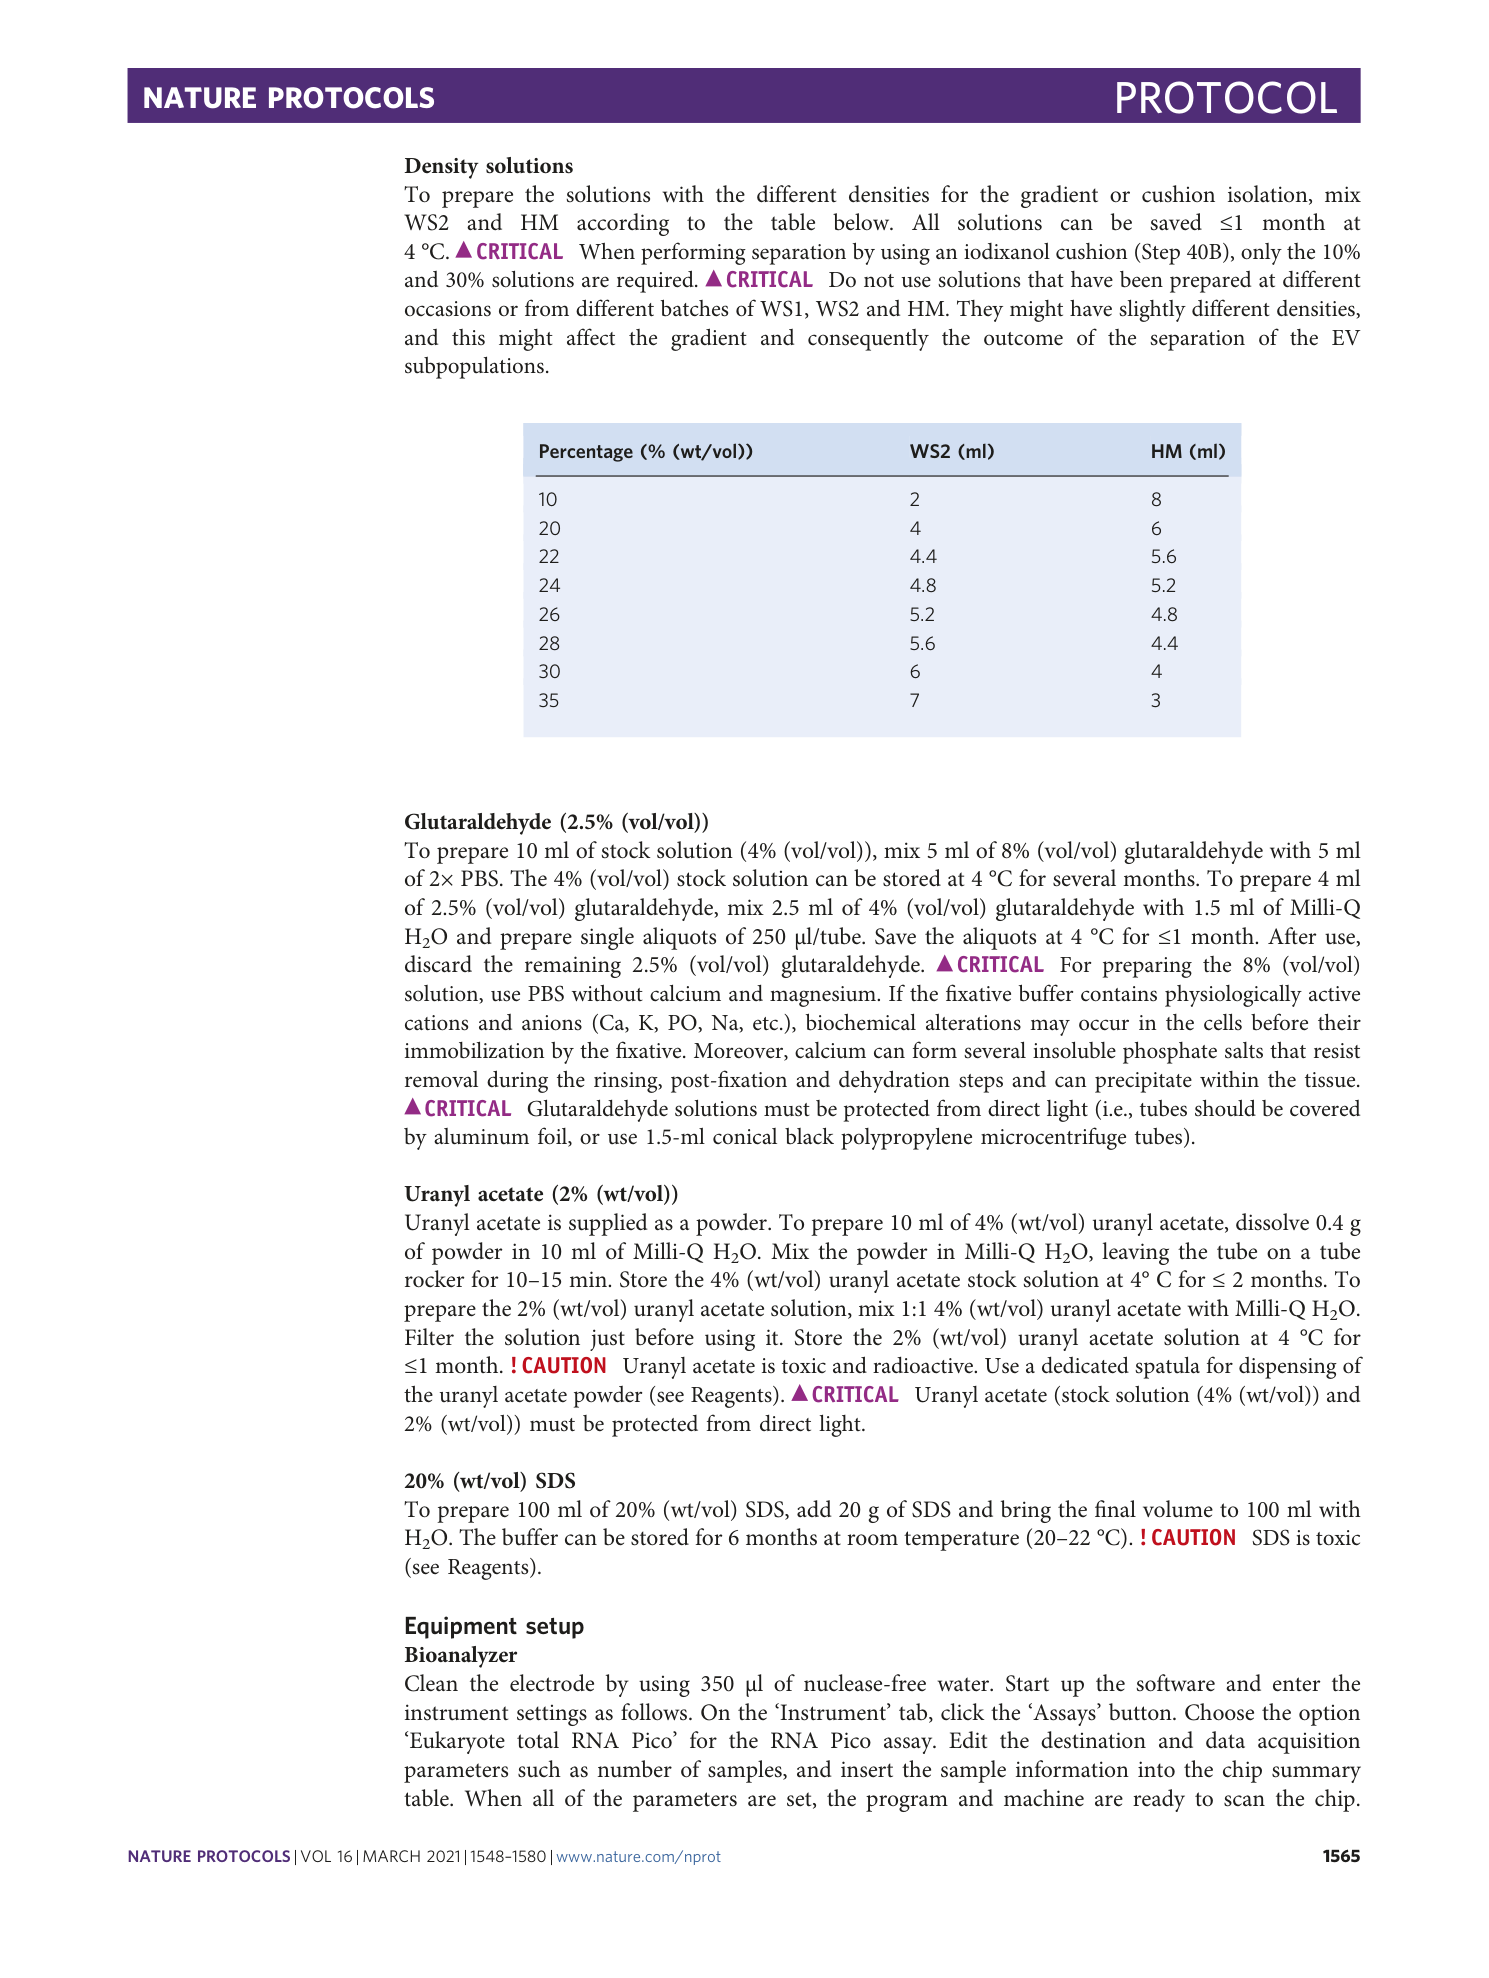
Isolation and characterization of extracellular vesicle subpopulations from tissues
Rossella Crescitelli, Cecilia Lässer, Jan Lötvall


Extended
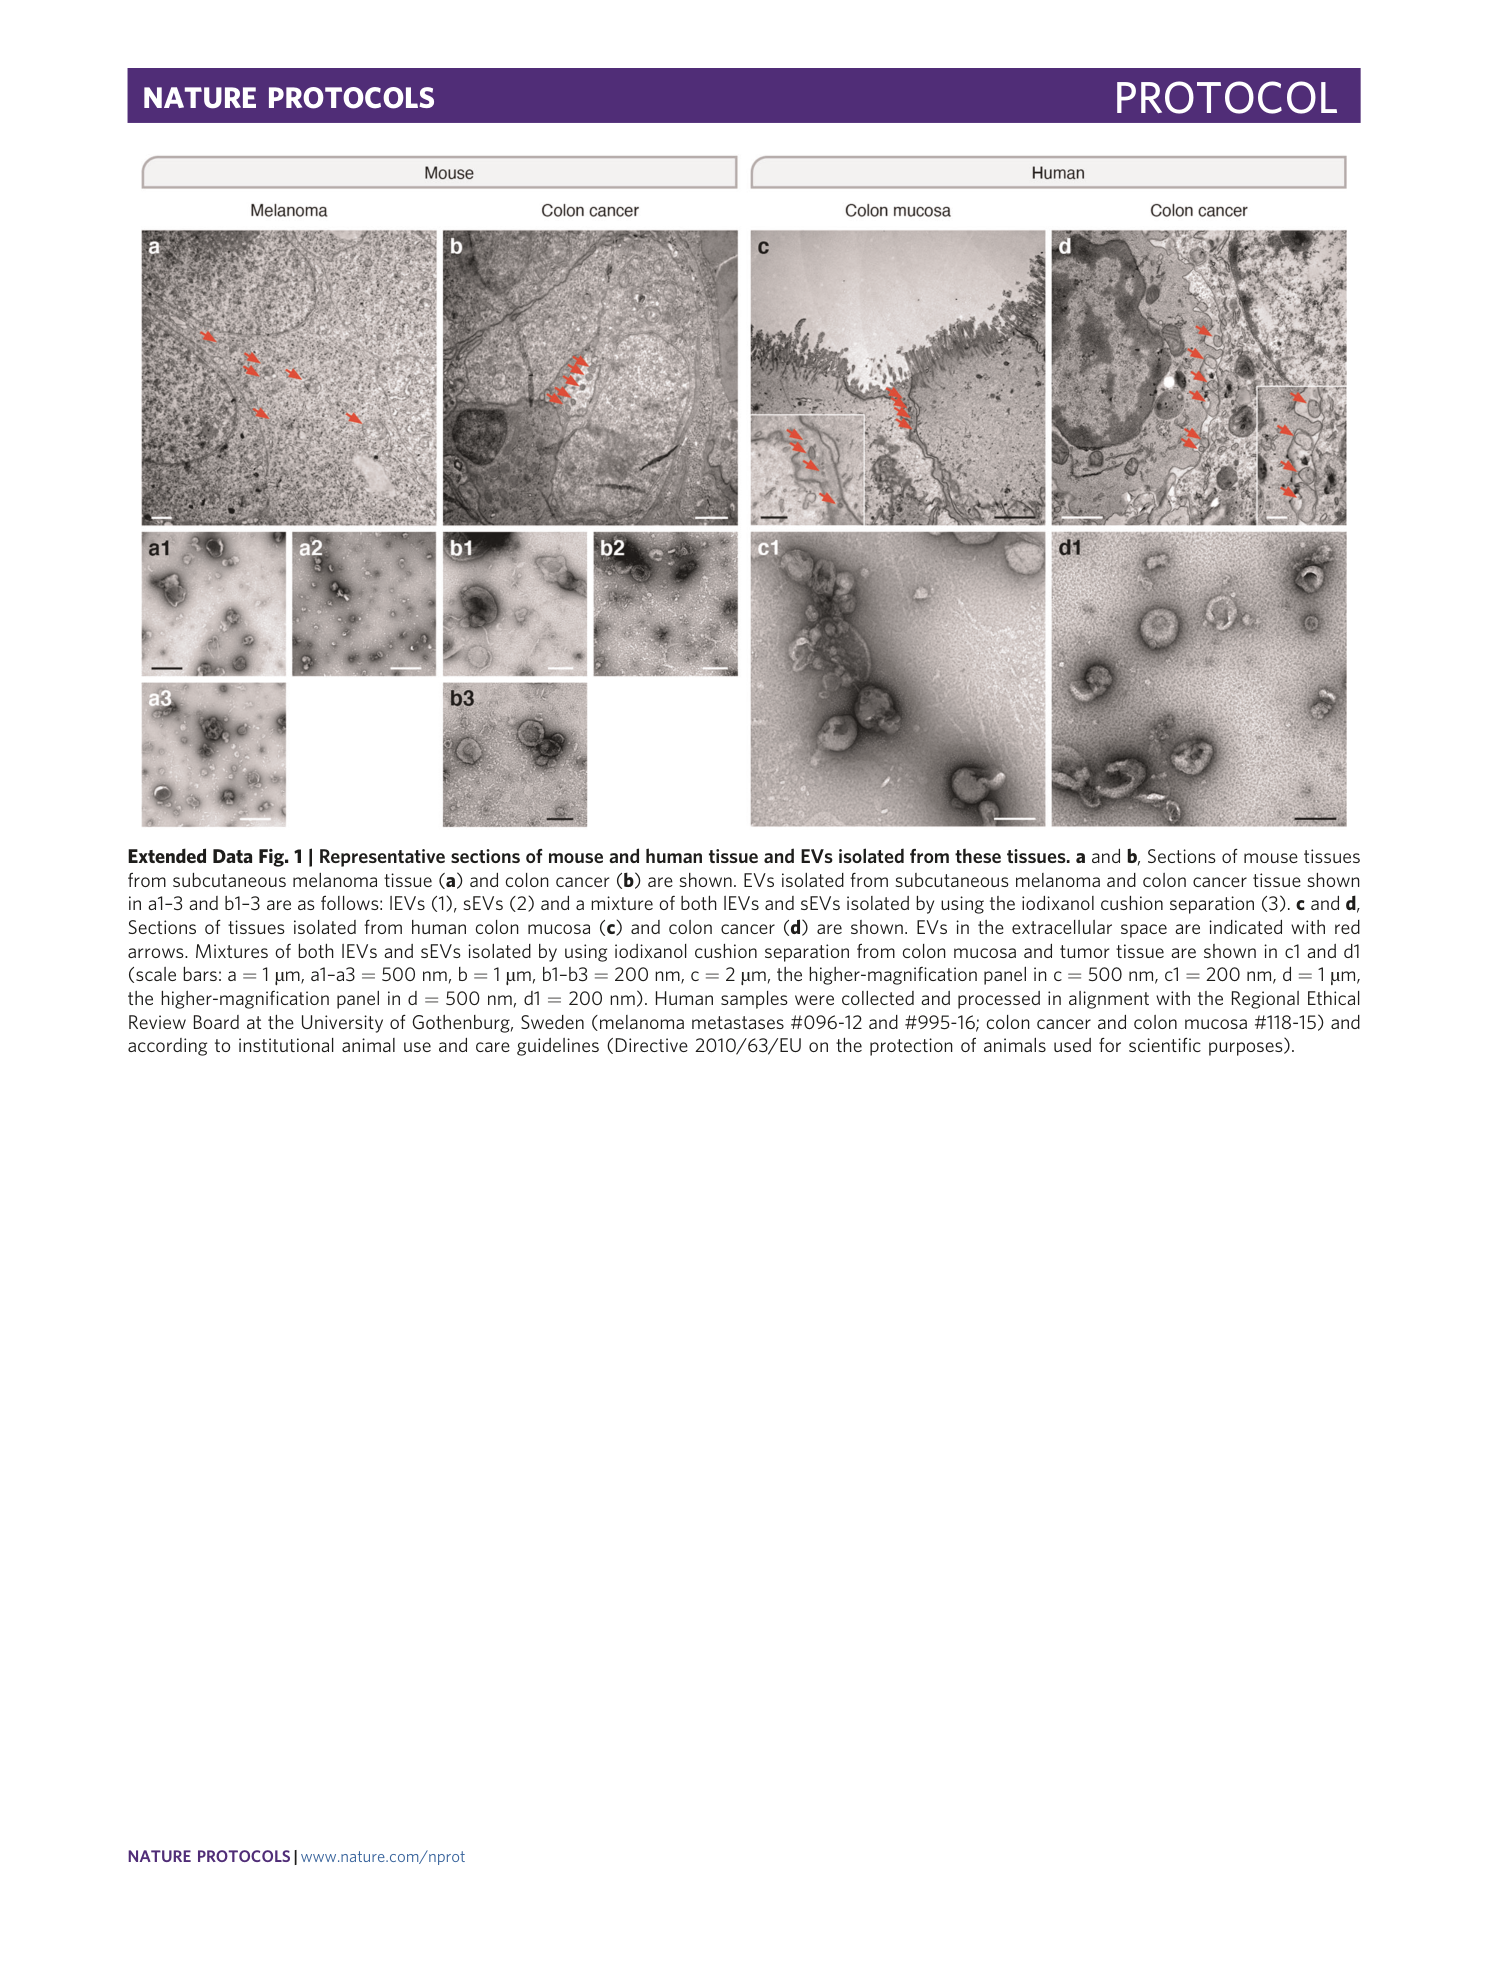
Extended Data Fig. 1 Representative sections of mouse and human tissue and EVs isolated from these tissues.
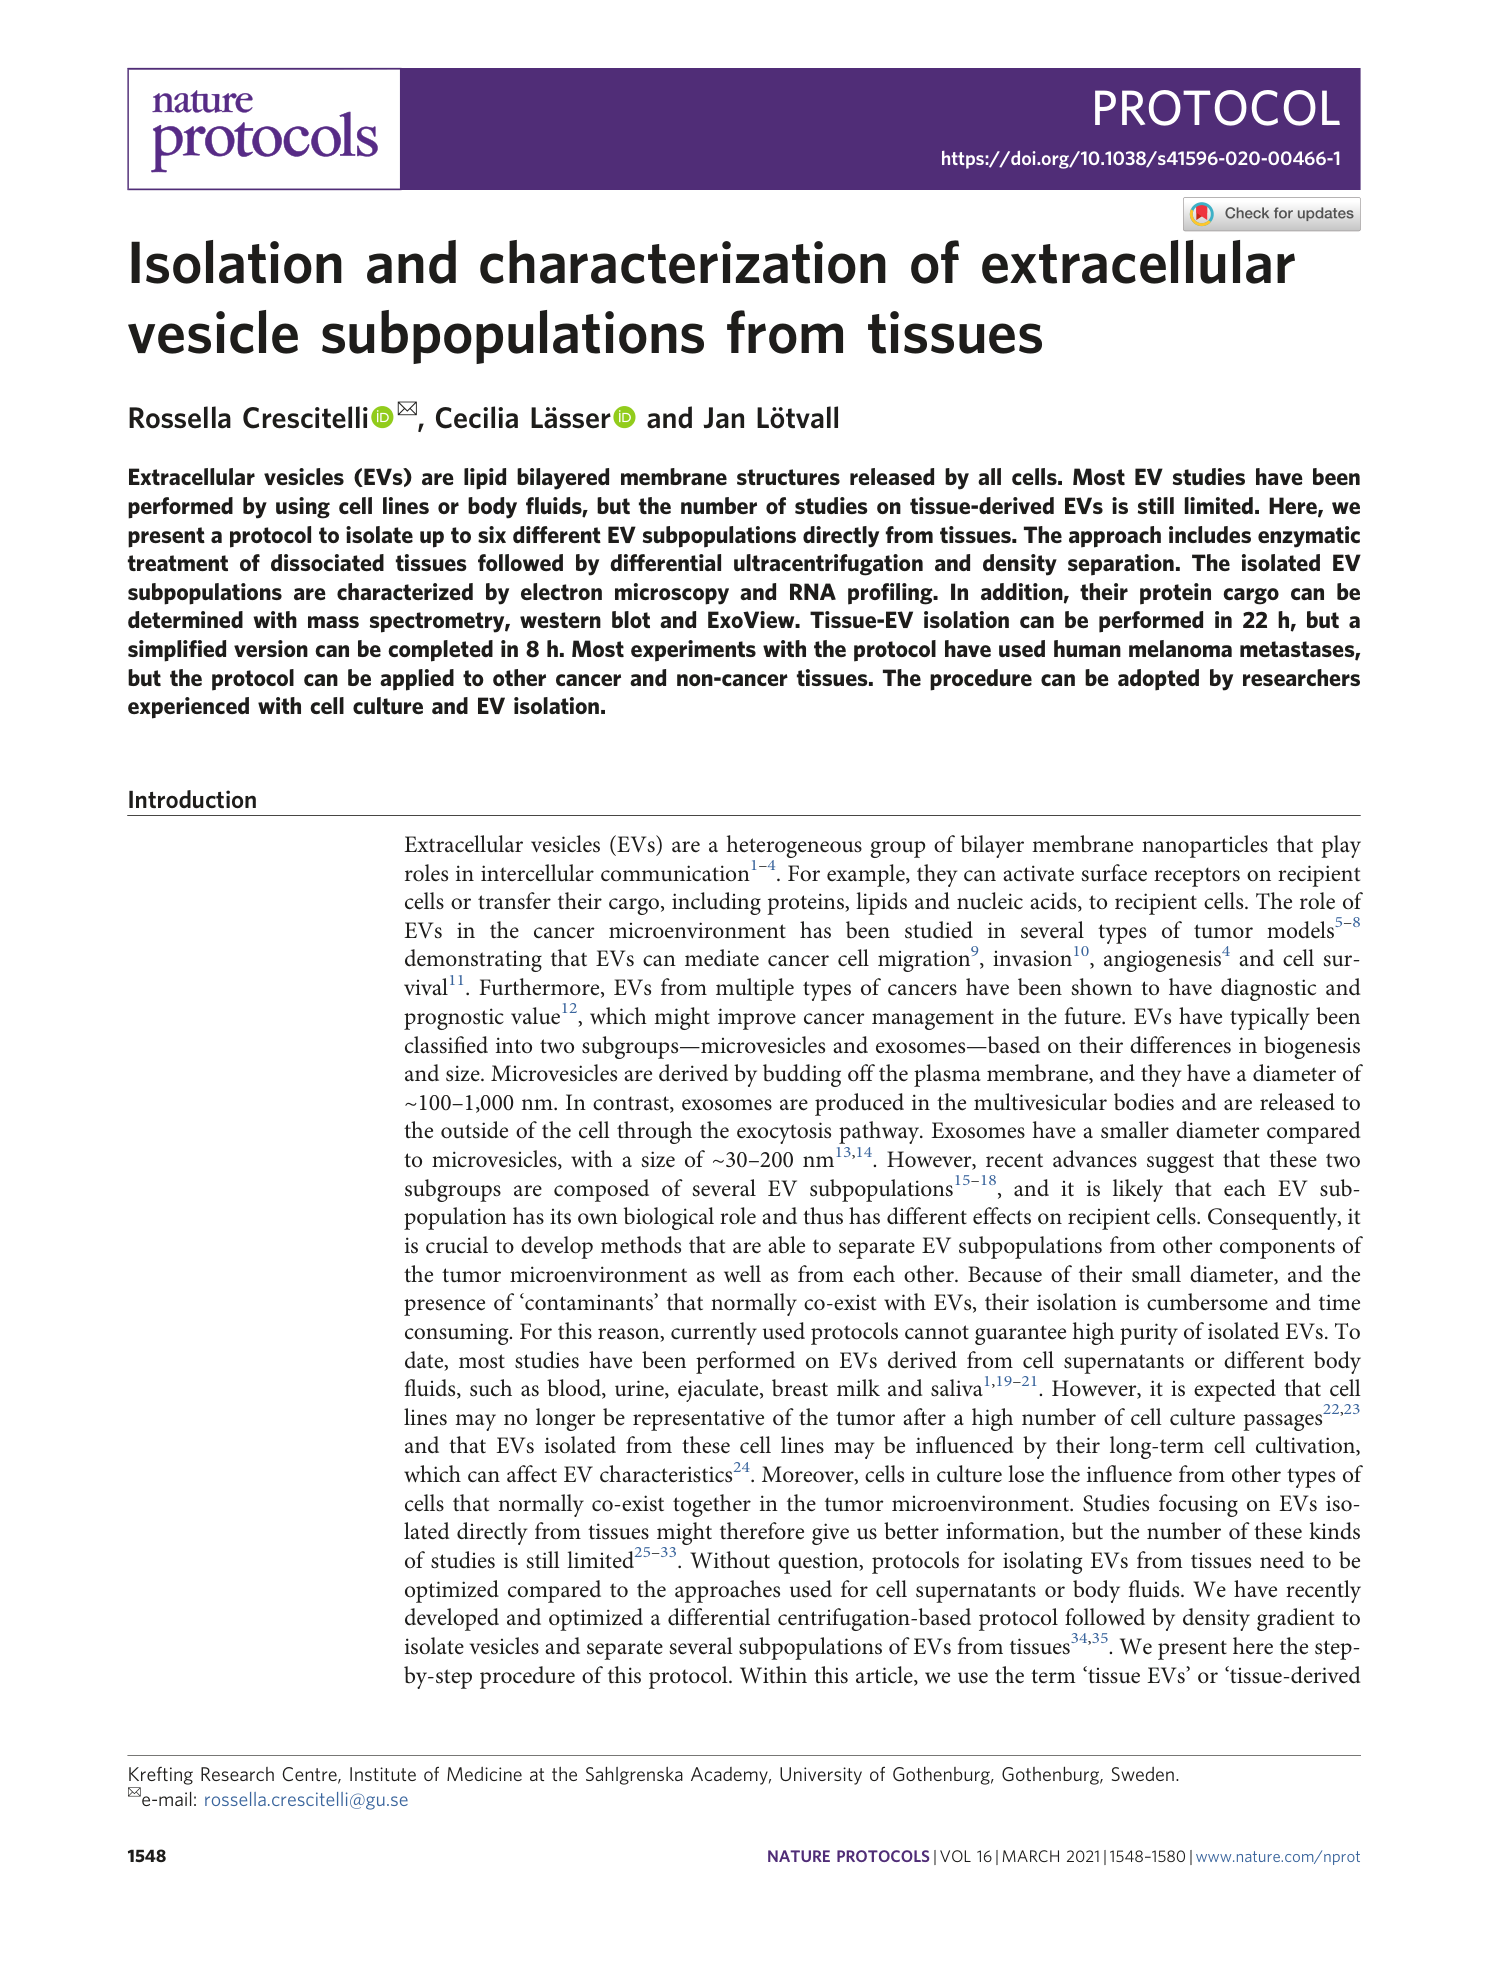
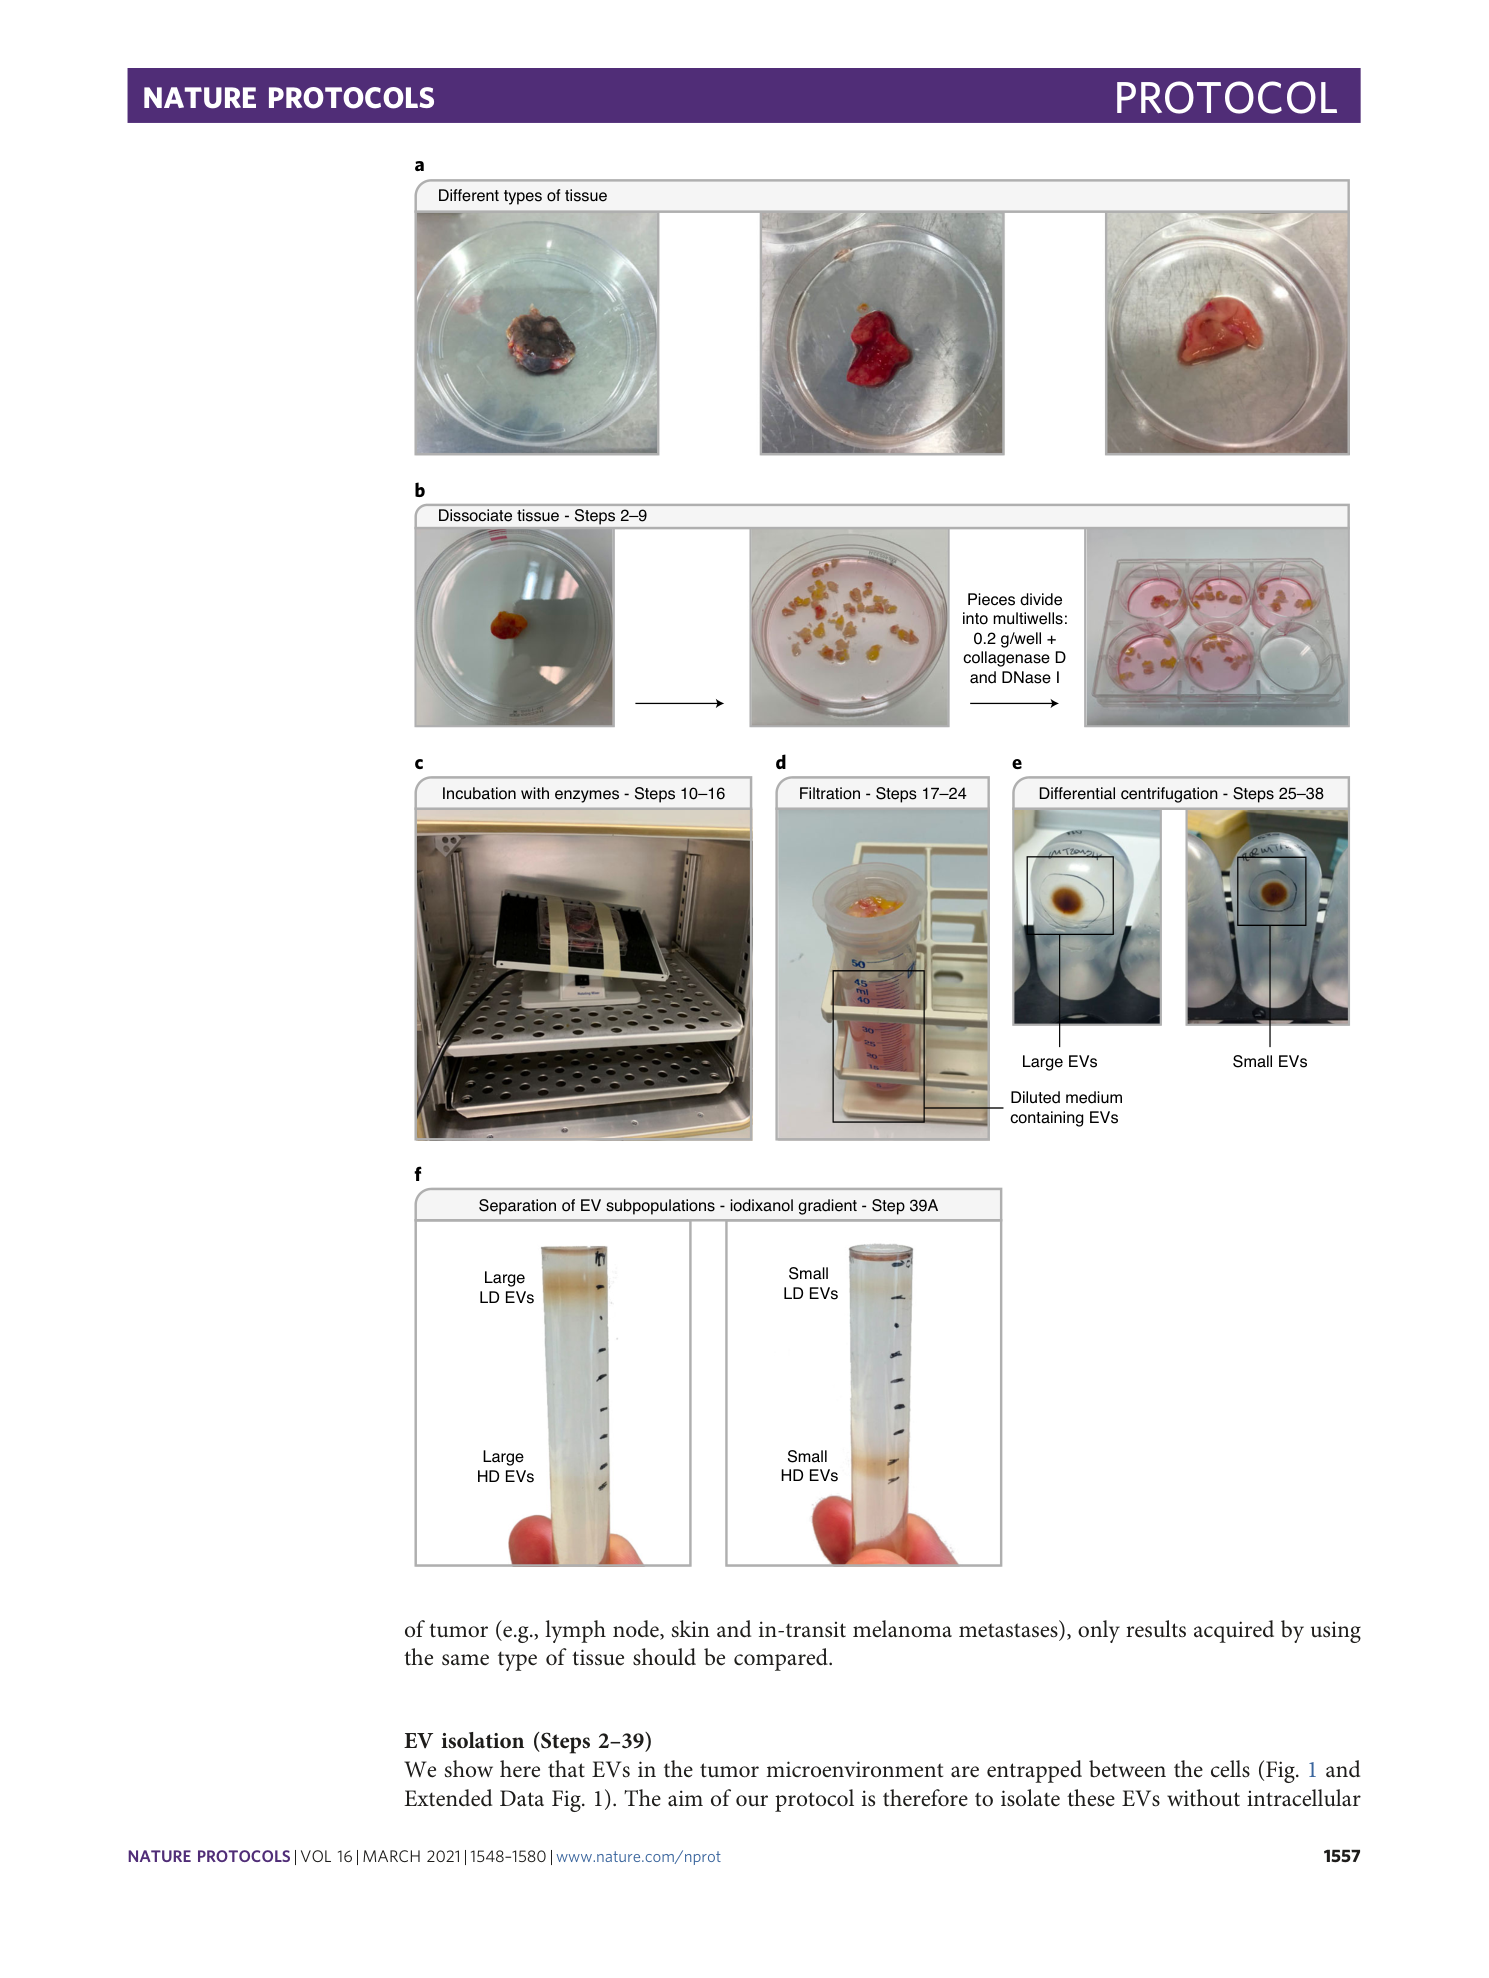
a and b , Sections of mouse tissues from subcutaneous melanoma tissue ( a ) and colon cancer ( b ) are shown. EVs isolated from subcutaneous melanoma and colon cancer tissue shown in a1–3 and b1–3 are as follows: lEVs (1), sEVs (2) and a mixture of both lEVs and sEVs isolated by using the iodixanol cushion separation (3). c and d , Sections of tissues isolated from human colon mucosa ( c ) and colon cancer ( d ) are shown. EVs in the extracellular space are indicated with red arrows. Mixtures of both lEVs and sEVs isolated by using iodixanol cushion separation from colon mucosa and tumor tissue are shown in c1 and d1 (scale bars: a = 1 µm, a1–a3 = 500 nm, b = 1 µm, b1–b3 = 200 nm, c = 2 µm, the higher-magnification panel in c = 500 nm, c1 = 200 nm, d = 1 µm, the higher-magnification panel in d = 500 nm, d1 = 200 nm). Human samples were collected and processed in alignment with the Regional Ethical Review Board at the University of Gothenburg, Sweden (melanoma metastases #096-12 and #995-16; colon cancer and colon mucosa #118-15) and according to institutional animal use and care guidelines (Directive 2010/63/EU on the protection of animals used for scientific purposes).
Extended Data Fig. 2 Protocol optimization: enzymatic treatment applied at different steps of the procedure.
a , The 2018 Protocol was used to isolate EVs without using collagenase D and DNase I (blue arrows). In the 2019 Protocol, collagenase and DNase I treatment was applied to the re-suspended vesicle-enriched pellets (green arrows). In the Final Protocol, collagenase D and DNase I treatment were applied directly to the tissue pieces after the dissociating step (red arrows). b and c , Micrograms of proteins isolated from lEVs ( b ) and sEVs ( c ) normalized to the grams of tissue for each protocol; 2018 Protocol, n = 4; 2019 Protocol, n = 2; Final Protocol 3, n = 13. Human samples were collected and processed in alignment with the Regional Ethical Review Board at the University of Gothenburg, Sweden (#096-12 and #995-16). The patient provided informed written consent. The image is modified from Crescitelli et al. 35 .
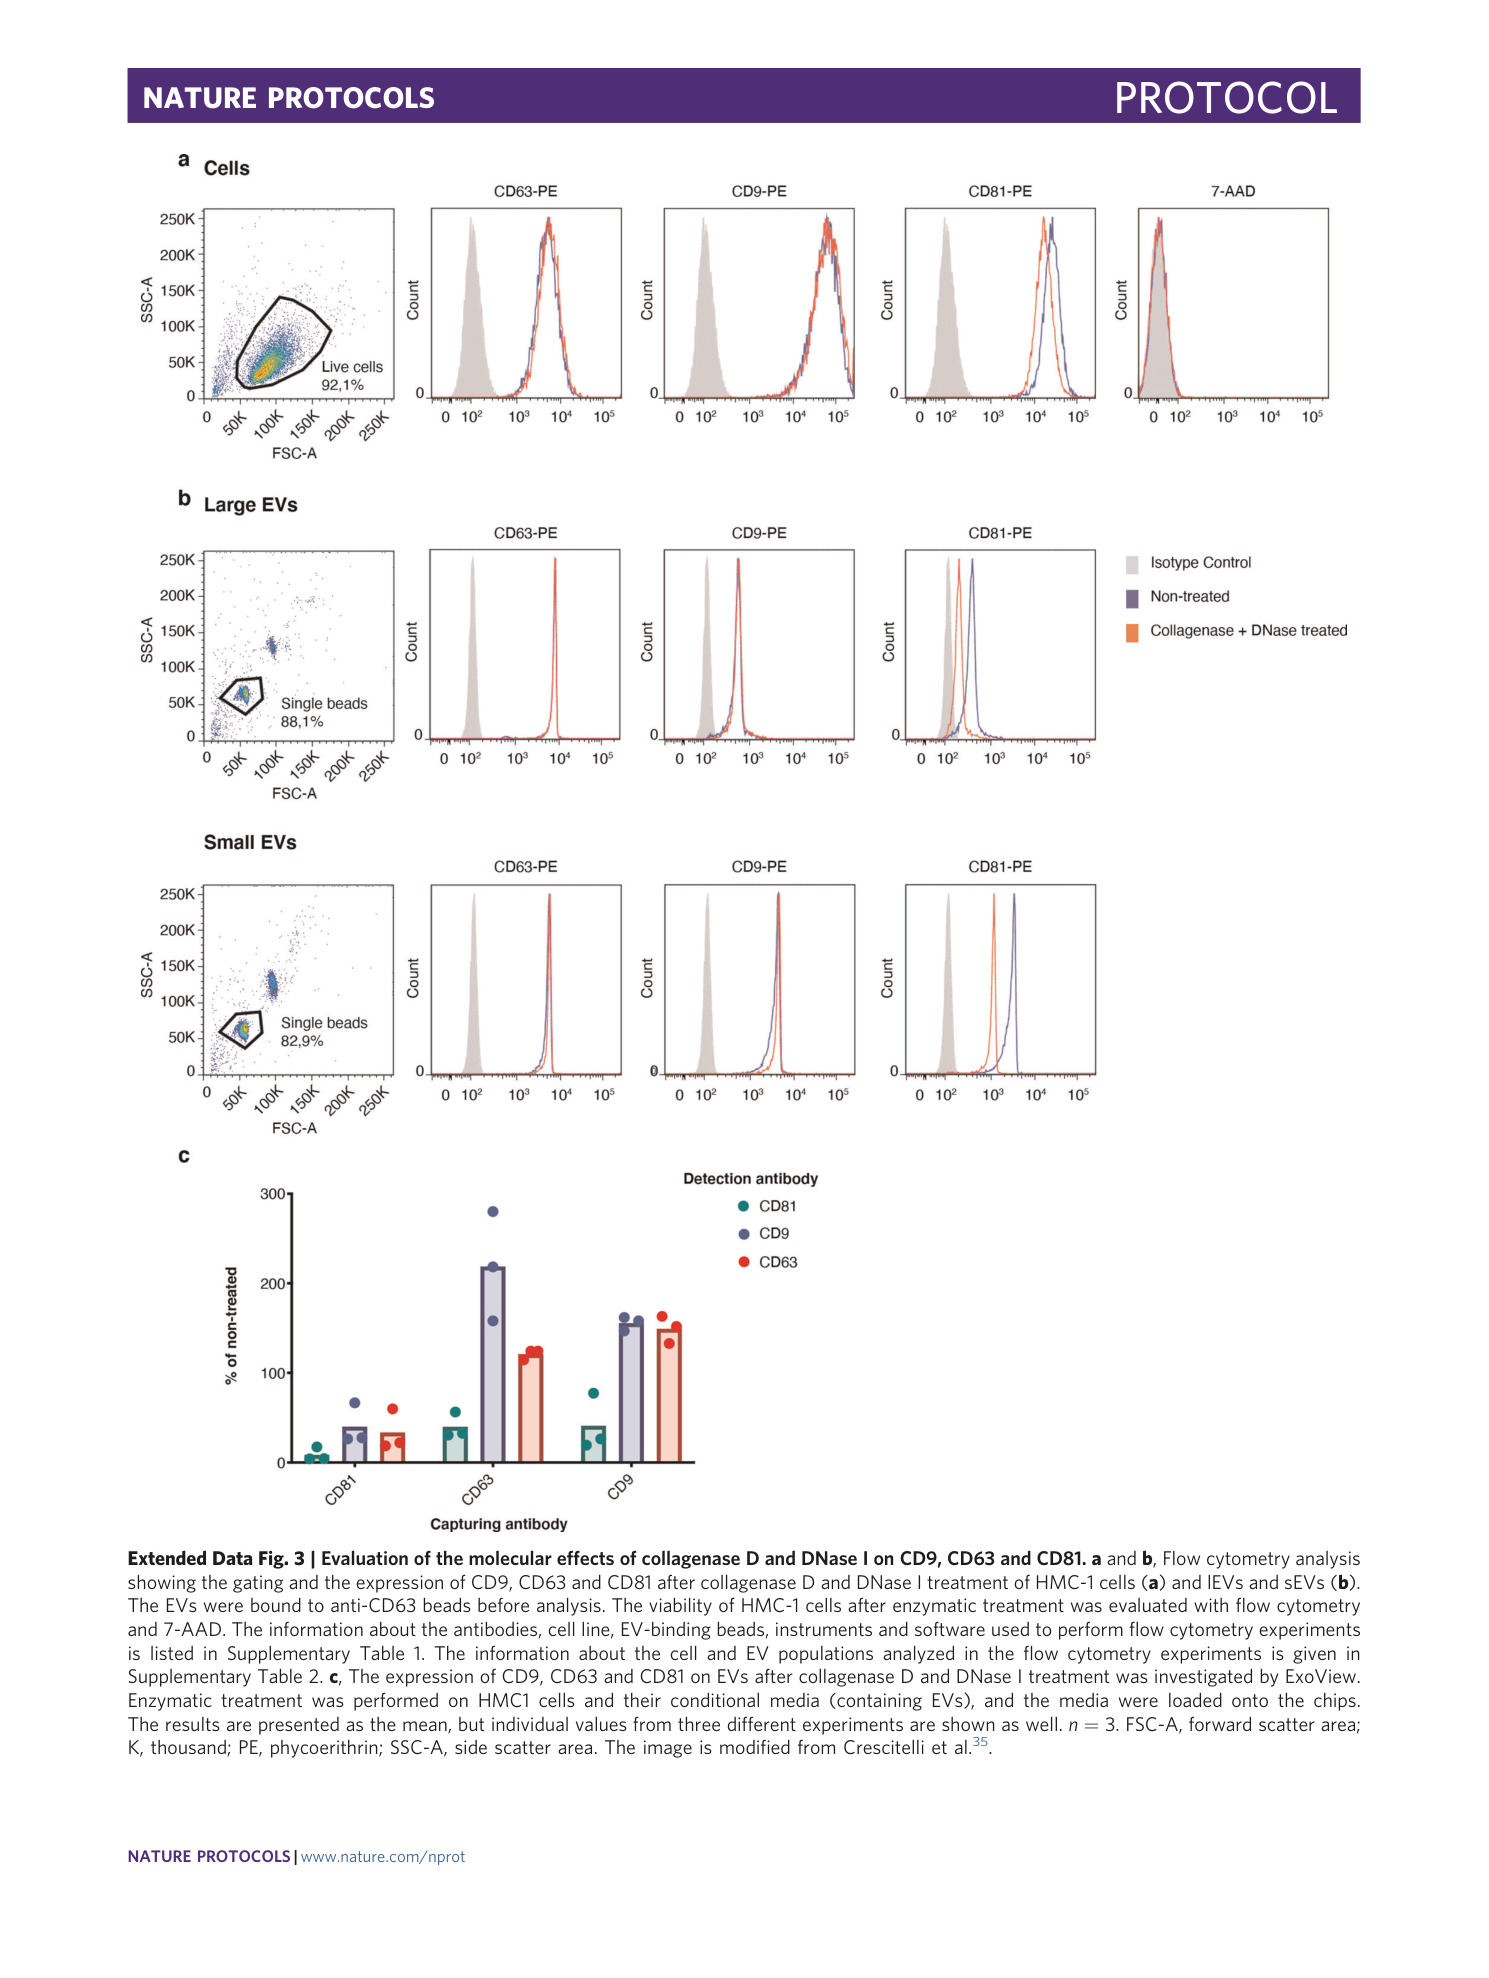
Extended Data Fig. 3 Evaluation of the molecular effects of collagenase D and DNase I on CD9, CD63 and CD81.
a and b , Flow cytometry analysis showing the gating and the expression of CD9, CD63 and CD81 after collagenase D and DNase I treatment of HMC-1 cells ( a ) and lEVs and sEVs ( b ). The EVs were bound to anti-CD63 beads before analysis. The viability of HMC-1 cells after enzymatic treatment was evaluated with flow cytometry and 7-AAD. The information about the antibodies, cell line, EV-binding beads, instruments and software used to perform flow cytometry experiments is listed in Supplementary Table 1 . The information about the cell and EV populations analyzed in the flow cytometry experiments is given in Supplementary Table 2 . c , The expression of CD9, CD63 and CD81 on EVs after collagenase D and DNase I treatment was investigated by ExoView. Enzymatic treatment was performed on HMC1 cells and their conditional media (containing EVs), and the media were loaded onto the chips. The results are presented as the mean, but individual values from three different experiments are shown as well. n = 3. FSC-A, forward scatter area; K, thousand; PE, phycoerithrin; SSC-A, side scatter area. The image is modified from Crescitelli et al. 35 .
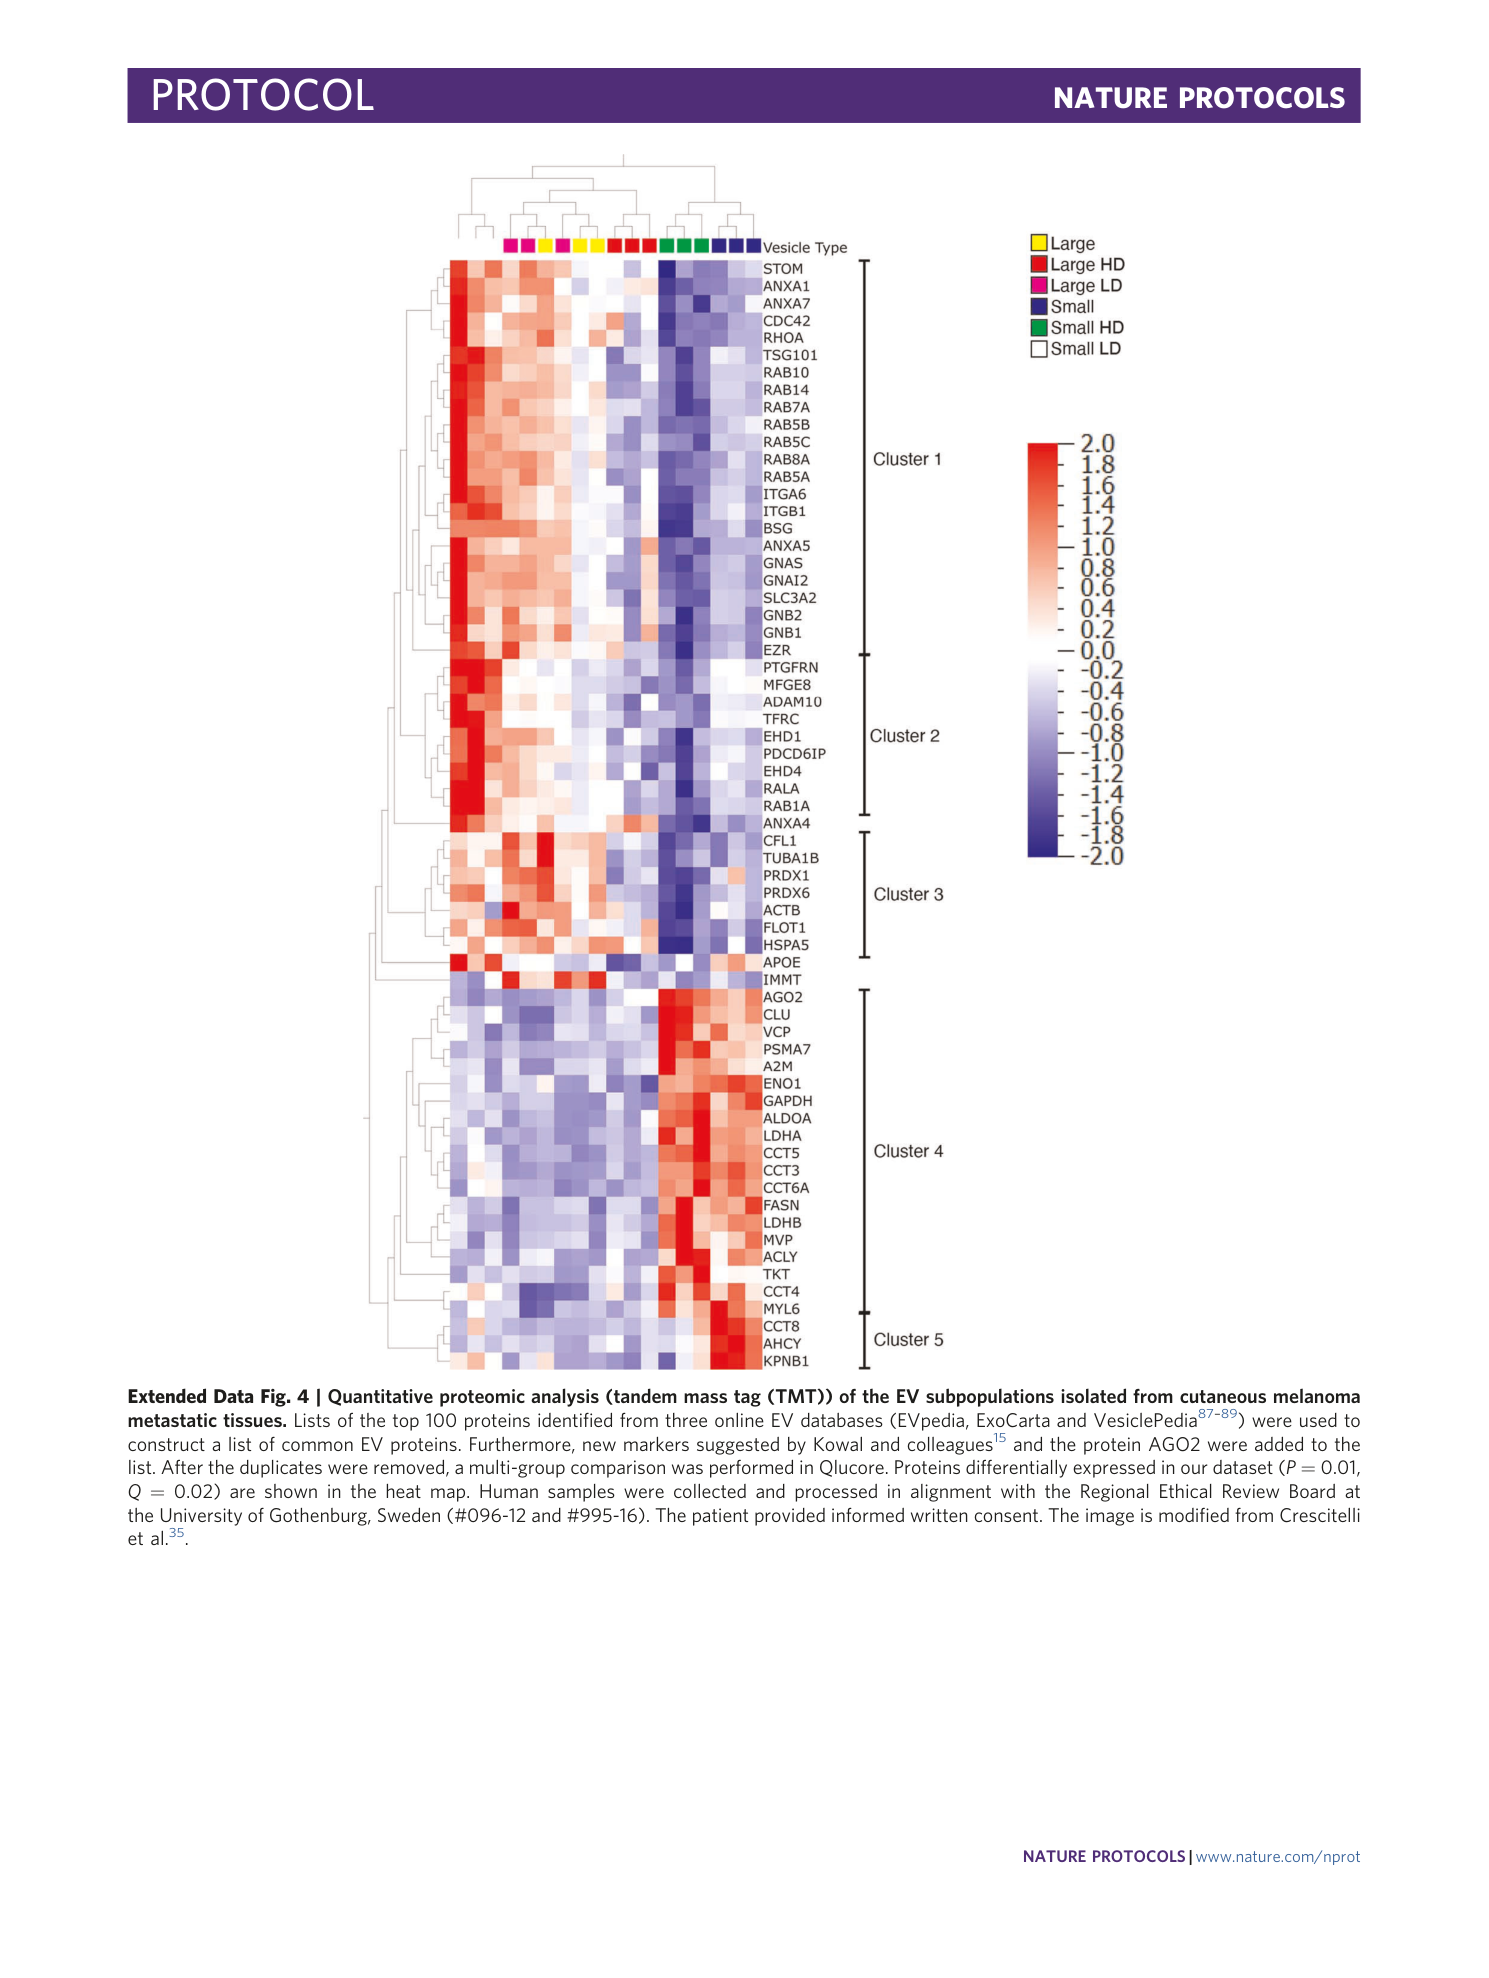
Extended Data Fig. 4 Quantitative proteomic analysis (tandem mass tag (TMT)) of the EV subpopulations isolated from cutaneous melanoma metastatic tissues.
Lists of the top 100 proteins identified from three online EV databases (EVpedia, ExoCarta and VesiclePedia 87 , 88 , 89 ) were used to construct a list of common EV proteins. Furthermore, new markers suggested by Kowal and colleagues 15 and the protein AGO2 were added to the list. After the duplicates were removed, a multi-group comparison was performed in Qlucore. Proteins differentially expressed in our dataset ( P = 0.01, Q = 0.02) are shown in the heat map. Human samples were collected and processed in alignment with the Regional Ethical Review Board at the University of Gothenburg, Sweden (#096-12 and #995-16). The patient provided informed written consent. The image is modified from Crescitelli et al. 35 .
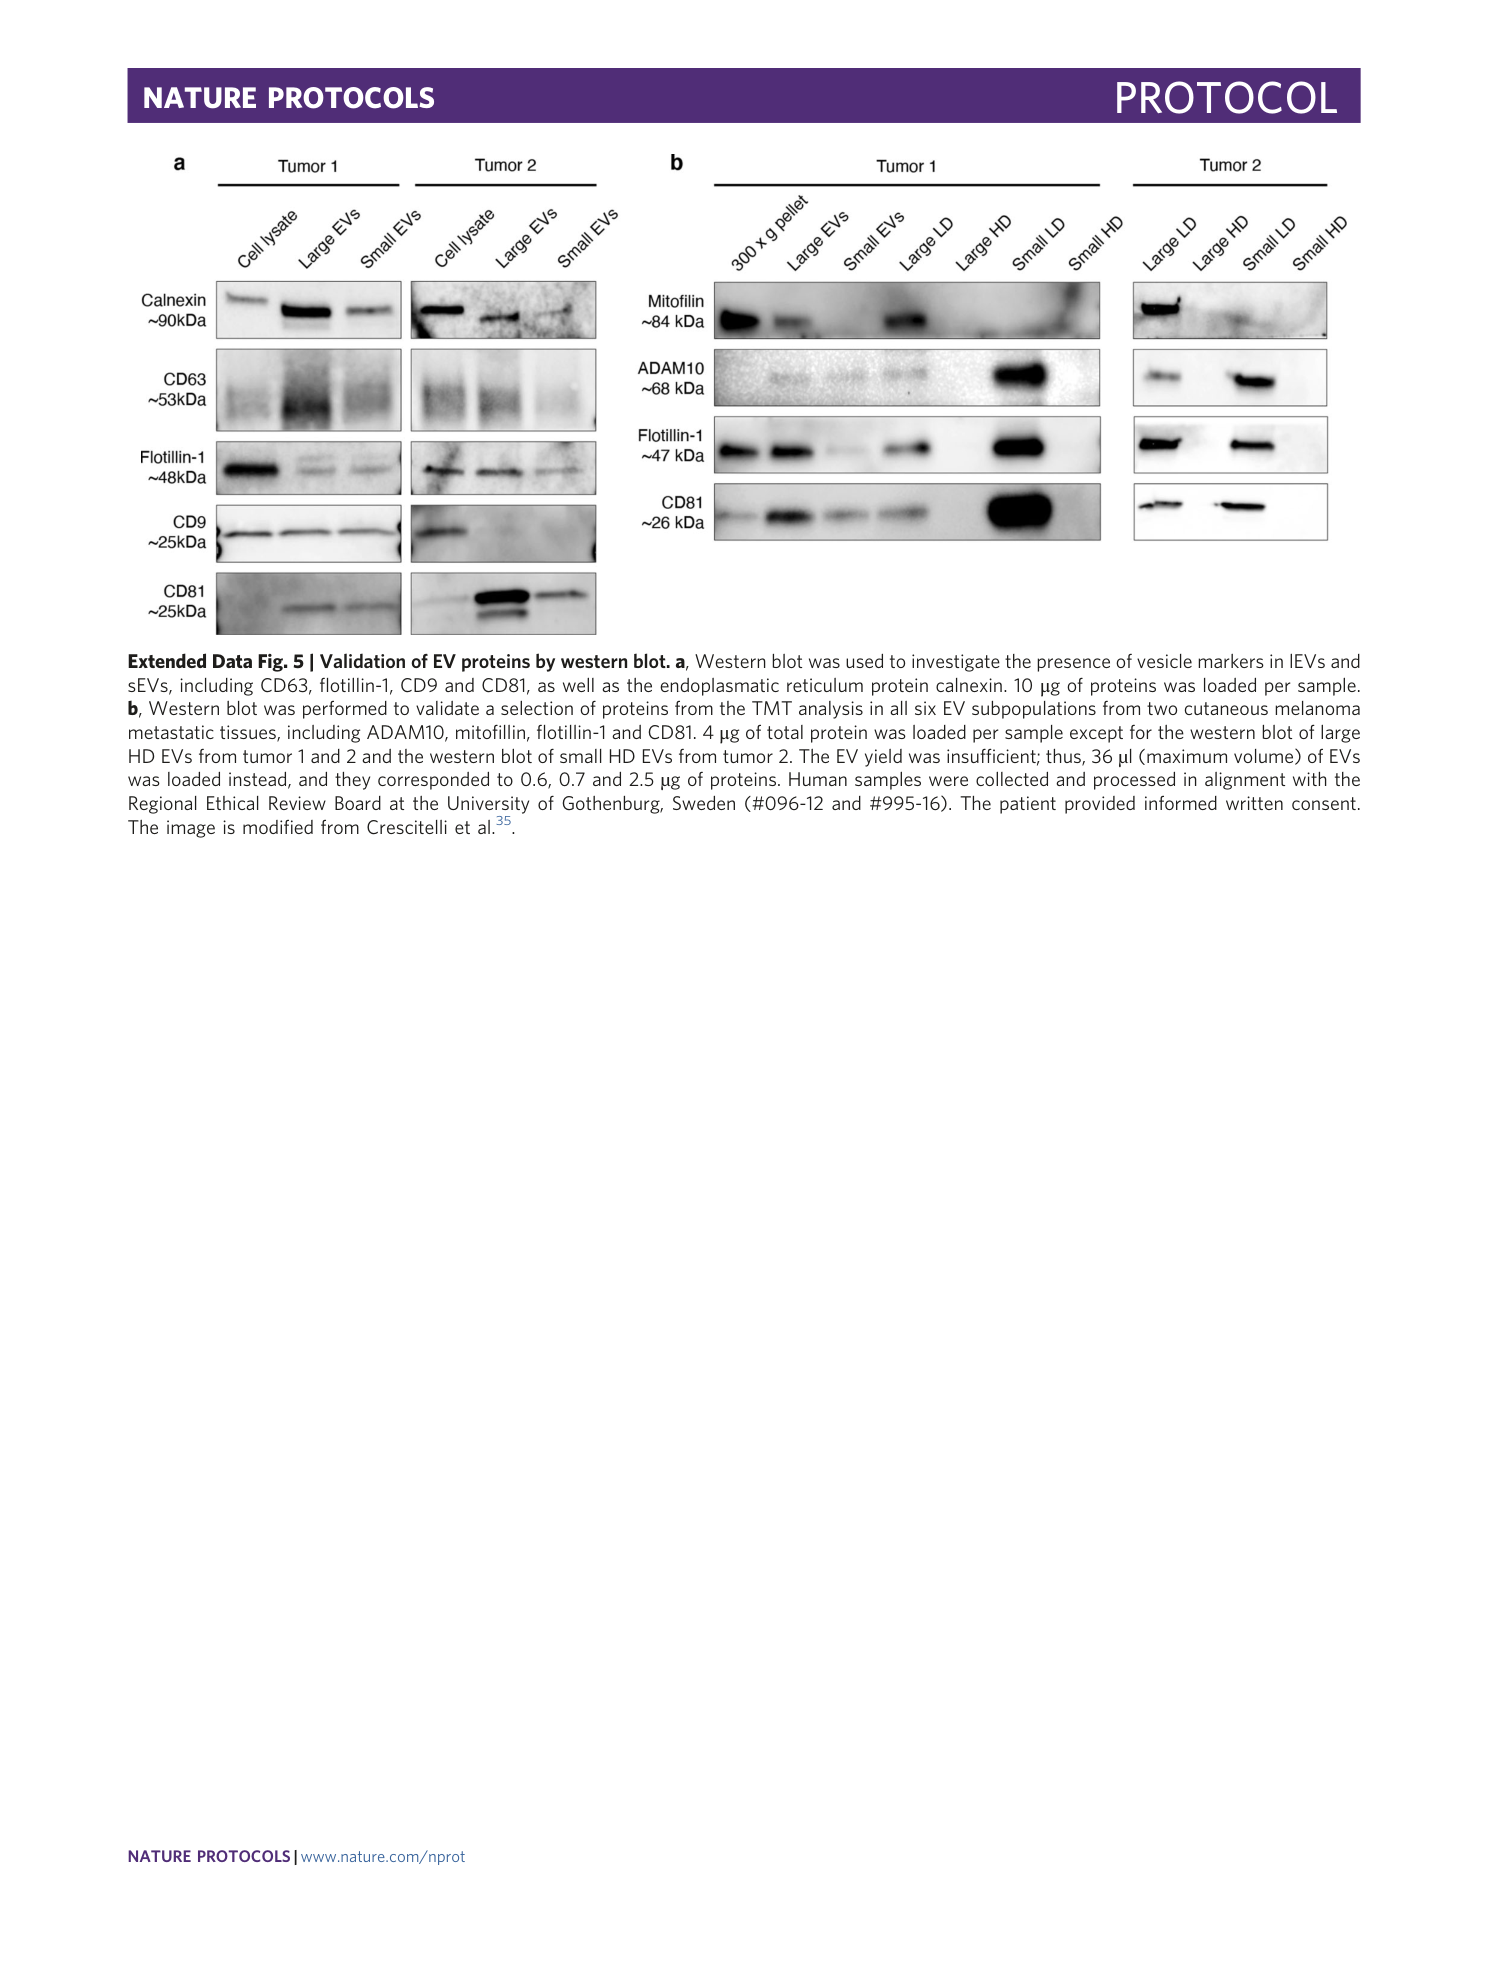
Extended Data Fig. 5 Validation of EV proteins by western blot.
a , Western blot was used to investigate the presence of vesicle markers in lEVs and sEVs, including CD63, flotillin-1, CD9 and CD81, as well as the endoplasmatic reticulum protein calnexin. 10 μg of proteins was loaded per sample. b , Western blot was performed to validate a selection of proteins from the TMT analysis in all six EV subpopulations from two cutaneous melanoma metastatic tissues, including ADAM10, mitofillin, flotillin-1 and CD81. 4 μg of total protein was loaded per sample except for the western blot of large HD EVs from tumor 1 and 2 and the western blot of small HD EVs from tumor 2. The EV yield was insufficient; thus, 36 µl (maximum volume) of EVs was loaded instead, and they corresponded to 0.6, 0.7 and 2.5 µg of proteins. Human samples were collected and processed in alignment with the Regional Ethical Review Board at the University of Gothenburg, Sweden (#096-12 and #995-16). The patient provided informed written consent. The image is modified from Crescitelli et al. 35 .
Supplementary information
Supplementary Information
Supplementary Tables 1 and 2 supporting Extended Data Fig. 3.
