Staining of cells with GolgiTracker for Golgi flow cytometry analysis
Dario R Alessi, Enrico Bagnoli, Rotimi Fasimoye
Abstract
We describe a method that allows the staining of intact Golgi using GolgiTracker for subsequent flow cytometry analysis. The analysis can provide a quantitative indication of the level of enrichment of the organelle immunoprecipitation (% of GOLGI+ beads) and can be used as a quality control check for the purity of the immunoprecipitated Golgi. Since only a small fraction of the immunoprecipitated material is needed for flow cytometry, this technique can be coupled with other assays, like western blotting or proteomics.
The staining can be performed directly on the cells, or, alternatively, after the Golgi has been isolated from the cells (For our Golgi immunoprecipitation protocol, see dx.doi.org/10.17504/protocols.io.6qpvrdjrogmk/v1). In our experience, the first method (which is described in this protocol) results in a cleaner signal. It should be noted that the staining is performed in KPBS, the buffer is used as optimal for organelles isolation. This buffer is compatible with the GolgiTracker staining, however other staining, particularly those using antibodies, might require a buffer containing Mg2+ or Ca2+. While this protocol is focused on the staining and detection of Golgi, it can be easily modified to analyse different organelles by changing the staining procedure and adjusting the parameters of the cytometer.
Steps
Materials and reagents
Cell culture
Grow HEK293 cells stably expressing GolgiTag or ControlTag (generated as described in dx.doi.org/10.17504/protocols.io.6qpvrdjrogmk/v1) in 10cm2 Petri dish until near confluent.
Note: For each experimental conditions, two plates will be needed: one to be stained with GolgiTracker, and a control plate (not stained with GolgiTracker).
Staining on cells + Immunoprecipitation
Staining of cultured cells with GolgiTracker
Prepare a 500micromolar (µM) stock of GolgiTracker in DMSO and dissolve thoroughly by vortexing.
Add the GolgiTracker to the cells to a final concentration of 5micromolar (µM) (i.e. 1:100 dilution). Add DMSO vehicle (1% v/v) to control cells.
Incubate at 37°C for 0h 30m 0s
Discard media and add fresh media and incubate for further 0h 30m 0sat 37°C
Isolation of intact Golgi using GolgiTag immunoprecipitation method
Perform Golgi immunoprecipitation as described in dx.doi.org/10.17504/protocols.io.6qpvrdjrogmk/v1
At the end (Step 56 in dx.doi.org/10.17504/protocols.io.6qpvrdjrogmk/v1), add 500µL to the beads (instead of adding lysis buffer) and gently resuspend by pipetting up and down.
Flow cytometry
Preparation of samples for flow cytometry.
Prepare and label the appropriate amount of FACS tube. For example:
- GolgiTAG +Tracker
- GolgiTAG -Tracker
- HA-Empty +Tracker
- HA-Empty -Tracker
Dilute samples. We used a dilution of 1:100 (or 1:200) from the final IPs. So from the500µL take 40µLand resuspend in a FACS tube with 400µL on iceOn ice
Flow cytometry analysis
Check the waste container of the cytometer is not full. Check the buffer container of the cytometer is not empty. Refill or empty accordingly.
Turn on machine following relative SOPs. If first user of the day, also perform the starting procedure.
Prepare working windows and gates. The tracker used can be analysed in the FITC channel.
If the samples are run for the first time, adjust voltages for the Forward and Side scatter and the FITC channel. Otherwise use the parameters already optimized before.
When FSC, SSC and FITC voltages are fine, start running the samples.
For each sample, record at least 20k events, but if possible 50k is a better option.
At the end, clean the machine and save the data (FCS 3.0 files)
Analysis
Data analysis using FlowJo.
Open the software and drag the samples to be analyzed in the main window
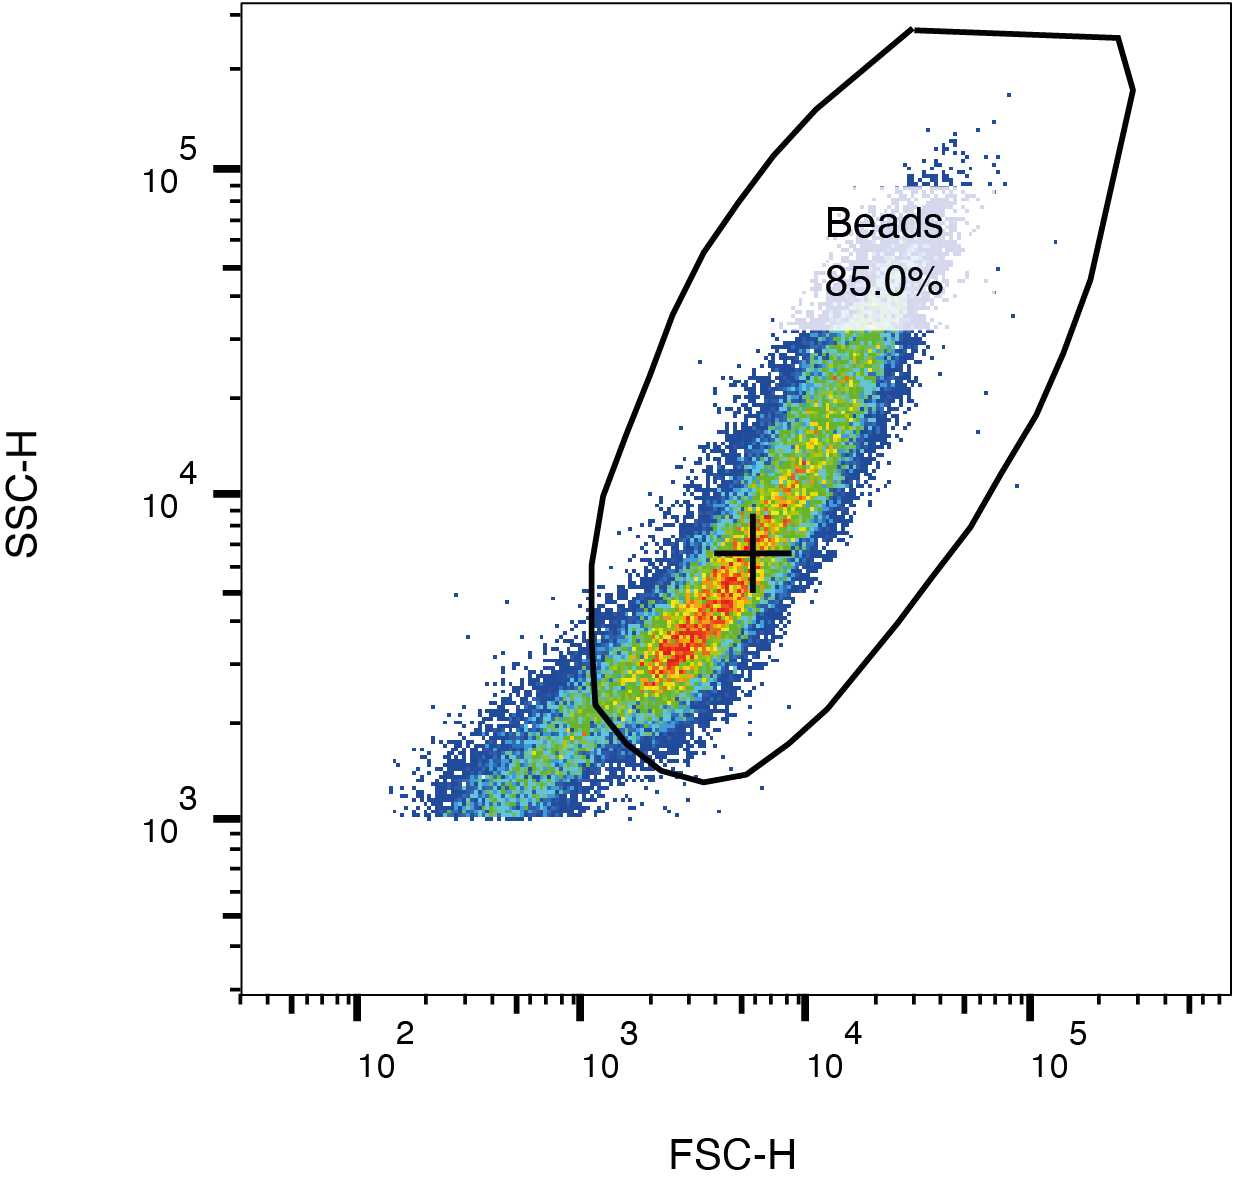
Gate the beads from the SSC and FSC plot as shown in the figure below.
From these population calculate the % of GolgiTracker+ beads either from the FITC vs FSC plot or from the FITC histogram.
In the workspace, create tables and graphs of the relevant samples.
Export tables and images in the preferred format.
Perform statistical analysis using Prism software or equivalent.


