Measuring growth rates of diatom cells in culture
Phoebe Argyle, Jana Hinners, Nathan G. Walworth, Sinéad Collins, Naomi M. Levine, Martina A. Doblin
Abstract
A method for measuring growth rates in diatoms, based on work with Thalassiosira spp. Used in:
Argyle, P. A., Walworth, N. G., Hinners, J., Collins, S., Levine, N. M., & Doblin, M. A. (2021). Multivariate trait analysis reveals diatom plasticity constrained to a reduced set of biological axes. ISME Communications , 1 (1), 59.
Argyle, P. A., Hinners, J., Walworth, N. G., Collins, S., Levine, N. M., & Doblin, M. A. (2021). A high-throughput assay for quantifying phenotypic traits of microalgae. Frontiers in microbiology , 12 , 706235.
Steps
Using In vivo fluorescence measurements
Measure the in vivo chlorophyll fluorescence of the culture using a fluorometer (using a test tube) or a plate reader (for cultures grown in tissue culture plates).
Equipment
| Value | Label |
|---|---|
| 10AU Solid secondary standards | NAME |
| Turner Designs Digital Fluorometer | TYPE |
| Turner designs | BRAND |
| 10-AU-904 | SKU |
| https://www.hoskin.ca/ | LINK |
Equipment
| Value | Label |
|---|---|
| Infinite® M1000 Pro | NAME |
| Microplate reader | TYPE |
| Tecan | BRAND |
| n/a | SKU |
| Note M1000 Pro no longer in production, newer models such as the Spark are available and will serve the same purpose. | SPECIFICATIONS |
For chlorophyll measurements in a plate reader, a 455/680 nm excitation/emission filter is used.
Using manual cell counts
Take an aliquot of culture:
Take daily aliquots of culture and take measurements immediately or fix using
The size of the aliquot depends on a number of things:
-Total volume of culture
-Approximate concentration
As multiple aliquots will be taken, it is important to not remove too much volume or biomass during the experiment, so as to not alter the conditions of the experiment too much. It is recommended to not remove more than 50% of the volume throughout the experiment, however less is preferable.
In order to accurately estimate concentration, a minimum of 200 cells should be counted. Therefore if a culture was initially inoculated at 2000 cells/mL, aliquots for growth estimation should be at least 100µL . The more cells counted, the greater the accuracy of the estimate.
If cells are clumping in the culture, gently agitate before taking the aliquot, take the aliquot from the center of the culture (rather than surface or bottom).
If the culture is slow growing, aliquots may be taken every second or third day, at the discretion of the researcher. However it is preferable to capture multiple data points during the exponential growth phase.
Measure the cell concentration.
Cell concentration from the aliquot may be estimated using a haemocytometer or or flow cytometry.
Equipment
| Value | Label |
|---|---|
| Neubauer Improved Haemocytometer Counting Chamber | NAME |
| Counting Chamber | TYPE |
| Hawksley | BRAND |
| AC1000 | SKU |
| Void depth: 0.1 mm | |
| Counting Area: 1mm² | SPECIFICATIONS |
For larger cells, a Sedgewick Rafter Counting chamber may be appropriate.
Equipment
| Value | Label |
|---|---|
| Sedgewick Rafter Counting Chamber | NAME |
| Microscopy counting chamber | TYPE |
| Graticules Optics | BRAND |
| 02B00417 | SKU |
Count the cells
Calculate the concentration of cells in the aliquot (remembering to account for the volume of the fixative if using preserved cells) and thus the concentration of the initial culture in cells per mL.
I.e. Cells counted per volume counted.
Calculate growth rates on two points
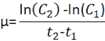
The classic equation for calculating microalgae growth rates based on two points is:
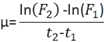
where F2 is the fluorescence measurement at time 2 (t2) in days and F1 is the fluorescence at time 1 (t1) in days if using in vivo fluorescence measurements.
Where cell counts are used, F2 and F1 are replaced with cell concentration at both times (C2 and C1).
Calculate growth rates for multiple time points
Calculating growth rates for multiple time points, a linear regression is used of the ln(Fluorescence) or ln(cell concentration) plotted against time. A linear regression fitted during the exponential growth phase gives the growth rate (the slope).

